저작자표시-비영리-변경금지 2.0 대한민국 이용자는 아래의 조건을 따르는 경우에 한하여 자유롭게 l 이 저작물을 복제, 배포, 전송, 전시, 공연 및 방송할 수 있습니다. 다음과 같은 조건을 따라야 합니다: l 귀하는, 이 저작물의 재이용이나 배포의 경우, 이 저작물에 적용된 이용허락조건 을 명확하게 나타내어야 합니다. l 저작권자로부터 별도의 허가를 받으면 이러한 조건들은 적용되지 않습니다. 저작권법에 따른 이용자의 권리는 위의 내용에 의하여 영향을 받지 않습니다. 이것은 이용허락규약(Legal Code)을 이해하기 쉽게 요약한 것입니다. Disclaimer 저작자표시. 귀하는 원저작자를 표시하여야 합니다. 비영리. 귀하는 이 저작물을 영리 목적으로 이용할 수 없습니다. 변경금지. 귀하는 이 저작물을 개작, 변형 또는 가공할 수 없습니다.
Literature Review on Prediction
Models for Atherosclerotic
Cardiovascular Diseases
Hyun-Hee Park
Graduate School of Public Health
Yonsei University
Literature Review on Prediction
Models for Atherosclerotic
Cardiovascular Diseases
Directed by Professor Sun Ha Jee
A Dissertation Thesis
Submitted to the Department of Epidemiology
and Health Promotion
and the Graduate School of Yonsei University
in partial fulfillment of the
requirements for the degree of
Master of Public Health
Hyun-Hee Park
December 2015
This certifies that the Master's Thesis
of Hyun-hee Park is approved.
___________________
Thesis Supervisor: Sun
H
a Jee
___________________
Thesis Commtittee Member #1: Hee Cheol Kang
___________________
Thesis Commtittee Member #2: Hee Jin Kimm
Graduate School of Public Health
Yonsei University
ACKNOWLEDGEMENTS
I would like to express my gratitude to all those who gave me the possibility to complete this thesis. I am deeply indebted to my supervisor Professor Sun Ha Jee for stimulating suggestions and encouragement in all the time or research and writing. I also thank Professor Hee Cheol Kang and Hee Jin Kimm, whose gave me unforgettable life lessons, big support, and a heartwarming encouragement.
I am always grateful to rainbow team and the member of 38th student council in graduate school. They wanted to create something youthful and fun for everyone to enjoy in graduate school life. They are so funny that I would never forget it. I believe they are the best in their positions.
In addition, I have to thank to Professor, fellow, nurses in the department of brain neurology center in Severance Hospital. I was helped about praise and courage.
In this very special moment, I would like to express my deepest thanks to my beloved family for their love encouragement and supports financially, mentally, and spiritually that made me possible to start and finish my study.
And most importantly, I would like to thank God for giving me a great guidance, forgiveness, and encouragement, while being my best friend though hard times.
Finally, I dedicate this volume in token of affection and gratitude to my mother.
TABLE OF CONTENTS
ABSTRACT···ⅳ
Ⅰ. INTRODUCTION···1
1. Background···1
2. Objectives···4
Ⅱ. MATERIALS AND METHODS···5
Ⅲ. RESULTS···6
1. General study characteristics···6
1.1. General study characteristics in the USA ···6
1.2. General study characteristics in other countries···8
1.3. General study characteristics in the validation and calibration··10
2. Models and outcomes of general characteristics···12
2.1. Characteristics of the statistical analysis models and discriminative outcomes in the USA···12
2.1.1 Characteristics of the statistical analysis models···12
2.1.2 Characteristics of the discriminative outcomes···13
2.2. Characteristics of the statistical analysis models and discriminative outcomes in other countries···15
2.3. Characteristics of the statistical analysis models and
discrimination of the validation and calibration outcomes···17
2.3.1. Characteristics of the statistical analysis models···17
2.3.2. Characteristics of the discriminative outcomes···18
3. General risk factors of the prediction models···20
3.1. General risk factors of the prediction models in the USA···20
3.2. General risk factors of the prediction models in other countries22 3.3. General risk factors of the prediction models in validation and calibration···24
4. Characteristic of the predictors···26
4.1. Characteristic of the predictors in the USA···26
4.2. Characteristic of the predictors in other countries···29
4.3. Characteristic of the predictors in validation calibration···32
Ⅳ. DISCUSSION···36
Ⅴ. CONCLUSION···39
REFERENCES···40
LIST OF TABLES
Table 1. General study characteristics (intended subject, f/u year, and
cohort name) in the USA···7
Table 2. General study characteristics (intended subject, f/u year, and cohort name) in other countries···9
Table 3. General study characteristics (intended subject, f/u year, and cohort name) in the validation and calibration study···11
Table 4. Characteristics of the statistical analysis models and discriminative outcomes in the USA···14
Table 5. Characteristics of the statistical analysis models and discriminative outcomes in other countries···16
Table 6. Characteristics of the statistical analysis models and discriminative outcomes in the validation and calibration study···19
Table 7. General risk factors of the prediction models in the USA···21
Table 8. General risk factors of the prediction models in other countries··23
Table 9. General risk factors of the prediction models in the validation and calibration study···25
Table 10. Characteristics of the predictors in the USA···27
Table 11. Characteristics of the predictors in the USA···28
Table 12. Characteristics of the predictors in other countries···30
Table 13. Characteristics of the predictors in other countries···31
Table 14. Characteristics of the predictors in the validation and calibration study···33
Table 15. Characteristics of the predictors in the validation and calibration study···34
ABSTRACT
Literature Review on Prediction Models for
Atherosclerotic Cardiovascular Diseases
Hyun-Hee Park Graduate School of Public Health Yonsei University
(Directed by Professor Sun Ha Jee, Ph.D.)
Introduction: Atherosclerotic Cardiovascular Diseases (ASCVD) is a major cause of death worldwide. The Framingham study has overestimated ASCVD risk in some populations, which has led to the concern that scores may be inappropriate for other populations. Thus, the development of prediction models for ASCVD has been meticulously studied.
Objectives: Past to modern predictive models were analyzed based on their general characteristics, models and outcomes of general characteristics, risk factors, and predictors through a systematic review of literature.
Methods: The literature searches were carried out with the literature databases PubMed and Google Scholar. This study reviewed the general characteristics, models and outcomes of the general characteristics, and general risk factors of the prediction models, and grouped the
Keywords: Atherosclerotic Cardiovascular Diseases, study, general characteristics, risk factors, predictors
characteristics of the variable factors into the following three categories: those in the USA, those in other countries, and those in validation and calibration studies.
Results: The statistical analysis showed a trend from the logistic regression model to the Cox proportional hazards model in the USA, in other countries, and in the validation and calibration study.
The definition of the outcomes was expanded from CHD and not CHD to Hard CHD or CVD in the USA. In the studies on other countries, the outcomes were defined as ICD codes and the incidence of CVD or the death probabilities, and whether they were Hard CHD or CVD. In the validation and calibration study, the definition of the outcomes was expanded to ASCVD.
For the general risk factors of the prediction model, the simple cholesterol, was combined with the expanding variables such as DM, smoking, the family history, the HTN medication, statin therapy, and exercise.
Conclusion: The results of this study provide important baseline information for prediction models for ASCVD.
І. INTRODUCTION
1. Background
Atherosclerotic cardiovascular diseases (ASCVD) is one of the leading causes of premature death and a major cause of disability in South Korea (National Statistical Office, 2013). According to the World Health Organization (WHO), 1.2 million people reportedly die from coronary heart disease (CHD) and stroke each year (WHO, 2005). Focusing on a single risk factor such as high blood pressure or serum cholesterol was not enough; an approach was needed that accounted for the multifactorial origin of cardiovascular disease (CVD). The requirements for comprehensive management of patients at high risk of CVD has increased (Jackson, 2000).
In previous researches, prediction models were derived from multivariable mathematical functions that assigned weights to major CHD risk factors such as sex, age, blood pressure, total cholesterol (TC), low-density lipoprotein cholesterol (LDL-C), high-density lipoprotein cholesterol (HDL-C), smoking behavior, and diabetes status (Jackson et al., 2005). This knowledge led to the development of multivariable risk prediction algorithms that incorporate risk factors (D’Agostino et al., 2008) that can be used by primary care physicians to assess individual patients’ risk of developing all types of atherosclerotic CVD (Conroy et al., 2003) or specific components of CVD, CHD (Anderson et al., 1991), stroke (Wolf et al.,
1991), peripheralvascular disease (PVD) (Murabito et al., 1997), or heart failure (HF) (Kannel et al., 1999).
Multivariable assessment has supported the estimation of the absolute CVD risk and guided the treatment of risk factors (British Cardiac Society, 2005; Jackson et al., 2005; Ahn et al., 2006; and D’Agostino et al., 2008).
The Framingham heart study has developed mathematical functions for predicting the risk of clinical CHD events. The primary purposes were to treat patients and decrease their risk assessment indicators in clinical trials, and prevent and control the disease (Kannel et al., 1976).
However, there are limitations in the application of the risk functions obtained from the Framingham study (Jee et al., 2008). Many guidelines recommend estimating the risk of CVD by combining different risk factors into a numeric estimate of risk (Cox et al., 2007). Recalibration of the Framingham functions could permit various regions of the world to adapt the Framingham tools to local populations (Liu et al., 2004). Directly applying the Framingham functions in some populations were overestimate the CHD risk (Hense et al., 2003).
Therefore, many countries developed a more accurate individual prediction model with modifications of the existing model (Hense et al., 2003; Liu J et al., 2003; Marrugat et al., 2003; Neuhauser et al., 2003; and Simons et al., 2003).
initiation of statin therapy in primary prevention patients with a predicted 10-year risk of greater than or equal to 7.5% (Kavousi et al., 2014; Munter et al., 2014). These new criteria could result in the recommendation that statin therapy be considered in the more than 45 million middle-aged Americans who do not have CVD (33,090,000 at ≥7.5% 10-year risk and 12,766,000 at >5.0-7.4% 10-year risk). This number is equivalent to about one in every three American adults, many of whom are already on statin treatment under the older US guidelines (Stone et al., 2013).
This study reviewed the general characteristics, models, and outcomes of the general characteristics and general risk factors of prediction models, and the characteristics of the variable factors into the following three categories: in the USA, in other countries, and in validation and calibration studies.
2. Objectives
Past to modern predictive models were analyzed based on their general characteristics, risk factors, and predictors in the systematic review of literature. The analysis would contribute to the baseline for the prevention and management of ASCVD.
The specific objectives of the analysis are as follows. 1. To trace the history of ASCVD in prediction models.
2. To analyze the general characteristics of the Framingham study among individual studies in the USA, other countries, and validation and calibration studies.
3. To provide important information on the baseline in the prediction models for ASCVDs.
II. MATERIALS AND METHODS
Past to modern predictive models were analyzed Twenty-one of them met the inclusion criteria. They were classified into three categories: those who had participated in the Framingham Study in the USA (seven), those who had participated in the prediction of several countries’ models (seven), and those who had articles of validation and calibration multiple cohorts (seven). Each individual empirical investigation was carefully evaluated according to the following central methodological points: (1) general study characteristics, (2) models and outcomes of the general characteristics, (3) General risk factors of the prediction models, and (4) the characteristics of the predictors. The literature searches were carried out with the literature databases PubMed, Google Scholar, Circulation, JAHA (Journal of the American Heart Association), JAMA (Journal of the American Medical Association), ELSEVIER, JCD (Journal of Chronic Diseases), European Society of Cardiology, MJA (Medical Journal of Australia), NMCD (Nutrition, Metabolism, and Cardiovascular Diseases), BMJ (British Medical Journal), Cardiologia, researchgate, ACP (Annals of Internal Medicine), KOSIS (Korean Statistical Information Service), and Lancet, as well as with online databases.
III. RESULTS
1. General study characteristics
1.1. General study characteristics in the USA
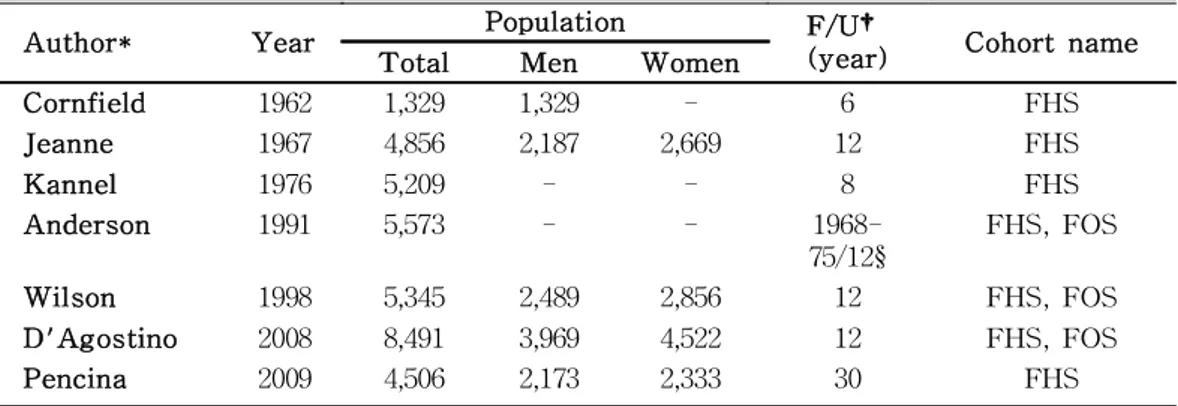
Table 1. Cornfield (1962), Jeanne et al. (1967), Kannel et al. (1976), and Pencina et al. (2009) all used the Framingham Study. Anderson et al. (1991), Wilson et al. (1998), and D’Agostino et al. (2008) used the Framingham Study and the Framingham Offspring Study.
Kannel et al. (1976) performed the Framingham Study on a total of 5,209 subjects with a follow-up period of 12 years. However, we searched for the more classic study of Cornfield (1962). The results showed that serum cholesterol and systolic blood pressure are risk factors of CHD in the Framingham, Massachusetts cohort. A multivariate analysis of the risk of CHD over 12 years was performed (Jeanne et al., 1967). The standard risk factors remained strong predictors of hard CVD over the extended follow-up period. Thirty-year risk prediction functions offer additional risk burden information that complements that of the 10-year functions (Pencina et al., 2009).
Many researchers have used, developed, and provided to people the Framingham Study.
Author* Year Population F/U†
(year) Cohort name
Total Men Women
Cornfield 1962 1,329 1,329 - 6 FHS Jeanne 1967 4,856 2,187 2,669 12 FHS Kannel 1976 5,209 - - 8 FHS Anderson 1991 5,573 - - 1968-75/12§ FHS, FOS Wilson 1998 5,345 2,489 2,856 12 FHS, FOS D'Agostino 2008 8,491 3,969 4,522 12 FHS, FOS Pencina 2009 4,506 2,173 2,333 30 FHS
Table 1. General study characteristics (intended subject, f/u year, and cohort name) in the USA
FHS = the Framingham Study; FOS = the Framingham Offspring Study *The first author
†Follow- up years or period
1.2. General study characteristics in other countries
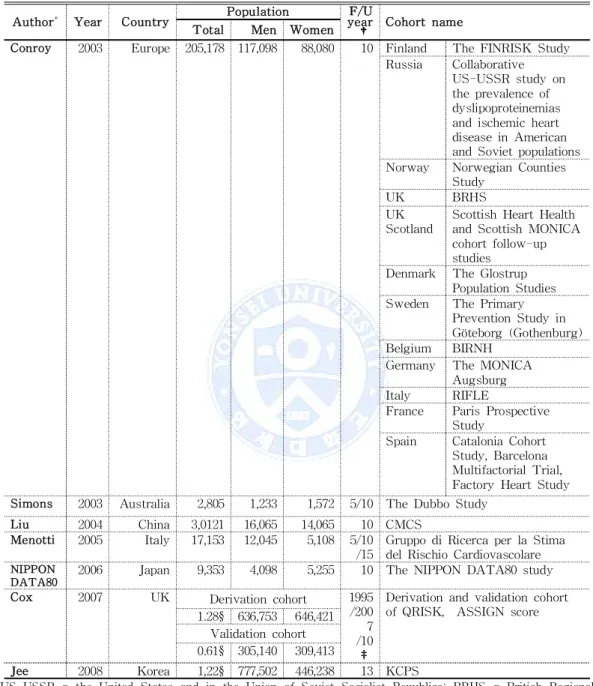
Many guidelines recommend estimation of the risk of CVD by combining different risk factors into a numeric estimate of risk (Cox et al., 2007). Therefore, many countries published new prediction models for their own people.
Table 2. The study estimated the 10-year risk of fatal CVD in Europe (Conroy et al., 2003). The Dubbo Study derived a simple CVD risk function specifically for elderly Australians, which uses risk factors readily accessible to all medical practitioners (Simons et al., 2003). The original Framingham functions overestimated the risk of CHD in the Chinese multi-provincial cohort study (CMCS) participants (Liu et al., 2004). New tools for predicting the CVD risk were derived from the Italian population studies of Riskard (2005) and Menotti et al. (2005). The NIPPON DATA80 Research Group (2006) conducted a risk assessment of death from CVD based on a 19-year follow-up study of a Japanese representative population, which was used as a health education tool for lifestyle modification-targeting individuals with CVD risk factors. The study derived and validated the QRISK and the new CVD risk score ASSIGN for the United Kingdom (UK) (Cox et al., 2007). The study developed a stroke risk prediction model for Koreans with a high risk of stroke (Jee et al., 2008).
Author* Year Country Population yearF/U
† Cohort name Total Men Women
Conroy 2003 Europe 205,178 117,098 88,080 10 Finland The FINRISK Study Russia Collaborative
US-USSR study on the prevalence of dyslipoproteinemias and ischemic heart disease in American and Soviet populations Norway Norwegian Counties
Study
UK BRHS
UK Scotland
Scottish Heart Health and Scottish MONICA cohort follow-up studies
Denmark The Glostrup Population Studies Sweden The Primary
Prevention Study in Göteborg (Gothenburg) Belgium BIRNH
Germany The MONICA Augsburg Italy RIFLE
France Paris Prospective Study
Spain Catalonia Cohort Study, Barcelona Multifactorial Trial, Factory Heart Study Simons 2003 Australia 2,805 1,233 1,572 5/10 The Dubbo Study
Liu 2004 China 3,0121 16,065 14,065 10 CMCS Menotti 2005 Italy 17,153 12,045 5,108 5/10
/15
Gruppo di Ricerca per la Stima del Rischio Cardiovascolare
NIPPON
DATA80 2006 Japan 9,353 4,098 5,255 10 The NIPPON DATA80 study
Cox 2007 UK Derivation cohort 1995 /200 7 /10 ‡
Derivation and validation cohort of QRISK, ASSIGN score 1.28§ 636,753 646,421
Validation cohort 0.61§ 305,140 309,413
Jee 2008 Korea 1,22§ 777,502 446,238 13 KCPS
Table 2. General study characteristics (intended subject, f/u year, and cohort name) in other countries
US-USSR = the United States and in the Union of Soviet Socialist Republics; BRHS = British Regional Heart Study; BIRNH = Belgian Interuniversity Research on Nutrition and Health; MONICA = Monitoring Of Trends and determinants In Cardiovascular disease surveys; RIFLE = Risk Factors and Life Expectancy; CMCS = the Chinese Multi-provincial Cohort Study; NIPPON DATA= National Integrated Project for Prospective Observation of Non-communicable Disease And its Trends in the Aged prediction algorithm for CVD that uses traditional risk factors; KCPS = the Korean Cancer Prevention Study *
The first author † Follow- up years or period ‡From1 January 1995 and 1 April 2007, 10 -year risk predictions § million
1.3. General study characteristics in the validation and calibration study
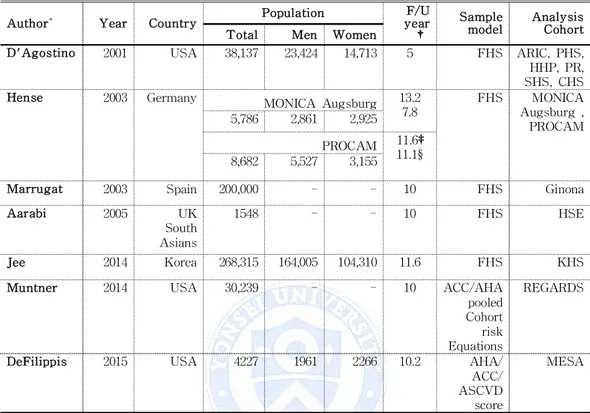
Table 3. The Framingham Study in the USA validated and calibrated the CHD and CVD prediction scores. All the analyses were sex- and race-specific, and the prediction functions performed well among whites and blacks in different settings and can be applied to other ethnic groups such as ARIC, PHS, HHP, PR, SHS, and CHS (D’Agostino et al., 2001). The MONICA Augsburg and PROCAM cohorts in Germany compared the observation and prediction of coronary risk (Hense et al., 2003). The Spain cohort of the Girona REGICOR calibrated the Framingham Study (Marrugat et al., 2003). The study was based on an analysis of data from the Health Survey for England (HSE) in 1998 and 1999 for the development of a simple method of adjusting the Framingham equation to estimate coronary risk in South Asians, which could then be applied to existing simple paper-based tools (Aarabi et al., 2005). These equations were calibrated and differentiated to predict the ASCVD risk in a contemporary population-based cohort, that of the REasons for Geographic And Racial Differences in Stroke (REGARDS) Study (Muntner et al., 2014). The CHD risk model was compared with the Framingham CHD risk score in the Korean Heart Study (KHS) population (Jee et al., 2014). The calibration and discrimination were analyzed among multiple cardiovascular risk scores in a modern multi-ethnic cohort (DeFilippis et al., 2015).
Author* Year Country Population yearF/U † Sample model Analysis Cohort Total Men Women
D'Agostino 2001 USA 38,137 23,424 14,713 5 FHS ARIC, PHS, HHP, PR, SHS, CHS Hense 2003 Germany MONICA Augsburg 13.2
7.8 FHS MONICA Augsburg , PROCAM 5,786 2,861 2,925 PROCAM 11.6‡ 11.1§ 8,682 5,527 3,155
Marrugat 2003 Spain 200,000 - - 10 FHS Ginona
Aarabi 2005 UK
South Asians
1548 - - 10 FHS HSE
Jee 2014 Korea 268,315 164,005 104,310 11.6 FHS KHS
Muntner 2014 USA 30,239 - - 10 ACC/AHA
pooled Cohort risk Equations
REGARDS
DeFilippis 2015 USA 4227 1961 2266 10.2 AHA/ ACC/ ASCVD score
MESA
Table 3. General study characteristics (intended subject, f/u year, and cohort name) in the validation and calibration study
FHS = the framingham study; ARIC = the Atherosclerosis Risk in Communities Study(1987-1988); PHS = Physicians’ Health Study(1982); HHP = Honolulu Heart Program(1980-1982); PR =Puerto Rico Heart Health Program (1965-1968); SHS = Strong Heart Study(1989-1991); CHS = Cardiovascular Health Study(1989-1990); MONICA = Monitoring Of Trends and determinants In Cardiovascular disease surveys; PROCAM = Prospective Cardiovascular Muenster Study from northwestern Germany; Girona = the Spanish population study; HSE = the Health Survey for England; ACC/AHA =American College of Cardiology and the American Heart Association; REGARDS = the REasons for Geographic And Racial Differences in Stroke study; KHS = the Korean Heart Study; MESA = Multi-Ethnic Study of Atherosclerosis
* The first author
†Follow- up years or period ‡male § female
2. Models and outcomes of the general study
characteristics
2.1. Characteristics of the statistical analysis models and discriminative outcomes in the USA
2.1.1 Characteristics of the statistical analysis models
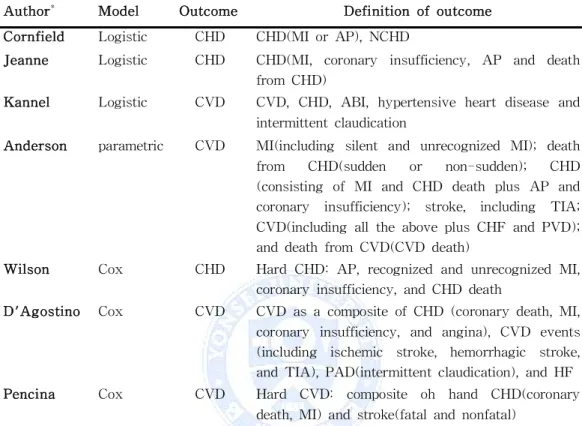
Table 4. The logistic regression model for conditional risk was assumed that was, the probability that the disease was manifested in a specified time period given a set of variables from the data. The estimation was based on the method of Walker-Duncan (Kannel et al., 1976). The parametric model used was seen to have several advantages over existing standard regression models. Unlike logistic regression, it can provide predictions for different lengths of time, and express probabilities in a more straightforward way than in the Cox proportional hazards model (Anderson et al., 1991). The Cox proportional hazards regression assumed that on each individual are available values of one or more explanatory variables. The hazard function (the age-specific failure rate) is taken to be a function of the explanatory variables and unknown regression coefficients multiplied by an arbitrary and unknown function of time (Cox, 1972). The statistical tests included age-adjusted linear regression or logistic regression to test for trends across the blood pressure, TC, LDL-C, and
2.1.2 Characteristics of the discriminative outcomes
Table 4. The case with one variable and in which those who had CVD and those who did not (NCHD) were considered two separate populations experienced a new coronary event during the study period (Cornfield, 1962). CHD included all forms of definite myocardial infarction, coronary insufficiency, angina pectoris, and death from CHD (Jeanne et al., 1967). As in all previous publications that reported results in Framingham, the subjects lost to the follow-up were treated as not CHD patients, so they were investigated. The definition of the outcome included CVD and CHD (Kannel et al., 1976), and myocardial infarction in CVD (Anderson et al., 1990). The study was followed up over a 12-year period for the development of CHD (angina pectoris, recognized and unrecognized myocardial infarctions, coronary insufficiency, and CHD death), according to previously published criteria (Wilson et al., 1998). CVD was designated as a composite of CHD cerebrovascular events, peripheral artery disease, and HF (D’Agostino et al., 2008 and Pencina et al., 2009). In the past, CHD and CVD outcomes were differentiated in a narrow sense; but in recent years, outcomes started being defined as comprehensive hard CHD.
Author* Model Outcome Definition of outcome
Cornfield Logistic CHD CHD(MI or AP), NCHD
Jeanne Logistic CHD CHD(MI, coronary insufficiency, AP and death
from CHD)
Kannel Logistic CVD CVD, CHD, ABI, hypertensive heart disease and
intermittent claudication
Anderson parametric CVD MI(including silent and unrecognized MI); death
from CHD(sudden or non-sudden); CHD
(consisting of MI and CHD death plus AP and coronary insufficiency); stroke, including TIA; CVD(including all the above plus CHF and PVD); and death from CVD(CVD death)
Wilson Cox CHD Hard CHD: AP, recognized and unrecognized MI,
coronary insufficiency, and CHD death
D'Agostino Cox CVD CVD as a composite of CHD (coronary death, MI,
coronary insufficiency, and angina), CVD events (including ischemic stroke, hemorrhagic stroke, and TIA), PAD(intermittent claudication), and HF
Pencina Cox CVD Hard CVD: composite oh hand CHD(coronary
death, MI) and stroke(fatal and nonfatal)
Table 4. Characteristics of the statistical analysis models and discriminative outcomes in the USA
Logistic = logistic regression model; Cox = the Cox proportional hazards model; CVD = cardiovascular disease; CHD= coronary heart disease; NCHD = not coronary heart disease; MI = myocardial infarction; AP = angina pectoris; ABI = atherothrombotic brain infarction; TIA = transient ischemic attack; PAD = peripheral artery disease; CHF = congestive heart failure; PVD =peripheral vascular disease; HF = heart failure * The first author
2.2. Characteristics of the statistical analysis models and discriminative outcomes in other countries
2.2.1. Characteristics of the statistical analysis models
Table 5. The Weibull model was stratified by cohort and sex-that is, separate hazard functions were calculated for men and women in each of the component cohorts, but the risk factor coefficients were calculated from the whole dataset (Conroy et al., 2003).
The absolute 10-year risk of hard CHD was predicted with the Cox regression model developed by Framingham investigators, wherein P = 1 -S(t)exp(f[x,M]) and f(x,M) = β
1(x1-M1) + . . . + βp (xp - Mp). Here, β1 . . . ,p
are the regression coefficients, x1 . . . xp represent individualficients, the
xHD 1 . . . Mp are the mean values of the risk factors in the cohort, and
S(t) is the survival rate at the mean values of the risk factors at time t (t = 10 years) (D’Agostino et al., 2001 and Liu et al., 2003).
The Weibull statistical analysis model is used in Europe (Conroy et al., 2003); the logistic regression model, in Australia (Simons et al., 2003); and the Cox regression model, in China (Liu et al., 2003), Italy (Menotti et al., 2005), Japan (NIPPON DATA80, 2006), the UK (Cox et al., 2007), and Korea (Jee et al., 2008).
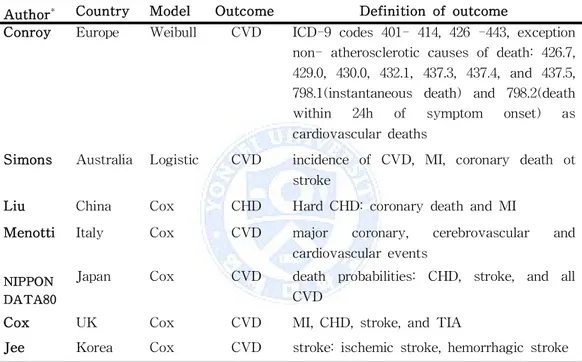
2.2.2. Characteristics of the discriminative outcomes
Table 5. The outcome was defined based on the International Classification of Disease (ICD) codes in Europe (Conroy et al., 2003), CVD and hard CHD in Australia (Simons et al., 2003), coronary death and myocardial infarction of hard CHD in China (Liu et al., 2003), major CVD in Italy
Author* Country Model Outcome Definition of outcome
Conroy Europe Weibull CVD ICD-9 codes 401- 414, 426 -443, exception
non- atherosclerotic causes of death: 426.7, 429.0, 430.0, 432.1, 437.3, 437.4, and 437.5, 798.1(instantaneous death) and 798.2(death
within 24h of symptom onset) as
cardiovascular deaths
Simons Australia Logistic CVD incidence of CVD, MI, coronary death ot
stroke
Liu China Cox CHD Hard CHD: coronary death and MI
Menotti Italy Cox CVD major coronary, cerebrovascular and
cardiovascular events
NIPPON DATA80
Japan Cox CVD death probabilities: CHD, stroke, and all
CVD
Cox UK Cox CVD MI, CHD, stroke, and TIA
Jee Korea Cox CVD stroke: ischemic stroke, hemorrhagic stroke
(Menotti et al., 2005), combined CVD and CHD via CVD in Japan (NIPPON DATA80, 2006), and major CVD in the UK (Cox et al., 2007). The incidence of stroke included whole and subtype incidences of ischemic and hemorrhagic stroke (Jee et al., 2008).
Table 5. Characteristics of the statistical analysis models and discriminative outcomes in other countries
Weibull = Weibull proportional hazards model; Logistic = logistic regression model; Cox = the Cox proportional hazards model; ICD = Internation Classification of Disease; CVD = cardiovascular disease; CHD= coronary heart disease; MI = myocardial infarction; TIA = transient ischemic attack
2.3. Characteristics of the statistical analysis models and discrimination of the outcomes in the validation and calibration study 2.3.1. Characteristics of the statistical analysis models
Table 6. The Cox proportional hazards model yielded regression coefficients for the Framingham and non-Framingham cohorts (D’Agostino et al., 2001). The Framingham equations were able to correctly predict CHD events using receiver operating characteristic (ROC) (Hense et al., 2003) analyses and computations of areas-under-the-curve (AUC-statistic) (Hanley and McNeil, 1983), as well as the procedures suggested by Miller et al. (1991). The Cox model used a reliable estimation of the local risk factor prevalence, as well as the local coronary event incidence rate considered, and the original equation coefficients (Marrugat et al., 2003). The ROC plot was used to compare the different adjustments in the primary role of identifying individuals above or below a given risk threshold (Aarabi et al. 2005).
Cox proportional hazards regression models were fitted to the Korean CHD risk score (KRS) with the basic model using the continuous form of the Net Reclassification Index (NRI) for the 10-year risk of CHD (Jee et al., 2014). The calibration of the Pooled Cohort risk equations was determined using the observed and predicted numbers of ASCVD events (Muntner et al., 2014) at a five-year follow-up in each decile and a modified Hosmer-Lemeshow chi-square statistic (Harrell et al., 1996). The Cox-statistic used as models the Framingham risk score (FRS), the original Framingham risk prediction algorithm to predict CHD (FRS-CHD),
and the Adult Treatment Panel III (ATPIII), and recommended a modified FRS (ATPIII-FRS-CHD) (DeFilippis et al., 2015).
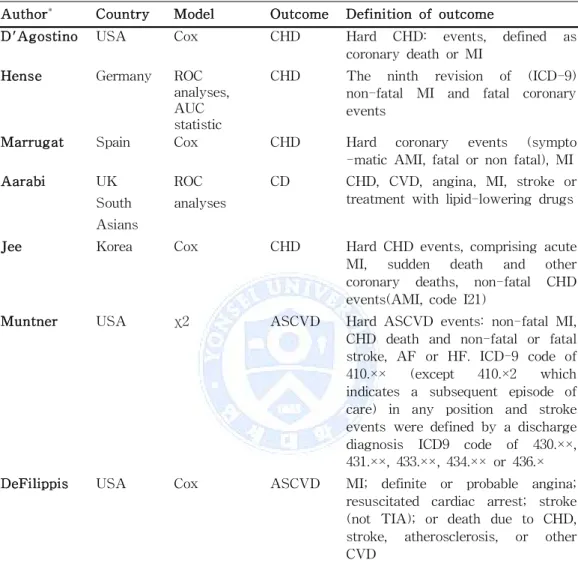
2.3.2. Characteristics of the discriminative outcomes
Table 6. Definition of the outcome: a hard CHD (D’Agostino et al., 2001); ICD-9 (Hense et al., 2003); hard coronary events (Marrugat et al., 2003); CHD, CVD, angina, MI, stroke, or treatment with lipid-lowering drugs in CD (Aarabi et al., 2005); non-fatal CHD events (acute myocardial infarction or code I21) in hard CHD (Jee et al., 2014); a hard ASCVD event as an ICD-9 code in ASCVD (Muntner et al., 2014); and MI or death due to CHD or CVD in ASCVD (DeFilippis et al., 2015).
Author* Country Model Outcome Definition of outcome
D'Agostino USA Cox CHD Hard CHD: events, defined as
coronary death or MI
Hense Germany ROC
analyses, AUC statistic
CHD The ninth revision of (ICD-9)
non-fatal MI and fatal coronary
events
Marrugat Spain Cox CHD Hard coronary events (sympto
-matic AMI, fatal or non fatal), MI
Aarabi UK
South Asians
ROC analyses
CD CHD, CVD, angina, MI, stroke or
treatment with lipid-lowering drugs
Jee Korea Cox CHD Hard CHD events, comprising acute
MI, sudden death and other
coronary deaths, non-fatal CHD
events(AMI, code I21)
Muntner USA χ2 ASCVD Hard ASCVD events: non-fatal MI,
CHD death and non-fatal or fatal stroke, AF or HF. ICD-9 code of
410.×× (except 410.×2 which
indicates a subsequent episode of care) in any position and stroke events were defined by a discharge
diagnosis ICD9 code of 430.××,
431.××, 433.××, 434.×× or 436.×
DeFilippis USA Cox ASCVD MI; definite or probable angina;
resuscitated cardiac arrest; stroke (not TIA); or death due to CHD, stroke, atherosclerosis, or other CVD
Table 6. Characteristics of statistical analysis models and discriminative outcome in validation and calibration
Cox = the Cox proportional hazards model; ROC = receiver operating characteristic; AUC = areas-under-the curve; x2 = Hosmer-Lemeshow Chi-squared; CHD= coronary heart disease; ICD
= Internation Classification of Disease; MI = myocardial infarction; CVD = cardiovascular disease; CD = coronary disease; AMI = Acute Myocardial Infarction; AF = atrial fibrillation; HF = Heart Failure; ASCVD =arteriosclerotic cardiovascular disease; TIA = transient ischemic attack;
3. General risk factors of the prediction models
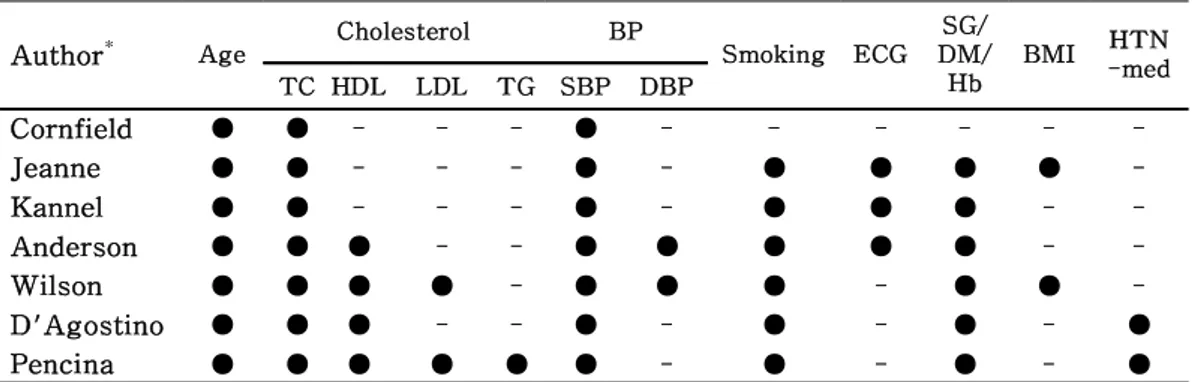
3.1. General risk factors of the prediction models in the USA
Table 7. The study exposed combinations of serum cholesterol and SBP in CHD (Cornfield, 1962). Seven risk factors measured in the initial examination were investigated (Jeanne et al., 1967), and seven risk factors without BMI were used (Kannel et al., 1976). The potential importance of controlling multiple risk factors demonstrated that total cholesterol and HDL cholesterol are of little statistical significance because it might be expected that an equation developed to predict CHD would not be particularly effective in estimating the risk of stroke (Anderson et al., 1990). Sex-specific prediction equations were formulated to predict the CHD risk according to the age, diabetes, smoking habit, JNC-V blood pressure categories, and NCEP total cholesterol and LDL cholesterol categories (Wilson et al., 1998). Sex-specific multivariable risk functions (sex-specific multivariable risk functions, total cholesterol, and LDL cholesterol categories) might be expected from an equation developed for treatment of hypertension, smoking, and diabetes (D’Agostino et al., 2008). The standard risk factors measured at the baseline were significantly related to the incidence of hard CVD, upon which BMI loses its significance. This finding illustrates how the effect of BMI is mediated through other risk factors (Pencina et al., 2009).
Author* Age Cholesterol BP Smoking ECG SG/ DM/ Hb BMI HTN -med TC HDL LDL TG SBP DBP Cornfield ● ● - - - ● - - - -Jeanne ● ● - - - ● - ● ● ● ● -Kannel ● ● - - - ● - ● ● ● - -Anderson ● ● ● - - ● ● ● ● ● - -Wilson ● ● ● ● - ● ● ● - ● ● -D'Agostino ● ● ● - - ● - ● - ● - ● Pencina ● ● ● ● ● ● - ● - ● - ●
Table 7. General risk factors of the prediction models in the USA
BP = blood pressure; ECG = electrocardiography; SG = serum glucose; DM = Diabetes Mellitus; Hb = hemoglobin; BMI = body mass index; HTN = Hypertension; HTN med. = Hypertension medication; TC = total cholesterol; HDL = high-density lipoprotein; LDL = low density lipoprotein; TG = triglyceride; SBP = systolic blood pressure; DBP =diastolic blood pressure * The first author
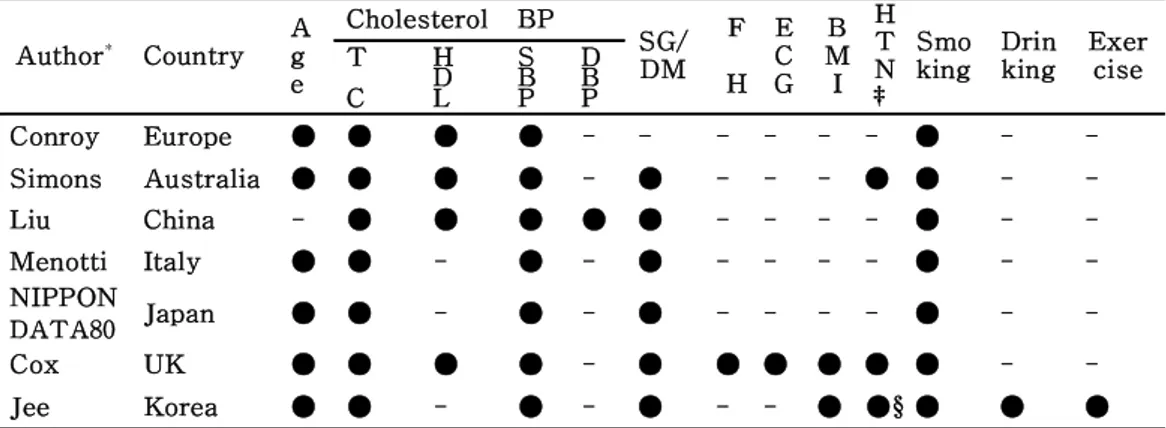
3.2. General risk factors of the prediction models in other countries Table 8. The guidelines for risk factor management issued by the first joint task force of the European societies on coronary prevention (Pyy Gui et al., 1994) used a simple risk chart in Europe (Conroy et al., 2003). CVD incidence significantly predicted factors in Australia (Simons et al., 2003). CVD incidence was assigned as the end-point in the comparisons of the risk factors in China (Liu et al., 2003). The risk factors used in the estimate were the sex, age, SBP, serum cholesterol, diabetes, and cigarette smoking in Italy (Menotti et al., 2005) and Japan (NIPPON DATA80, 2006). The risk factors in the UK were the age, sex, smoking status, SBP, ratio of the total serum cholesterol to the HDL, BMI, family history of CHD in a first-degree relative aged less than 60, area measure of deprivation, and existing treatment with an antihypertensive agent in the UK (Cox et al., 2007). The risk factors of stroke were the age, systolic blood pressure, diabetes, total cholesterol, cigarette smoking, physical activity, BMI, and alcohol intake (Jee et al., 2008).
Author* Country Ag e Cholesterol BP SG/ DM F H E C G B M I H T N ‡ Smo king Drin king Exer cise T C H D L S B P D B P Conroy Europe ● ● ● ● - - - ● - -Simons Australia ● ● ● ● - ● - - - ● ● - -Liu China - ● ● ● ● ● - - - - ● - -Menotti Italy ● ● - ● - ● - - - - ● - -NIPPON DATA80 Japan ● ● - ● - ● - - - - ● - -Cox UK ● ● ● ● - ● ● ● ● ● ● - -Jee Korea ● ● - ● - ● - - ● ●§ ● ● ●
Table 8. General risk factors of the prediction models in other countries
BP = blood pressure; SG = serum glucose; DM = Diabetes Mellitus; FH = family history; ECG = electrocardiography; HTN = Hypertension; HTN-med.= HTN medication status; BMI = body mass index; TC = total cholesterol; HDL = high-density lipoprotein; LDL = low density lipoprotein; SBP = systolic blood pressure; DBP =diastolic blood pressure;
3.3. General risk factors of the prediction models in the validation and calibration study
Table 9.
Sex- and race-specific JNC-V blood pressure and NCEPATP II cholesterol categories, along with age, current smoking habit, and presence of diabetes, related to the occurrence of hard CHD events (D'Agostino et al., 2001). The prediction equations were based on individual risk factor levels that included the age, SBP, TC/HDL ratio, and dichotomous diabetes and smoking variables, and used censored times to the event (Hense et al., 2003). The different adjustments investigated were fixed increments of the age, TC, and TC:HDL ratio, and multipliers of the TC:HDL cholesterol ratio (Aarabi et al., 2005). The risk factors were the age, blood pressure, total and HDL-C, diabetes, and smoking. In addition, triglycerides and LDL-C were considered for inclusion in the KRS (Jee et al., 2014). Information on the participants’ age, race, sex, smoking status, prior diagnosed co-morbid conditions, and use of antihypertensive and anti-diabetes medications was collected (Muntner et al., 2014). These risk scores were compared in the age-, sex-, and race-balanced medical history, anthropometric measurements, and laboratory data such as HbA1c,Author* Country R a c e A g e Cholestero l BP SG/ DM B M I F H H T N§ Smo king Statin thera py hs -C R P T C H D L L D L S B P D B P
D'Agostino USA ● ● ● ● - ● ● ● - - - ● -
-Hense Germany - ● ● ● - ● - ● - - - ● - -Marrugat Spain - ● ● ● - ● ● ● - - - ● - -Aarabi UK - ● ● ● - ● - - - -Jee Korea - ● - ● ● ● ● ● - - - ● - -Muntner USA ● ● ● ● ● ● - ● - - ● ● ● -DeFilippis USA ● ● ● ● - ● - ●± ● ● ● ● - ●
Table 9. General risk factors of the prediction models in the validation and calibration study
BP = blood pressure; SG = serum glucose; DM = Diabetes Mellitus; BMI = body mass index; FH = family history; HTN = Hypertension; HTN-med.= HTN medication status; hs-CRP = high-sensitivity C-reactive protein; TC = total cholesterol; HDL = high-density lipoprotein; LDL = low-density lipoprotein; SBP = systolic blood pressure; DBP =diastolic blood pressure; HbA1c =
hemoglobin A1c
* The first author ± hemoglobin A1c(HbA1c) § HTN medication status
4. Characteristics of the predictors
4.1. Characteristics of the predictors in the USA
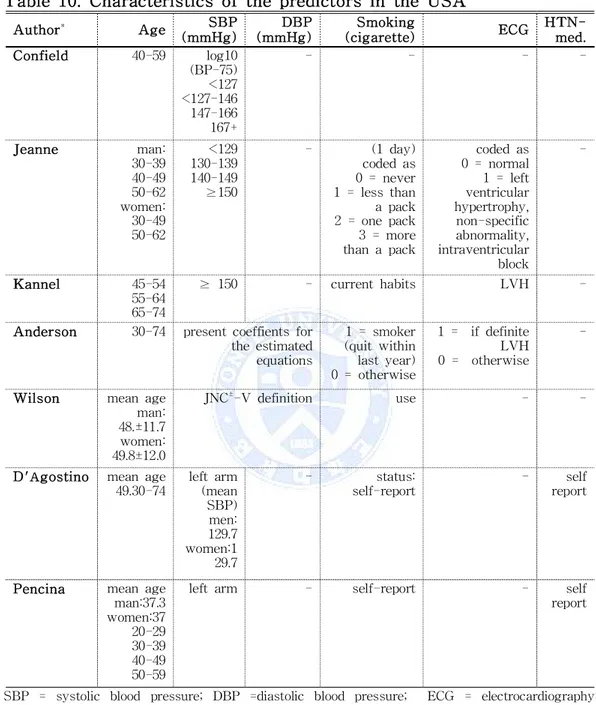
Table 10. The age and SBP were stratified continuous variables (Cornfield ,1962; Jeanne et al., 1967; Kannel et al., 1976; Anderson et al., 1991; Wilson et al., 1998; D'Agostino et al., 2008; and Pencina et al., 2009).
The questionnaire included questions about cigarette smoking, after which the author made nominal variables. The ECG results were checked, and then nominal variables were set up (Kannel et al., 1976; D'Agostino et al., 2008; and Pencina et al., 2009).
The self-reported HTN medication was ascertained as a nominal variable (D'Agostino et al., 2008 and Pencina et al., 2009).
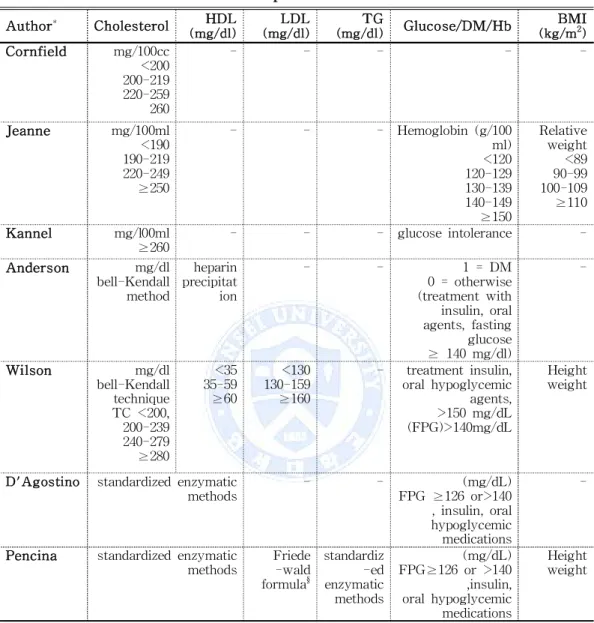
Table 11. All the authors decided that cholesterol was a risk factor of ASCVD, so the bell-Kendall technique or standardized enzymatic methods were used. Also, glucose/DM/Hb were found to be important predictors of CVD and CHD, as were the fasting plasma glucose and the combined DM history or medication (Wilson et al., 1998; D'Agostino et al., 2008; and Pencina et al., 2009).
Author* Age SBP (mmHg) DBP (mmHg) Smoking (cigarette) ECG HTN-med. Confield 40-59 log10 (BP-75) <127 <127-146 147-166 167+ - - - -Jeanne man: 30-39 40-49 50-62 women: 30-49 50-62 <129 130-139 140-149 ≥150 - (1 day) coded as 0 = never 1 = less than a pack 2 = one pack 3 = more than a pack coded as 0 = normal 1 = left ventricular hypertrophy, non-specific abnormality, intraventricular block -Kannel 45-54 55-64 65-74 ≥ 150 - current habits LVH
-Anderson 30-74 present coeffients for
the estimated equations 1 = smoker (quit within last year) 0 = otherwise 1 = if definite LVH 0 = otherwise
-Wilson mean age
man: 48.±11.7 women: 49.8±12.0
JNC±-V definition use -
-D'Agostino mean age
49.30-74 left arm (mean SBP) men: 129.7 women:1 29.7 - status: self-report - self report
Pencina mean age
man:37.3 women:37 20-29 30-39 40-49 50-59
left arm - self-report - self
report
Table 10. Characteristics of the predictors in the USA
SBP = systolic blood pressure; DBP =diastolic blood pressure; ECG = electrocardiography; ECG-LVH = electrocardiography left ventricular hypertrophy; HTN = hypertension; HTN-med.= hypertension medication status * The first author ± Fifth Joint National Committee on Hypertension = JNC-V definition: optimal SBP <120, DBP <80, normal SBP 120-129, DBP 80-84 high normal SBP 130-139, DBP 85-89, HTN stage I SBP140- 159, DBP 90-99 , HTN stage II– IV SBP≥160, DBP≥100
Author* Cholesterol HDL (mg/dl) LDL (mg/dl) TG (mg/dl) Glucose/DM/Hb BMI (kg/m2) Cornfield mg/100cc <200 200-219 220-259 260 - - - - -Jeanne mg/100ml <190 190-219 220-249 ≥250 - - - Hemoglobin (g/100 ml) <120 120-129 130-139 140-149 ≥150 Relative weight <89 90-99 100-109 ≥110 Kannel mg/l00ml ≥260 - - - glucose intolerance -Anderson mg/dl bell-Kendall method heparin precipitat ion - - 1 = DM 0 = otherwise (treatment with insulin, oral agents, fasting glucose ≥ 140 mg/dl) -Wilson mg/dl bell-Kendall technique TC <200, 200-239 240-279 ≥280 <35 35-59 ≥60 <130 130-159 ≥160 - treatment insulin, oral hypoglycemic agents, >150 mg/dL (FPG)>140mg/dL Height weight
D'Agostino standardized enzymatic methods - - (mg/dL) FPG ≥126 or>140 , insulin, oral hypoglycemic medications
-Pencina standardized enzymatic
methods Friede -wald formula§ standardiz -ed enzymatic methods (mg/dL) FPG≥126 or >140 ,insulin, oral hypoglycemic medications Height weight
Table 11. Characteristics of the predictors in the USA
HDL = high-density lipoprotein; LDL = low-density lipoprotein; TG = triglyceride; DM = Diabetes Mellitus; Hb = hemoglobin; BMI = body mass index; FPG = fasting plasma glucose * The first author
§ estimation of the concentration of low-density lipoprotein cholesterol in Plasma, without use of the preparative ultracentrifuge
4.2. Characteristics of the predictors in other countries
Table 12. In Europe, Australia, China, Italy, Japan, the UK, and Korea, the continuous variables of the age and SBP were used. All these countries used nominal variables in smoking. In most of the countries, two categories for smoking were set up; but in Italy, four categories were used (Menotti et al., 2005). The UK investigated the kind of blood pressure medication used in the country (Cox et al., 2007). Korea asked about the drinking frequency per day and used nominal variables (Jee et al., 2008). Table 13. The designated important predictors were cholesterol and glucose/DM. All the countries used cholesterol as a continuous variable, and Italy used DM as a nominal variable. Most of the countries used the fasting blood sample cholesterol, HDL triglycerides, and glucose/DM as FPG but for the NIPPON data, the non-fasting blood glucose case was used via the cupric-neocuproine method.
Author* Country Age SBP (mmHg) DBP (mmHg) Smoking Drin king HTN-med. ECG Conroy Europe 45-64 120 140 160 180 - nonsmoker smoker - -
-Simons Australia 60-79 measure - self-report
(yes/no) - -reportself
-Liu China 35-64 measure
rt arm mean value Korotkoff phase 5. mean value current smokers - -
-Menotti Italy classes
years 45-49 50-54 55-59 60-64 65-69 70-74 4 classes <130, 130-149 150-169 170+ - 4 classes cigarettes 0 1-9 10-19 20+ (a day) - - -NIPPON DATA 80 Japan mean age man: 50.3 women :50.8 measure Rt arm 5 categories : 100-119 120–39 140–59 160–79 180–99 - 2 categories: non-curre nt smoker, current smoker - -
-Cox UK 35-74 measure - current
smoker, non-smok er—includi ng former smoker - (yes/no)§ — antihypert ensives, thiazide, β blocker, CCB, ACE inhibitor LVH (yes no)
Jee Korea mean
age man 45 women 49.4 measure - never ex-smoker s current -smoker g/ day SBP≥140 DBP≥90
Author* Country Cholesterol HDL Glucose
/DM FM
BMI
(kg/m2) Exercise
Conroy Europe cholesterol/HDL ratio - - -
-Simons Australia 12-hour fast by
automated enzymatic methods(mmol/L) FPG level 7.0mmol/L self-reported - -
-Liu China enzymatic
method <200mg/dL 5.18mmol/L phosphotun gstic acid /MgCl2 precipitatio n method. <35mg/dL 0.91mmol/L FPG. enzymatic method <140mg/dL 7.8mmol/L - - -Menotti Italy (mg/dl) 5 classes: <180 180-219 220-259 260-299 300+ - 0 =absent; 1 =present - - -NIPPON DATA 80 Japan (mg/dl) sequential auto -analyzer. 6categories: 160–179 180–199 200–219 220–239 240–259 260–279 - neocuproine method § 2 categories: <200 ≥200 (mg/dl) - - -Cox UK ratio of TC to HDL levels - 1st CVD aged <60 (yes no) Height weght -Jee Korea (mg/dL) <200 200–239 ≥240 - FPG ≥6.99mmol/L ≥126mg/dL - Height
weght "regular"asking (yes/no)
Table 13. Characteristics of the predictors in other countries
HDL = high-density lipoprotein; DM = Diabetes Mellitus; FM = Family history; BMI = body mass index; FPG = fasting plasma glucose; TC = total cholesterol
* The first author
§ Non-fasting blood samples were drawn and centrifuged within 60 min of collection, and then stored at -70°C until analyses.
4.3. Characteristics of the predictors in the validation and calibration study
The continuous variables used were the age, BP, total cholesterol, triglycerides, and hs-CRP; and the nominal variables used were the race, smoking habit, DM history, and statin therapy.
Table 14. D’Agostino et al., Muntner et al., and DeFilippis et al. analyzed the correlation of the races with the sample scores. The ARIC, PHS, HHP, PR, SHS, and CHS of the whites, blacks, Native Americans, Japanese American men, and Hispanic men were compared to those in the Framingham Study (D’Agostino et al., 2001). The ACC/AHA-pooled cohort risk and the Framingham Study of the whites and blacks were compared (Muntner et al., 2014). The MESA and the Framingham Study of the white, African American, and Hispanic races were validated (DeFilippis et al., 2015).
Table 15. Aarabi et al. (2005) added score to adjust the total cholesterol by 0.5-3.2 mmol/L, the TC:HDL ratio by 0.5-2.0 mmol/L, and the multiplying TC:HDL by 1.1-2.0 mmol/L. Muntner et al. (2014) associated the self-reported prior diagnosis of diabetes with current use of insulin and oral hypoglycemic medications.
Table 16. Muntner et al. (2014) reviewed the digoxin and statin therapy at the baseline. DeFilippis et al. (2015) combined the hs-CRP level (IQR) in their study.
Author* Analysis
Cohort§ Race Age
BP (mm Hg) Smoking SBP DBP D'Agostino ARIC PHS HHP PR SHS CHS whites, blacks, Native Americans , Japanese American men, Hispanic men 30-74 Optimal (SBP<120, DBP<80) Normal (SBP<130, DBP<85) High normal (SBP<140,DBP<90) Stage I HTN (SBP<160, DBP<100) Stage II-IV HTN (SBP≥160, DBP≥100) Current Hense MONICA Augsburg PROCAM - 35-64 measure - self -report (1/day)
Marrugat Girona - 34-74 Optimal (SBP<120, DBP<80)
Normal (SBP120-129, DBP80-84) Normal high (SBP130-139, DBP85-89) Degree I (SBP140-159, DBP90-99) Degrees II-III (SBP≥160, DBP100) non-smoking, smoking
Aarabi HSE - 35-64 add 10-60
to SBP (Adjustmen) - -Jee KHS - 30-74 Optimal+normal High normal Stage 1 1 Stage 2–4 (yes/no) Muntner ACC/AHA pooled Cohort risk Equations whites blacks 45-79 measure status
DeFilippis MESA white,
african american, hispanic Mean age measure Mean SBP - Never, Former, Current
Table 14. Characteristics of the predictors in the validation and calibration study
BP = blood pressure; SBP = systolic blood pressure; DBP =diastolic blood pressure; HTN = hypertension; ARIC = the Atherosclerosis Risk in Communities Study(1987-1988); PHS = Physicians’ Health Study(1982); HHP = Honolulu Heart Program(1980-1982); PR =Puerto Rico Heart Health Program(1965-1968); SHS = Strong Heart Study(1989-1991); CHS = Cardiovascular Health Study(1989-1990); MONICA = Monitoring Of Trends and determinants In Cardiovascular disease surveys; PROCAM = Prospective Cardiovascular Muenster Study from northwestern Germany; Girona = the Spanish population study; HSE = the Health Survey for England; KHS = the Korean Heart Study ACC/AHA =American College of Cardiology and the American Heart Association; REGARDS = the REasons for Geographic And Racial Differences in Stroke study;; MESA = Multi-Ethnic Study of Atherosclerosis * The first author § compared with the framingham study
Author Analysis Cohort§ Cholesterol Glucose /DM TC HDL LDL TG D'Agostino ARIC PHS HHP PR SHS CHS (mg/dL) <160 160-199 200-239 240-279 ≥280 (mg/dL) <35 35-44 45-49 50-59 ≥60 - - DM Hense MONICA Augsburg PROCAM MONICA Augsburg: Augsburg Hospital using identical methods ROCAM: FPG (after a 12-h) - - MONICA: Non-fasting blood samples were drawn under standardised conditions. PROCAM: FPG questionnaire Marrugat Girona (mg/dL) <160 160-199 200-239 240-279 ≥280 (mg/dL) <35 35-44 45-49 50-59 >59 - - DM
Aarabi HSE add
0.5-3.2 mmol/L to TC (adjust) (adjust) TC: HDL ratio; add 0.5–2.0 Multiplying TC: HDL ratio add 1.1–2.0 - - -Jee KHS - (mg/dL) <35 35–44 45–49 50–59 ≥60 (mg/dL) <130 130-159 ≥160 - DM (yes/no) Muntner REGARDS
measured using the Ortho Vitros Clinical Chemistry System 950IRC instrument Friedewald equation <400 mg/dL glucose ≥126mg/dL (fasting) ≥200mg/dL (nonfasting), self-report (prior
Table 15. Characteristics of the predictors in the validation and calibration study
medications)
DeFilippis MESA Mean level
mmol/L, mg/dL
Mean HDL cholesterol level mmol/L, mg/dL
- mean HbA1c level (proportion of total hemoglobin level) Author* Analysis Cohort§ History HTN -med. BMI Statin therapy hs-CRP D'Agostino ARIC, PHS, HHP, PR, SHS, CHS - - - - -Hense MONICA Augsburg , PROCAM - - - - -Marrugat Ginona - - - - -Aarabi HSE - - - - -Jee KHS - - - - -Muntner ACC/AHA pooled Cohort risk Equations Atrial fibrillation, History of CHD review, Digoxin use - review, statins at baseline
-DeFilippis MESA heart attack
(yes,no) - Mean kg/m2 - (nmol/L) Median hs-CRP level (IQR) TC = total cholesterol; HDL = high-density lipoprotein; LDL = low-density lipoprotein; TG = triglyceride; DM = Diabetes Mellitus; HbA1c = hemoglobin A1c; FPG = fasting plasma glucose; ARIC = the Atherosclerosis Risk in Communities Study(1987-1988); PHS = Physicians’ Health Study(1982); HHP = Honolulu Heart Program(1980-1982); PR =Puerto Rico Heart Health Program(1965-1968); SHS = Strong Heart Study(1989-1991); CHS = Cardiovascular Health Study(1989-1990); MONICA = Monitoring Of Trends and determinants In Cardiovascular disease surveys; PROCAM = Prospective Cardiovascular Muenster Study from northwestern Germany; Girona = the Spanish population study; HSE = the Health Survey for England; ACC/AHA =American College of Cardiology and the American Heart Association; REGARDS = the REasons for Geographic And Racial Differences in Stroke study; MESA = MESA Multi-Ethnic Study of Atherosclerosis * The first author § compared with the framingham study
Table 16. Characteristics of the predictors in the validation and calibration study
HTN-med.= hypertension medication status; BMI = body mass index; hs-CRP = high-sensitivity C-reactive protein; ARIC = the Atherosclerosis Risk in Communities Study(1987-1988); PHS = Physicians’ Health Study(1982); HHP = Honolulu Heart Program(1980-1982); PR =Puerto Rico Heart Health Program(1965-1968); SHS = Strong Heart Study(1989-1991); CHS = Cardiovascular Health Study(1989-1990); MONICA = Monitoring Of Trends and determinants In Cardiovascular disease surveys; PROCAM = Prospective Cardiovascular Muenster Study from northwestern Germany; Girona = the Spanish population study; HSE = the Health Survey for England; ACC/AHA =American College of Cardiology and the American Heart Association; REGARDS = the REasons for Geographic And Racial Differences in Stroke study; MESA = MESA Multi-Ethnic Study of Atherosclerosis; CHD= coronary heart disease * The first author
Ⅳ. DISCUSSION
This study is a historical review of the prediction model for ASCVD. Many researchers have used, developed, and provided to many people the Framingham Study in the USA. Framingham functions have overestimated the CHD risk in some populations, which has raised the concern that it may be inappropriate for other populations (Hense et al., 2003). The 10-year CHD event rates were 1.5% for men and 0.6% for women in the CMCS, without adjusting for the age. The corresponding crude incidence rates in Framingham men and women were 8.0% and 2.8%, respectively (Liu et al., 2004). The proportion of cells in which the 10-year probability of developing a CHD event was > 9% was 2.3 times higher, and that of cells with a probability >19% was 13 times lower, in the chart calibrated for Spain than in the original Framingham charts (Marrugat et al., 2003). The 10-year ASCVD risk for men in the KHS cohort was overestimated by 56.5% (White model) and 74.1% (AA model), whereas the risk for women was underestimated by 27.9% (White model) and overestimated by 29.1% (AA model) (Jung et al., 2015). Each country added was set up to reflect the characteristics of the prediction model. Further research is needed to enhance the prediction capability of individual models from the Framingham scores though the validation and calibration.
that for each individual, values of one or more explanatory variables were available. Therefore, the statistical analysis showed a trend from logistic regression to the Cox proportional hazards model in the USA, other countries, and the validation and calibration study.
The definition of the outcomes was expanded from CHD and not CHD to hard CHD or CVD in the USA. In the study in other countries, the outcomes were defined as ICD codes, and the incidence of CVD or death probabilities, hard CHD or CVD. In the validation and calibration study, the definition of the outcomes was expanded to ASCVD.
The general risk factors of the prediction model combined the narrowing factor, cholesterol, to expanding variables such as the DM, smoking habit, family history, HTN medication, statin therapy, and exercise.
The ages were stratified into young age, middle age, and old age. However, the study was conducted among the young people, because the incidence of CVD is increasing among them. The races differed among the multiple ethnic groups, so a genetic risk score had to be included. In the BP, glucose, and cholesterol level, the same baseline method had to be set.
The family history was a strong factor of the atrial fibrillation, history of CHD (Muntner et al., 2014), and heart attack (DeFilippis et al., 2015). The HTN medication was a good type of digoxin (Muntner et al., 2014) and antihypertensives, thiazide, β blocker, CCB, and ACE inhibitor (Cox et al., 2007). DM had to have a common baseline score in the continuous variables, and the last diagnosis of diabetes was correlated with the current use of insulin and oral hypoglycemic medications among the nominal variables, as surfaced by the questionnaire. In the statin therapy,
an absolute baseline had to be set up worldwide. Exercise should be included in the regimen for the prevention of ASCVD.
Estimation of the absolute cerebrovascular disease risk, which is required for its common treatment and prevention, relies on prediction models developed from the experience of prospective cohort studies (D’Agostino et al., 2001).
To prevent ASCVD, efforts should be made to develop an accurate prediction model.
Those with a healthy lifestyle had an 80% lower risk of a first stroke than those who did not (Chiuve et al., 2008). Therefore, we should consider our lifestyle, such as how much time we go for a walk, how much junk food we eat, and by how much we relieve our stress or stress level.
This literature review had some limitations, as follows.
First, we focused on the general characteristics of the model, the outcome, and the risk factors without the results of the literature review. Second, in the assessment of the model performance, we were introduced to the characteristics by evaluating the model using the same data as those in the validation and calibration study. Third, we did not consider up-to-date risk factors such as novel biomarkers, the genetic risk score, and single-nucleotide polymorphisms (SNPs).
V. CONCLUSION
In this report, we reviewed literature on the history of ASCVD prediction models.
In summary, the Framingham Study was applied to the risk functions obtained through the literature review. The Framingham algorithm over-predicted the risk of ASCVD through validation and calibration in a modern multi-ethnic cohort. A shift in risk estimation provided more contemporary approaches to estimating the risk of ASCVD and to discriminating better those at high risk such as based on their age, race, sex, antihypertensive treatment, statin use, exercise, and family history of social deprivation. This study may support the need for baseline information in ASCVD prediction models.
REFERENCE
National Statistical Office. The cause of death statistics. Korean statistical information service(KOSIS), http://Kosis.nso.go.kr/,2013
Avoiding heart Attacks and Strokes. 2005. World Health Organization (accessed 2007 January 16) Available from:URL:
http://www.who.int/cardiovascular_diseases/resources/cvd_report.pdf.
Aarabi M, Jackson PR. Predicting coronary risk in UK South Asians: an adjustment method for Framingham-based tools. Eur J Cardiovasc Prev Rehabil 2005;12:46-51.
Ahn KA, Yun JI, Cho ER, Nam CM, Jang YS, Jee SH. Framingham equation model overestimates risk of ischemic heart disease in korean men and women. Kor epi J 2006;28:162-70.
Anderson KM, Odell PM, Wilson PW, Kannel WB. Cardiovascular disease risk profiles. Am J Heart 1991;121:293-8.
Anderson KM, Keaven M. A nonproportional hazards Weibull accelerated failure time regression model. Biometrics 1991:281-8.
Confield J. Joint dependence of risk of coronary heart disease on serum cholesterol and systolic blood pressure a discriminant function analysis. In Fed Proc 1962;21:58-61.
Conroy RM , Pyörälä K, Fitzgerald AP, Sans S, Menotti A, Backer GD, Bacquer DD, Ducimetière P, Jousilahti P, Keil U, Njølstad I, Oganov RG, Thomsen T, Tunstall-Pedoe H, Tverdal A, Wedel H, Whincup P, Wilhelmsen L, Graham IM. Estimation of ten-year risk of fatal cardiovascular disease in Europe: The SCORE project European J Heart 2003;24:987–1003.
Cox DR. Regression models and life tables. J R Stat Soc B 1972;34:187– 220.
Cox JH, Vinogradova Y, Robson J, May M, Brindle P, Derivation and validation of QRISK, a new cardiovascular disease risk score for the United Kingdom: prospective open cohort study. BMJ 2007;335(7611):136.
Chiuve SE, Rexrode KM, Spiegelman D, Logroscino G, Manson JE, Rimm EB. Primary prevention of stroke by healthy lifestyle. Circulation 2008;118:947-54.
D'Agostino RB, Grundy S, Sullivan LM, Wilson P. Validation of the framingham coronary heart disease prediction scores. results of a multiple ethnic groups investigation. JAMA 2001;286:180-7.
D'Agostino RB, Vasan RS, Pencina MJ, Wolf PA, Cobain M, Massaro JM, Kannel WB. General cardiovascular risk profile for use in primary care. the framingham heart study. Circulation 2008;117:743-53.
DeFilippis AP, Young R, Carrubba CJ, McEvoy JW, Budoff MJ, Blumenthal RS, Blaha MJ. An analysis of calibration and discrimination among multiple cardiovascular risk scores in a modern multiethnic cohort. Ann Intern Med 2015;162(4):266-75.
Friedewald WT, Levy RI, Fredrickson DS. Estimation of the concentration of low-density lipoprotein cholesterol in plasma, without the use of the preparative ultracentrifuge. Clin Chem 1972;18:499-502.
Goff DC, Lloyd-Jones DM, Bennett G, D’Agostino RB, Gibbons R, Greenland P, Lackland DT, Levy D, O’Donnell CJ, Robinson JG, Schwartz JS, Shero ST, Smith SC, Sorlie P, Stone NJ, Wilson PW. 2013 ACC/AHA guideline on the assessment of cardiovascular risk. J Am Coll Cardiol 2013.
receiver operating characteristic curves derived from the same cases. Radiology 1983;148:839-43.
Harrell FE, Lee KL, Mark DB. Multivariable prognostic models: issues in developing models, evaluating assumptions and adequacy, and measuring and reducing errors. Stat Med 1996;15(4):361–87.
Hense HW, Schulteb H, Löwelc H, Assmannb G, Keila U. Framingham risk function overestimates risk of coronary heart disease in men and women from Germany—results from the MONICA Augsburg and the PROCAM cohorts. European Heart J 2003;24:937–45.
Jackson R. Guidelines on preventing cardiovascular disease in clinical practice. BMJ 2000;320:659–61.
Jackson R, Lawes CM, Bennett DA, Milne RJ, Rodgers A. Treatment with drugs to lower blood pressure and blood cholesterol based on an individual’s absolute cardiovascular risk. Lancet 2005;365:434-41.
Jeanne T, Cornfield J, Kannel W. A multivariate analysis of the risk of coronary heart disease in Framingham. Chron J Dis 1967;20:511-24. Jee SH, Park JW, Lee SY, Nam BH, Ryu HG, Kim SY, Yun JE. Stroke
Atherosclerosis 2008;197(1):318-25.
Jee SH, Jang YS, Oh DJ, Oh BH, Lee SH, Park SW, Seung KB, Mok YJ, Jung KJ, Kimm HJ, Yun YD, Baek SJ, Lee DC, Choi SH, Kim MJ, Sung JD, Cho BL, Kim ES, Yu BY, Lee TY, Kim JS, Lee YJ, Oh JK, Kim SH, Park JK, Koh SB, Park SB, Lee SY, Yoo CI, Kim MC, Kim HK, Park JS, Kim HC, Lee GJ, Woodward M. A coronary heart disease prediction model: the Korean Heart Study. BMJ open 2014;4(5):e005025.
Jee SH, Batty GD, Jang YS, Oh DJ, Oh BH, Lee SH, Park SW, Seung KB, Kimm HJ, Kim SY, Mok YJ, Kim HS, Lee DC, Choi SH, Kim MJ, Lee GJ, Sung JD, Cho BL, Kim ES, Yu BY, Lee TY, Kim JS, Lee YJ, Oh JK, Kim SH, Park JK, Koh SB, Park SB, Lee SY, Yoo CI, Kim MC, Kim HK, Park JS, Yun YD, Baek SJ, Samet JM, Woodward M. The Korean Heart Study rationale, objectives, protocol, and preliminary results for a new prospective cohort study of 430,920 men and women. Eur Pre Cadio J 2014;21:1484–92.
Jung KJ, Jang Y, Oh DJ, Oh BH, Lee SH, Park SW, Yun YD, Choi SH, Sung JD, Lee TY, Kim SH, Koh SB, Kim MC, Kim HC, Kimm HJ, Nam CM, Park SH, Jee SH. The ACC/AHA 2013 pooled cohort
367-75.
Kavousi M, Leening MJ, Nanchen D, Greenland P, Graham IM, Steyerberg EW, et al,. Comparison of application of ACC/AHA guidelines, Adult Treatment Panel Ⅲ guidelines, and European Society of Cardiology guidelines for cadiovascular disease prevention in European cohort. JAMA 2014;311:1416-23.
Kannel WB, McGee D, Gordon T. A general cardiovascular risk profile the Framingham study. Am J Cardio 1976;38:46-51.
Kannel WB, D’Agostino RB, Silbershatz H, Belanger AJ, Wilson PW, Levy D. Profile for estimating risk of heart failure. Arch Intern Med 1999;159:1197–1204.
Liu J, Hong Y, D’Agostino RB, Wu Z, Wang W, Sun J, Wilson PW, Kannel WB, Zhao D. Predictive value for the Chinese population of the Framingham CHD risk assessment tool compared with the Chinese Multi-Provincial Cohort Study. JAMA 2004;291(21):2591-99. Marrugat J, Solanas P, D'Agostino R, Sullivan L, Ordovas J, Cordon F,
Ramos R, Sala J, Masia R, Rohlfs I, Elosua R, Kannel WB. Coronary risk estimation in Spain using a calibrated Framingham function. Rev Esp Cardio 2003;58(3):253-61.
Menotti A, Lanti M, Agabiti-Rosei E, Carratelli L, Cavera G, Dormi A, Gaddi A, Mancini M, Motolese M, Muiesan ML, Muntoni S, Muntoni S, Notarbartolo A, Prati P, Remiddi S, Zanchetti A. Riskard 2005. New tools for prediction of cardiovascular disease risk derived from Italian population studies. Nutrition, Metabolism & Cardiovascular Diseases 2005;15:426-40.
Miller ME, Hui SL, Tierney WM. Validation techniques for logistic regression models. Stat Med 1991;10:1213–26.
Muntner P, Colantonio LD, Cushman M, Goff DC, Howard G, Howard VJ, Kissela B, & Levitan EB, Lloyd-Jones DM, Safford MM. Validation of the atherosclerotic cardiovascular disease Pooled Cohort risk equations. JAMA 2014;311(14):1406-15.
Murabito JM, D’Agostino RB, Silbershatz H, Wilson WF. Intermittent claudication: a risk profile from the Framingham Heart Study. Circulation1997;96:44–49.
Neter J, Wasserman W. Multiple regression. In: Applied Linear Statistical Models. Homewood, Ill: Irwin 1974;214-72.
German National Health interview and examination survey 1998. Eur J Cardiovasc Prev Rehabil 2005;12:442-50.
NIPPON DATA80 Research Group. Risk Assessment Chart for Death From Cardiovascular Disease Based on a 19-Year Follow-up Study of a Japanese Representative Population. NIPPON DATA80. Circ J 2006;70:1249–55.
Pencina MJ, D’Agostino RB, Larson MG, Massaro JM, Vasan SV. Predicting the 30-Year Risk of Cardiovascular Disease. The Framingham Heart Study. Circulation 2009;119:3078-84.
Pöyrälä K, Backer GD, Graham I, Poole-Wilson P, Wood D. Prevention of coronary heart disease in clinical practice. Recommendations of the Task Force of the European Society of Cardiology European Atherosclerosis Society and European Society of Hypertension. Eur J Heart 1994;15:1300-31.
Simons LA, Simons J, Friedlander Y, McCallum J, Palaniappan L. Risk functions for prediction of cardiovascular disease in elderly Australians. The Dubbo Study. MJA 2003;178:113-6.
Stone NJ, Robinson JG, Lichtenstein AH, Goff DC, Lloyd-Jones DM, Smith SC, Blum C, Schwartz JS. Stone NJ, Robinson JG, Lichtenstein AH,
Goff DC, Lloyd-Jones DM, Smith SC, Blum C, Schwartz JS. 2013 ACC/AHA guideline on the treatment of blood cholesterol to reduce atherosclerotic cardiovascular risk in adults: a report of the American College of Cardiology/American Heart Association Task Force on Practice Guidelines. J Am Coll Cardiol 2013.
Wilson PW, D’Agostino RB, Levy D, Belanger AM, Silbershatz H, Kannel WB. Prediction of coronary heart disease using risk factor categories. Circulation 1998;97:1837-47.
Wolf PA, D’Agostino RB, Belanger AJ, Kannel WB. Probability of stroke: a risk profile from the Framingham study. Stroke 1991;22:312-8.
Walker SH, Duncan DB: Estimation of the probability of an event as a function of several independent variables. Biometrika 1967;54:167-79.
ABSTRACT(IN KOREAN)
심뇌혈관 질환 예측모형 발전사의 문헌적 고찰
<지도 교수 지선하> 연세대학교 보건대학원 역학건강증진 박현희 배경: 심뇌혈관 질환은 세계적으로 주요 사망원인이다. 프레밍험 연구는 지역 과 인종간의 차이로 과다 측정되어 세계 모든 인구에 적용하는 것은 주의가 요구된다. 그리하여 각 나라에서는 심뇌혈관 질환을 예방하고자 정교한 모형 을 개발하기 위해 노력하고 있다. 목적: 예측모형의 역사를 체계적인 문헌고찰을 통해 일반적 특성, 일반적인 특성의 모형과 결과, 고 위험 요인, 예측 요인들로 분석하였다.방법: 펌메드 PubMed와 구글 스콜라 Google Scholar에서 문헌 고찰하였다. 결과: 통계 분석은 미국, 나라별, 비교 및 측정 논문 모두 로지스틱 모형에서 콕스 모형으로 변화하였다. 결과 정의에서 미국 모형은 심장질환과 비심장질 환에서 강력한 심장질환 또는 뇌혈관질환으로 확장되었다. 나라별 모형에서는 국제 질환 분류 코드, 뇌혈관 질환 발생률, 사망률, 강력한 심혈관 질환 또는 뇌혈관질환으로 정의하였다. 비교 및 측정 논문에서는 죽상경화성 심장질환으 로 확대 되었다. 예측모형의 일반적 고위험 요인은 콜레스테롤의 좁은 의미에서 당뇨병, 흡연, 가족력, 고혈압약 복용, 고지혈증치료제, 운동의 다양한 요인으로 확장되었다.
핵심되는 말: 심뇌혈관 질환, 연구, 일반적 특성, 위험 요인, 예측요인
결론: 본 연구는 심뇌혈관 질환의 예측 모형의 기준을 위해 중요한 정보를 제 공하기 위함이다.