저작자표시-비영리-변경금지 2.0 대한민국 이용자는 아래의 조건을 따르는 경우에 한하여 자유롭게 l 이 저작물을 복제, 배포, 전송, 전시, 공연 및 방송할 수 있습니다. 다음과 같은 조건을 따라야 합니다: l 귀하는, 이 저작물의 재이용이나 배포의 경우, 이 저작물에 적용된 이용허락조건 을 명확하게 나타내어야 합니다. l 저작권자로부터 별도의 허가를 받으면 이러한 조건들은 적용되지 않습니다. 저작권법에 따른 이용자의 권리는 위의 내용에 의하여 영향을 받지 않습니다. 이것은 이용허락규약(Legal Code)을 이해하기 쉽게 요약한 것입니다. Disclaimer 저작자표시. 귀하는 원저작자를 표시하여야 합니다. 비영리. 귀하는 이 저작물을 영리 목적으로 이용할 수 없습니다. 변경금지. 귀하는 이 저작물을 개작, 변형 또는 가공할 수 없습니다.
Measures of muscle mass and fat mass in the identification of
metabolic abnormalities in older Korean adults
Measures of muscle mass and fat mass in the identification of
metabolic abnormalities in older Korean adults
A Master’s Thesis
Submitted to the Department of Public Health
and the Graduate School of Yonsei University
in partial fulfillment of the
requirements for the degree of
Master of Public Health
Ji Hye Park
TABLE OF CONTENTS
LIST OF TABLES ...III
LIST OF FIGURES... IV ABSTRACT...V I. INTRODUCTION...1 1. Background...1 2. Objective...3 II. METHODS ...4 1. Study population ...4 2. Measurements ...6 1) Questionnaire ...6 2) Physical Examination ...6 3) Laboratory Assays...7
3. Definition of metabolic abnormalities...8
III. RESULTS...10
1. Characteristics of study populations ...10 2. Description of study populations by tertiles of muscle mass and body fat ...12 3. Correlations between muscle mass and fat mass with metabolic variables
...15 4. Correlations between muscle mass and fat mass ...18 5. Association between muscle mass and fat mass and metabolic
abnormalities...20 6. The areas under the curves of muscle mass and fat mass in the prediction
of metabolic abnormalities ...26
LIST OF TABLES
Table 1. Characteristics of study populations ... 11
Table 2. Description of men and women by tertiles of muscle mass ... 13
Table 3. Description of men and women by tertiles of body fat ... 14 Table 4. Correlation analysis between muscle mass and fat mass with metabolic variables in men ... 16
Table 5. Correlation between muscle mass and fat mass with metabolic variables in women ... 17 Table 6. Logistic regression models of ASM and body fat mass for metabolic abnormality in men ... 22
Table 7. Logistic regression models of ASM/Ht² and Body fat/Ht² for metabolic
abnormality in men ... 23
Table 8. Logistic regression models of ASM and body fat mass for metabolic abnormality in women ... 24
Table 9. Logistic regression models of ASM/Ht² and Body fat/Ht² for metabolic
abnormality in women ... 25
Table 10. Comparison of areas under ROC curve for different muscle mass and fat mass by metabolic abnormalities in men... 27
Table 11. Comparison of areas under ROC curve for different muscle mass and fat mass by metabolic abnormalities in women ... 27
LIST OF FIGURES
Figure 1. Flowchart of the selection criteria of the final study population ...5 Figure 2. The relationship between muscle mass and fat mass in men and women ...19 Figure 3. Receiver operating characteristic curve of muscle mass and fat mass and metabolic abnormalities in men ...28 Figure 4. Receiver operating characteristic curve of muscle mass and fat mass and metabolic abnormalities in women ...29
ABSTRACT
Measures of muscle mass and fat mass in the
identification of metabolic abnormalities in older Korean
adults
Ji Hye Park
Department of Public Health The graduate School of Yonsei University
(Directed by Professor Hyeon Chang Kim)
OBJECTIVES:
We investigated the association of the sex-associated changes of muscle mass and fat mass with metabolic abnormalities in an older Korean population.
METHODS:
We conducted a cross-sectional analysis of the baseline data from the cohort study conducted in the Korean Urban Rural Elderly (KURE) study, which is a population-based longitudinal study of health determinants among elderly persons aged 65 years or older (381 men, 747 women). Metabolic syndrome was defined according to the National Cholesterol Education Program’s ATP-III criteria (≥3 of the following abnormalities): waist circumference greater than 90 cm in men and 80 cm in women; serum triglycerides level of at least 150 mg/dL; high-density lipoprotein (HDL) cholesterol level of less than 40 mg/dL in men and 50 mg/dL in women; blood pressure of at least 130/85 mmHg; or serum glucose level of at least 100 mg/dL. The association between muscle and fat mass and metabolic syndrome was assessed by serial logistic regression models.
2.42) for women and low HDL cholesterol (ASM/Ht2; OR= 1.88, 95% CI =
1.01-3.49) for men.
CONCLUSIONS:
In older persons, fat mass was associated with all of the metabolic syndrome components. In contrast, muscle mass was associated with all of the metabolic syndrome components in women, but not in men. More studies are needed to explain the sex difference of the associations.
Measures of muscle mass and fat mass in the
identification of metabolic abnormalities in older Korean
adults
Ji Hye Park
Department of Public Health The graduate School of Yonsei University
(Directed by Professor Hyeon Chang Kim)
Education Program (NCEP) Expert Panel on Detection, Evaluation, and Treatment of High Blood Cholesterol in Adults (Adult Treatment Panel III) final report" 2002). Metabolic syndrome is associated with cardiovascular disease which is the leading cause of mortality and morbidity . In Korea, the prevalence of metabolic syndrome, according to the National Cholesterol Education Program (NCEP)–Adult Treatment Panel (ATP) III, was 25.7 % in men and 31.9 % in women (Yoon et al. 2007) and the prevalence of metabolic syndrome were steadily increasing in elderly people (Ford, Giles and Dietz 2002; Park et al. 2007).
In addition, previous studies have suggested that the effects of metabolic syndrome may depend on age (Roriz-Cruz et al. 2007). Insulin resistance, one of the components of metabolic syndrome, has been considered as a contributing factor to age-related muscle mass loss, which is causally related to decline in functional ability. Moreover, older individuals tend to have a greater proportion of fat than younger people with the same BMI. Both cross-sectional and longitudinal studies have shown that age-related body composition changes, such as fat mass increase and muscle mass decrease (Baumgartner et al. 1995; Forbes 1999). The abdominal obesity including fat mass was well known to be strongly associated with metabolic syndrome (Bosy-Westphal et al. 2006b) and lower muscle mass, termed sarcopenia, was also associated with metabolic syndrome (Ishii et al. 2014).
2. Objective
There is no unanimous view about the standard criteria of sarcopenia to apply to define low muscle mass, since classification of sarcopenia differs by ethnic groups and equipment for measuring the muscle mass (Alexandre Tda et al. 2014). Therefore, we assessed the association between absolute muscle mass and metabolic syndrome components without classifying sarcopenia among older Korean adults. We also investigated the association of the sex-associated changes of muscle mass and fat mass with metabolic abnormalities.
II. METHODS
1. Study population
The study is conducted using baseline data collected from Korean elderly participating in the Korean Urban Rural Elderly (KURE) study (Lee et al. 2014). The KURE study is a community-based prospective cohort study on health, aging, and common geriatric disorders of Korean elderly persons aged at least 65 years. To construct a cohort reflecting both urban and rural areas, we selected two representative communities in the country.
Between July and December 2014, a bioelectrical impedance ancillary study was performed for 1285 permanent residents. After excluding 175 participants with past history of cancer or stroke, 1128 participants were eligible for the current cross-sectional analysis (Figure 1). Among them, 760 participants were measured for anthropometric parameters and examined for fasting blood test in 2014, and 368 participants were measured for anthropometric parameters in 2014 and examined for fasting blood test in 2012. All participants provided written informed consents, and the study protocol was approved by the Institutional Review Board of Severance Hospital, Yonsei University College of Medicine.
Figure1. Flowchart of the selection criteria for the final study population
1285 patients analyzed
Participated n = 1128 381 men and 747 women
157 patients excluded (Stroke, cancer)
2. Measurements
1) Questionnaire
Participants were individually interviewed using standardized questionnaires to obtain information about their general characteristics, medical history, medication use, and lifestyle behaviors. Trained interviewers carried out the questionnaire surveys according to the predefined protocol, and double-checked whether responses were inappropriate or missing. Smoking status was classified as current smokers or nonsmokers (past smokers or those who had never smoked). Alcohol consumption was categorized as regular alcohol drinking or other (participants who drink less than once a week or not at all). Physical activity was categorized as regular exercise or no exercise.
2) Physical Examination
We measured height and weight with subjects in light clothing and calculated body mass index (BMI) as weight in kilograms divided by the square of height in meters (kg/m2). Waist circumference was measured between the lower borders of
the rib cage and the iliac crest with a measuring tape (SECA-201; SECA, Hamburg, Germany). Resting blood pressure was measured twice by an automatic sphygmomanometer (Dinamap 1846 SX/P; GE Healthcare, Waukesha, WI, USA)
with the participant in the sitting position at least 5 minute intervals. If the difference between the first and second measurement was more than 10 mmHg for either systolic or diastolic blood pressure, a third measurement was performed, and the last two measurements were averaged for analyses. Muscle mass and fat mass were measured by bioelectrical impedance analysis (BIA) using an Inbody 720 machine (Biospace, Seoul, Korea). Appendicular skeletal muscle mass (ASM) was derived as the sum of the muscle mass of the four limbs (Cruz-Jentoft et al. 2010). We used ASM divided by weight (ASM/Wt) and by height squared (ASM/Ht2) as muscle mass indices; fat mass divided by weight (Body fat/Wt) and
by height squared (Body fat/Ht2) as fat mass indices. The results of our study did
not differ significantly when divided by weight and by height squared. Therefore, only ASM/Ht2 and Body fat/Ht2 indices were used in the analysis. Grip strength
was measured with a hand dynamometer with participants seated, their elbow by their side and flexed to right angles, and a neutral wrist position. The
cholesterol, and triglycerides and fasting blood glucose level were measured by colorimetry method with Auto Analyzer (ADVIA 1800; Siemens Healthcare Diagnostics Inc., Deerfield, IL, USA). Low-density lipoprotein cholesterol was calculated using the Friedewald’ method (Friedewald, Levy and Fredrickson 1972).
3. Definition of metabolic abnormalities
Metabolic syndrome was defined based on the National Cholesterol Education Program Adult Treatment Panel III (NCEP-ATP III) criteria (Alberti et al. 2009). The presence of any three of the following five abnormalities constitutes a diagnosis of metabolic syndrome: (i) waist circumference >90 cm in men and >80 cm in women; (ii) elevated triglycerides with fasting plasma triglycerides ≥150 mg/dL; (iii) low HDL cholesterol with fasting HDL cholesterol <40 mg/dL in men and <50 mg/dL in women; (iv) elevated blood pressure with systolic blood pressure ≥130 mmHg and/or diastolic blood pressure ≥85 mmHg; (v) elevated fasting plasma glucose with fasting plasma glucose ≥100 mg/dL.
4. Statistical Analysis
Differences in subject characteristics between men and women were examined using Student’s t-test, ANOVA or Wilcoxon rank-sum test (for continuous variables) and chi-square test (for categorical variables). The correlation between muscle mass and fat mass and other variables were evaluated by the Pearson’s correlation coefficient controlling for age, smoking status, physical activity, and alcohol intake. Also, the Spearman’s correlation coefficients were used for skewed variables. We employed logistic regression analysis to evaluate the association between muscles mass and fat mass. Multiple logistic regression analysis was used to assess the odds ratio for the individual metabolic abnormalities per one unit increase in the muscle mass and fat mass. We applied the following serial models: age-adjusted (model 1); age, potential confounders such as smoking, drinking and physical activity-adjusted (model 2). In the final model, age,
III. RESULTS
1. Characteristics of study populations
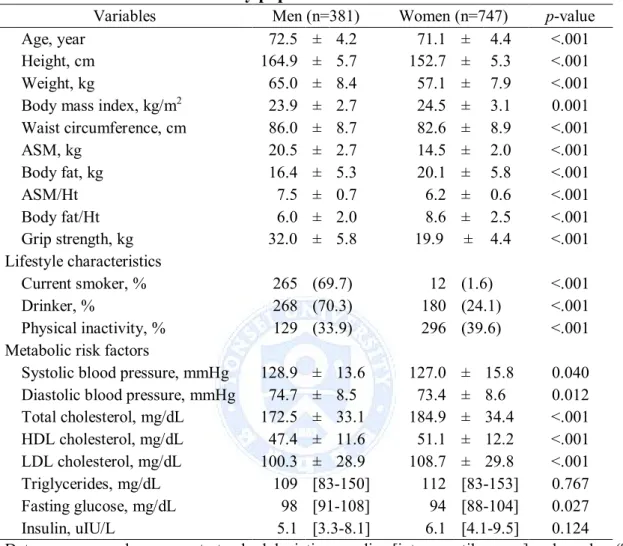
General characteristics for men and women participants are shown in Table 1. The variables were significantly different between men and women, with the exception of triglycerides and insulin. Men had higher muscle mass, blood pressure and fasting glucose, tended to smoke more, and drank more alcohol than women. Women had higher fat mass, total cholesterol, HDL cholesterol and LDL cholesterol, and more physical activity than men/higher physical activity level than men.
Table 1. Characteristics of study populations
Variables Men (n=381) Women (n=747) p-value
Age, year 72.5 ± 4.2 71.1 ± 4.4 <.001
Height, cm 164.9 ± 5.7 152.7 ± 5.3 <.001 Weight, kg 65.0 ± 8.4 57.1 ± 7.9 <.001 Body mass index, kg/m2 23.9 ± 2.7 24.5 ± 3.1 0.001 Waist circumference, cm 86.0 ± 8.7 82.6 ± 8.9 <.001 ASM, kg 20.5 ± 2.7 14.5 ± 2.0 <.001 Body fat, kg 16.4 ± 5.3 20.1 ± 5.8 <.001 ASM/Ht² 7.5 ± 0.7 6.2 ± 0.6 <.001 Body fat/Ht² 6.0 ± 2.0 8.6 ± 2.5 <.001 Grip strength, kg 32.0 ± 5.8 19.9 ± 4.4 <.001 Lifestyle characteristics Current smoker, % 265 (69.7) 12 (1.6) <.001 Drinker, % 268 (70.3) 180 (24.1) <.001 Physical inactivity, % 129 (33.9) 296 (39.6) <.001 Metabolic risk factors
Systolic blood pressure, mmHg 128.9 ± 13.6 127.0 ± 15.8 0.040 Diastolic blood pressure, mmHg 74.7 ± 8.5 73.4 ± 8.6 0.012 Total cholesterol, mg/dL 172.5 ± 33.1 184.9 ± 34.4 <.001 HDL cholesterol, mg/dL 47.4 ± 11.6 51.1 ± 12.2 <.001 LDL cholesterol, mg/dL 100.3 ± 28.9 108.7 ± 29.8 <.001 Triglycerides, mg/dL 109 [83-150] 112 [83-153] 0.767 Fasting glucose, mg/dL 98 [91-108] 94 [88-104] 0.027 Insulin, uIU/L 5.1 [3.3-8.1] 6.1 [4.1-9.5] 0.124
2. Description of study populations by tertiles of muscle mass and body fat
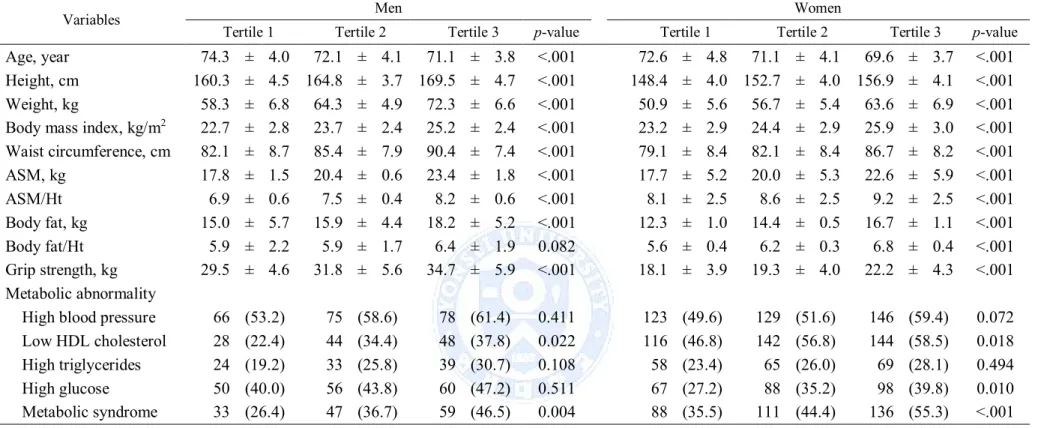
Description of men and women by tertile of ASM and body fat are shown in Table 2 and 3. Men and women in the lowest tertile of ASM were older and shorter, had a lower weight, BMI, waist circumference and body fat, and had a lower grip strength compared with those in the highest tertile (Table 2). Among the highest tertile of ASM, low HDL cholesterol, high glucose and metabolic syndrome were significantly more prevalent in women (p = 0.02, p = 0.01, and p <.001, respectively), while metabolic syndrome was significantly more prevalent in men (p = 0.004). Men and women in the highest tertile of body fat had a higher weight, BMI and waist circumference compared with those in the lowest tertile. Among the highest tertile of body fat, metabolic syndrome and its components were significantly more prevalent in both sexes (Table 3).
Table 2. Description of men and women by tertiles of muscle mass
Variables Men Women
Tertile 1 Tertile 2 Tertile 3 p-value Tertile 1 Tertile 2 Tertile 3 p-value
Age, year 74.3 ± 4.0 72.1 ± 4.1 71.1 ± 3.8 <.001 72.6 ± 4.8 71.1 ± 4.1 69.6 ± 3.7 <.001 Height, cm 160.3 ± 4.5 164.8 ± 3.7 169.5 ± 4.7 <.001 148.4 ± 4.0 152.7 ± 4.0 156.9 ± 4.1 <.001 Weight, kg 58.3 ± 6.8 64.3 ± 4.9 72.3 ± 6.6 <.001 50.9 ± 5.6 56.7 ± 5.4 63.6 ± 6.9 <.001 Body mass index, kg/m2 22.7 ± 2.8 23.7 ± 2.4 25.2 ± 2.4 <.001 23.2 ± 2.9 24.4 ± 2.9 25.9 ± 3.0 <.001 Waist circumference, cm 82.1 ± 8.7 85.4 ± 7.9 90.4 ± 7.4 <.001 79.1 ± 8.4 82.1 ± 8.4 86.7 ± 8.2 <.001 ASM, kg 17.8 ± 1.5 20.4 ± 0.6 23.4 ± 1.8 <.001 17.7 ± 5.2 20.0 ± 5.3 22.6 ± 5.9 <.001 ASM/Ht² 6.9 ± 0.6 7.5 ± 0.4 8.2 ± 0.6 <.001 8.1 ± 2.5 8.6 ± 2.5 9.2 ± 2.5 <.001 Body fat, kg 15.0 ± 5.7 15.9 ± 4.4 18.2 ± 5.2 <.001 12.3 ± 1.0 14.4 ± 0.5 16.7 ± 1.1 <.001 Body fat/Ht² 5.9 ± 2.2 5.9 ± 1.7 6.4 ± 1.9 0.082 5.6 ± 0.4 6.2 ± 0.3 6.8 ± 0.4 <.001 Grip strength, kg 29.5 ± 4.6 31.8 ± 5.6 34.7 ± 5.9 <.001 18.1 ± 3.9 19.3 ± 4.0 22.2 ± 4.3 <.001 Metabolic abnormality
High blood pressure 66 (53.2) 75 (58.6) 78 (61.4) 0.411 123 (49.6) 129 (51.6) 146 (59.4) 0.072 Low HDL cholesterol 28 (22.4) 44 (34.4) 48 (37.8) 0.022 116 (46.8) 142 (56.8) 144 (58.5) 0.018 High triglycerides 24 (19.2) 33 (25.8) 39 (30.7) 0.108 58 (23.4) 65 (26.0) 69 (28.1) 0.494
Table 3. Description of men and women by tertiles of body fat
Variables Men Women
Tertile 1 Tertile 2 Tertile 3 p-value Tertile 1 Tertile 2 Tertile 3 p-value Age, year 72.7 ± 4.4 72.4 ± 3.8 72.4 ± 4.3 0.742 71.0 ± 4.2 71.3 ± 4.9 71.0 ± 4.0 0.549 Height, cm 164.9 ± 5.5 164.4 ± 6.0 165.4 ± 5.7 0.365 152.1 ± 5.3 152.6 ± 5.1 153.3 ± 5.6 0.062 Weight, kg 57.6 ± 6.1 64.9 ± 5.0 72.2 ± 6.5 <.001 49.6 ± 4.5 56.7 ± 4.2 64.7 ± 6.0 <.001 Body mass index, kg/ m2 21.2 ± 2.0 24.0 ± 1.4 26.4 ± 1.7 <.001 21.4 ± 1.8 24.4 ± 1.5 27.6 ± 2.2 <.001 Waist circumference, cm 78.1 ± 7.7 86.2 ± 4.8 93.3 ± 5.3 <.001 74.6 ± 6.3 83.1 ± 5.2 90.0 ± 7.1 <.001 Body fat, kg 10.7 ± 2.2 16.0 ± 1.3 22.2 ± 3.0 <.001 14.0 ± 2.7 19.8 ± 1.4 26.4 ± 3.7 <.001 Body fat/Ht² 3.9 ± 0.9 5.9 ± 0.6 8.1 ± 1.2 <.001 6.1 ± 1.3 8.5 ± 0.8 11.3 ± 1.7 <.001 ASM, kg 19.7 ± 2.6 20.5 ± 2.3 21.3 ± 2.9 <.001 13.6 ± 1.7 14.4 ± 1.8 15.4 ± 2.0 <.001 ASM/Ht² 7.2 ± 0.8 7.6 ± 0.5 7.8 ± 0.7 <.001 5.9 ± 0.5 6.2 ± 0.5 6.5 ± 0.6 <.001 Grip strength, kg 31.6 ± 5.7 32.2 ± 5.1 32.2 ± 6.5 0.659 20.0 ± 4.0 19.7 ± 4.7 19.9 ± 4.4 0.808 Metabolic abnormality
High blood pressure 50 (40.0) 68 (55.3) 101 (77.1) <.001 94 (38.2) 128 (52.0) 176 (69.9) <.001 Low HDL cholesterol 23 (18.4) 43 (34.7) 54 (41.2) <.001 109 (44.3) 147 (59.8) 146 (57.9) 0.001 High triglycerides 17 (13.6) 37 (29.8) 42 (32.1) <.001 47 (19.1) 73 (39.7) 72 (28.6) 0.013 High glucose 38 (30.4) 49 (39.5) 79 (60.3) <.001 61 (24.8) 88 (35.8) 104 (41.3) <.001 Metabolic syndrome 13 (10.4) 37 (29.8) 89 (67.9) <.001 52 (21.1) 121 (49.2) 162 (64.3) <.001 Data are expressed as means ± standard deviation, median [inter quartile range] and number (%)
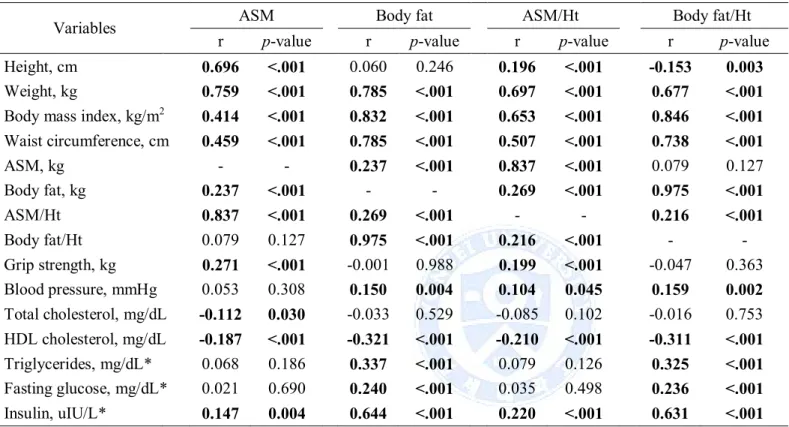
3. Correlations between muscle mass and fat mass with metabolic variables
The associations between muscle mass and fat mass with metabolic variables after adjusting for age, smoking, drinking and physical activity are shown in Table 4 and 5. For man, ASM was significantly positively correlated with body fat (r = 0.237, p < .001), insulin (r = 0.147, p = 0.004) and grip strength (r = 0.271, p < .001), was significantly negatively correlated with total cholesterol (r = -0.112, p = 0.030) and HDL cholesterol (r = -0.187, p < .001); ASM/Ht2 was significantly positively correlated with body fat (r = 0.269, p < .001),
body fat/Ht2(r = 0.216, p < .001), blood pressure (r = 0.104, p = 0.045), insulin (r = 0.220, p < .001) and grip strength (r = 0.199, p < .001), was significantly negatively correlated with
HDL cholesterol (r = -0.210, p < .001). Body fat and body fat/Ht2was significantly positively
correlated with ASM/Ht2, HDL cholesterol, blood pressure, triglycerides, fasting glucose and
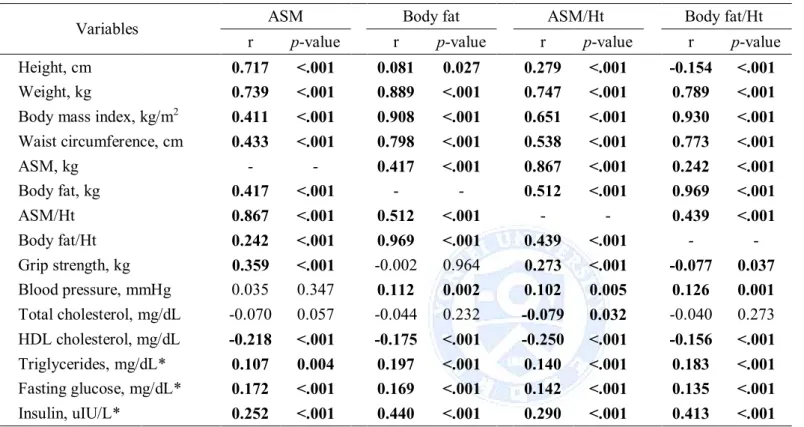
insulin, was significantly negatively correlated with HDL cholesterol (Table 4). For women, association muscle mass and fat mass was stronger than in men (r = 0.237, p < .001 for men and r = 0.417, p < .001 for women). Both muscle mass and fat mass indices were significantly positively correlated with blood pressure (ASM excepted), triglycerides, fasting glucose and insulin, were significantly negatively correlated with HDL cholesterol (Table 5).
Table 4. Correlation analysis between muscle mass and fat mass with metabolic variables in men
Variables ASM Body fat ASM/Ht² Body fat/Ht²
r p-value r p-value r p-value r p-value
Height, cm 0.696 <.001 0.060 0.246 0.196 <.001 -0.153 0.003
Weight, kg 0.759 <.001 0.785 <.001 0.697 <.001 0.677 <.001
Body mass index, kg/m2 0.414 <.001 0.832 <.001 0.653 <.001 0.846 <.001 Waist circumference, cm 0.459 <.001 0.785 <.001 0.507 <.001 0.738 <.001 ASM, kg - - 0.237 <.001 0.837 <.001 0.079 0.127 Body fat, kg 0.237 <.001 - - 0.269 <.001 0.975 <.001 ASM/Ht² 0.837 <.001 0.269 <.001 - - 0.216 <.001 Body fat/Ht² 0.079 0.127 0.975 <.001 0.216 <.001 - -Grip strength, kg 0.271 <.001 -0.001 0.988 0.199 <.001 -0.047 0.363 Blood pressure, mmHg 0.053 0.308 0.150 0.004 0.104 0.045 0.159 0.002 Total cholesterol, mg/dL -0.112 0.030 -0.033 0.529 -0.085 0.102 -0.016 0.753 HDL cholesterol, mg/dL -0.187 <.001 -0.321 <.001 -0.210 <.001 -0.311 <.001 Triglycerides, mg/dL* 0.068 0.186 0.337 <.001 0.079 0.126 0.325 <.001 Fasting glucose, mg/dL* 0.021 0.690 0.240 <.001 0.035 0.498 0.236 <.001 Insulin, uIU/L* 0.147 0.004 0.644 <.001 0.220 <.001 0.631 <.001
Adjustment for age, smoking status, physical activity, and alcohol intake
Abbreviations: ASM, Appendicular skeletal muscle mass; HDL, high density lipoprotein
Correlation coefficients (r) and p-values were calculated with Pearson's (for normally distributed variables) or *Spearman's (for non-normally distributed variables) correlation coefficients.
Table 5. Correlation between muscle mass and fat mass with metabolic variables in women
Variables ASM Body fat ASM/Ht² Body fat/Ht²
r p-value r p-value r p-value r p-value
Height, cm 0.717 <.001 0.081 0.027 0.279 <.001 -0.154 <.001
Weight, kg 0.739 <.001 0.889 <.001 0.747 <.001 0.789 <.001
Body mass index, kg/m2 0.411 <.001 0.908 <.001 0.651 <.001 0.930 <.001 Waist circumference, cm 0.433 <.001 0.798 <.001 0.538 <.001 0.773 <.001 ASM, kg - - 0.417 <.001 0.867 <.001 0.242 <.001 Body fat, kg 0.417 <.001 - - 0.512 <.001 0.969 <.001 ASM/Ht² 0.867 <.001 0.512 <.001 - - 0.439 <.001 Body fat/Ht² 0.242 <.001 0.969 <.001 0.439 <.001 - -Grip strength, kg 0.359 <.001 -0.002 0.964 0.273 <.001 -0.077 0.037 Blood pressure, mmHg 0.035 0.347 0.112 0.002 0.102 0.005 0.126 0.001 Total cholesterol, mg/dL -0.070 0.057 -0.044 0.232 -0.079 0.032 -0.040 0.273 HDL cholesterol, mg/dL -0.218 <.001 -0.175 <.001 -0.250 <.001 -0.156 <.001 Triglycerides, mg/dL* 0.107 0.004 0.197 <.001 0.140 <.001 0.183 <.001
4. Correlations between muscle mass and fat mass
The relationships between muscle mass and fat mass were also presented using scatter plots, separately for men and women (Figure 2). In men, ASM was significantly and positively correlation with body fat (r = 0.237, p < .001), and ASM/Ht2 was significantly and
positively correlation with body fat/Ht² (r = 0.216, p < .001). In women, ASM was significantly and positively correlation with body fat (r = 0.417, p < .001), and ASM/Ht2 was
significantly and positively correlation with body fat/Ht² (r= 0.512, p <.001). These results provided evidence that muscle mass is strongly correlated with fat mass in women than in men.
Men Men
r = .237, p < .001 r = .216, p < .001
Men (n=381)
5. Association between muscle mass and fat mass and metabolic abnormalities
Table 6, 7, 8 and 9 shows association between tertile of muscle mass and fat mass and metabolic abnormalities using multiple logistic regression analysis in each sex. In men, body fat and body fat/Ht² were associated with all of the metabolic abnormalities, and further adjustment for muscle mass and potential confounders were significantly associated with all of the metabolic abnormalities. The highest tertile of body fat and body fat/Ht² were 17.29 and 16.43 times, respectively, more likely to have an increased risk of metabolic syndrome than those in lowest tertile. In contrast, ASM and ASM/Ht2 were associated with low HDL
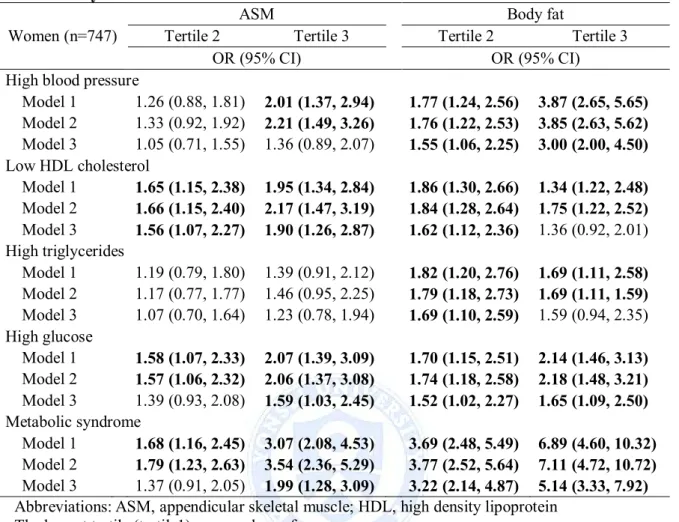
cholesterol and metabolic syndrome, but after adjustment for body fat and potential confounders the association was significant with low HDL cholesterol (ASM; OR = 2.24, 95% CI = 1.48-3.38) (Table 6 and 7). In women, body fat and body fat/Ht² were associated with all of the metabolic abnormalities, but further adjustment for muscle mass and potential confounders was significantly associated with high blood pressure, high glucose and metabolic syndrome. The highest tertile of body fat and body fat/Ht² were 5.14 and 4.15 times, respectively, more likely to have an increased risk of metabolic syndrome than those in lowest tertile. In contrast, ASM was associated with high blood pressure, low HDL cholesterol, high glucose and metabolic syndrome, and further adjustment for body fat mass and potential confounders was significantly associated with low HDL cholesterol (OR = 1.90, 95% CI 1.26-2.27), high glucose (OR = 1.59, 95% CI = 1.03-2.45) and metabolic syndrome (OR = 1.99, 95% CI = 1.28-3.09) (Table 8). ASM/Ht2 was associated with all of the
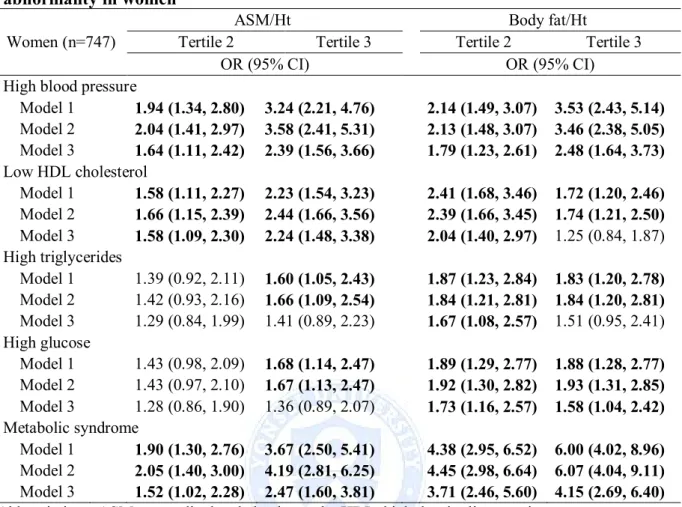
metabolic abnormalities, but further adjustment for body fat/Ht2 and potential confounders
was significantly associated with high blood pressure (OR = 2.39, 95% CI = 1.56-3.66), low HDL cholesterol (OR = 2.24, 95% CI = 1.48-3.38) and metabolic syndrome (OR = 2.47, 95%
Abbreviations: ASM, appendicular skeletal muscle; HDL, high density lipoprotein The lowest tertile (tertile1) was used as reference group.
Model1: adjusted for age.
Model2: adjusted for age, smoking, drinking and physical activity.
Model3: adjusted for age, smoking, drinking, physical activity, and body fat (ASM). Table 6. Logistic regression models of ASM and body fat mass for metabolic abnormality in men
Men (n=381)
ASM Body fat
Tertile 2 Tertile 3 Tertile 2 Tertile 3
OR (95% CI) OR (95% CI)
High blood pressure
Model 1 1.40 (0.83, 2.34) 1.66 (0.97, 2.83) 1.90 (1.14, 3.15) 5.21 (3.01, 9.00) Model 2 1.42 (0.84, 2.39) 1.57 (0.91, 2.71) 1.96 (1.17, 3.30) 5.43 (3.10, 9.48) Model 3 1.24 (0.72, 2.15) 1.02 (0.56, 1.86) 1.96 (1.16, 3.30) 5.43 (3.06, 9.64) Low HDL cholesterol Model 1 1.83 (1.04, 3.24) 2.13 (1.20, 3.81) 2.34 (1.31, 4.21) 3.10 (1.75, 5.48) Model 2 1.85 (1.04, 3.31) 2.44 (1.33, 4.45) 2.42 (1.33, 4.40) 3.29 (1.83, 5.90) Model 3 1.72 (0.95, 3.09) 1.88 (1.01, 3.49) 2.26 (1.23, 4.12) 2.81 (1.54, 5.12) High triglycerides Model 1 1.30 (0.71, 3.40) 1.58 (0.86, 2.92) 2.68 (1.41, 5.11) 2.97 (1.58, 5.60) Model 2 1.27 (0.69, 2.35) 1.66 (0.89, 3.10) 2.83 (1.47, 5.45) 3.12 (1.64, 5.93) Model 3 1.24 (0.67, 2.31) 1.35 (0.71, 2.56) 2.81 (1.46, 5.41) 3.06 (1.59, 5.89) High glucose Model 1 1.14 (0.68, 1.90) 1.29 (0.76, 2.18) 1.49 (0.88, 2.51) 3.46 (2.06, 5.81) Model 2 1.13 (0.67, 1.88) 1.27 (0.75, 2.17) 1.46 (0.86, 2.48) 3.44 (3.04, 5.79) Model 3 1.04 (0.61, 1.76) 0.93 (0.53, 1.64) 1.46 (0.86, 2.49) 3.44 (2.01, 5.88) Metabolic syndrome Model 1 1.69 (0.97, 2.92) 2.57 (1.47, 4.50) 3.66 (1.83, 7.31) 18.24 (9.23, 36.07) Model 2 1.66 (0.96, 2.89) 2.68 (1.52, 4.73) 3.75 (1.87, 7.54) 19.10 (9.57, 38.12) Model 3 1.59 (0.85, 2.98) 1.54 (0.80, 2.99) 3.57 (1.77, 7.19) 17.29 (8.60, 34.75)
Table 7. Logistic regression models of ASM/Ht² and Body fat/Ht² for metabolic abnormality in men
Men (n=381)
ASM/Ht² Body fat/Ht²
Tertile 2 Tertile 3 Tertile 2 Tertile 3
OR (95% CI) OR (95% CI)
High blood pressure
Model 1 1.65 (0.99, 2.76) 1.74 (1.03, 2.94) 1.64 (1.00, 2.71) 5.70 (3.25, 10.00) Model 2 1.58 (0.94, 2.68) 1.68 (0.98, 2.88) 1.68 (1.00, 2.82) 6.06 (3.41, 10.78) Model 3 1.21 (0.69, 2.11) 1.02 (0.56, 1.85) 1.68 (0.99, 2.85) 6.06 (3.34, 11.01) Low HDL cholesterol Model 1 1.45 (0.83, 2.54) 1.79 (1.02, 3.13) 3.06 (1.70, 5.52) 3.22 (1.79, 5.81) Model 2 1.62 (0.91, 2.88) 1.99 (1.11, 3.58) 3.29 (1.79, 6.05) 3.38 (1.85, 6.17) Model 3 1.41 (0.78, 2.53) 1.52 (0.83, 2.80) 3.00 (1.62, 5.55) 2.85 (1.53, 5.31) High triglycerides Model 1 1.74 (0.95, 3.16) 1.41 (0.76, 2.62) 2.61 (1.39, 4.89) 2.68 (1.43, 5.03) Model 2 1.89 (1.02, 3.48) 1.53 (0.81, 2.89) 2.70 (1.42, 5.12) 2.81 (1.48, 5.33) Model 3 1.66 (0.89, 3.09) 1.20 (0.62, 2.31) 2.67 (1.39, 5.11) 2.76 (1.43, 5.36) High glucose Model 1 1.79 (1.07, 2.99) 1.54 (0.91, 2.61) 1.78 (1.06, 3.00) 3.33 (1.98, 5.61) Model 2 1.86 (1.10, 3.13) 1.57 (0.92, 2.68) 1.71 (1.01, 2.90) 3.28 (1.94, 5.56) Model 3 1.57 (0.92, 2.70) 1.13 (0.64, 2.00) 1.72 (1.01, 2.95) 3.32 (1.92, 5.75) Metabolic syndrome Model 1 1.98 (1.15, 3.43) 2.71 (1.55, 4.73) 3.91 (1.97, 7.75) 18.12 (9.14, 35.92) Model 2 2.15 (1.23, 3.75) 2.91 (1.65, 5.15) 3.89 (1.94, 7.78) 18.79 (9.39, 37.60) Model 3 1.64 (0.86, 3.10) 1.58 (0.82, 3.06) 3.55 (1.76, 7.15) 16.43 (8.13, 33.18)
Abbreviations: ASM, appendicular skeletal muscle; HDL, high density lipoprotein The lowest tertile (tertile1) was used as reference group.
Model1: adjusted for age.
Model2: adjusted for age, smoking, drinking and physical activity.
Table 8. Logistic regression models of ASM and body fat mass for metabolic abnormality in women
Women (n=747)
ASM Body fat
Tertile 2 Tertile 3 Tertile 2 Tertile 3
OR (95% CI) OR (95% CI)
High blood pressure
Model 1 1.26 (0.88, 1.81) 2.01 (1.37, 2.94) 1.77 (1.24, 2.56) 3.87 (2.65, 5.65) Model 2 1.33 (0.92, 1.92) 2.21 (1.49, 3.26) 1.76 (1.22, 2.53) 3.85 (2.63, 5.62) Model 3 1.05 (0.71, 1.55) 1.36 (0.89, 2.07) 1.55 (1.06, 2.25) 3.00 (2.00, 4.50) Low HDL cholesterol Model 1 1.65 (1.15, 2.38) 1.95 (1.34, 2.84) 1.86 (1.30, 2.66) 1.34 (1.22, 2.48) Model 2 1.66 (1.15, 2.40) 2.17 (1.47, 3.19) 1.84 (1.28, 2.64) 1.75 (1.22, 2.52) Model 3 1.56 (1.07, 2.27) 1.90 (1.26, 2.87) 1.62 (1.12, 2.36) 1.36 (0.92, 2.01) High triglycerides Model 1 1.19 (0.79, 1.80) 1.39 (0.91, 2.12) 1.82 (1.20, 2.76) 1.69 (1.11, 2.58) Model 2 1.17 (0.77, 1.77) 1.46 (0.95, 2.25) 1.79 (1.18, 2.73) 1.69 (1.11, 1.59) Model 3 1.07 (0.70, 1.64) 1.23 (0.78, 1.94) 1.69 (1.10, 2.59) 1.59 (0.94, 2.35) High glucose Model 1 1.58 (1.07, 2.33) 2.07 (1.39, 3.09) 1.70 (1.15, 2.51) 2.14 (1.46, 3.13) Model 2 1.57 (1.06, 2.32) 2.06 (1.37, 3.08) 1.74 (1.18, 2.58) 2.18 (1.48, 3.21) Model 3 1.39 (0.93, 2.08) 1.59 (1.03, 2.45) 1.52 (1.02, 2.27) 1.65 (1.09, 2.50) Metabolic syndrome Model 1 1.68 (1.16, 2.45) 3.07 (2.08, 4.53) 3.69 (2.48, 5.49) 6.89 (4.60, 10.32) Model 2 1.79 (1.23, 2.63) 3.54 (2.36, 5.29) 3.77 (2.52, 5.64) 7.11 (4.72, 10.72) Model 3 1.37 (0.91, 2.05) 1.99 (1.28, 3.09) 3.22 (2.14, 4.87) 5.14 (3.33, 7.92)
Abbreviations: ASM, appendicular skeletal muscle; HDL, high density lipoprotein The lowest tertile (tertile1) was used as reference group.
Model1: adjusted for age.
Model2: adjusted for age, smoking, drinking and physical activity.
Table 9. Logistic regression models of ASM/Ht² and Body fat/Ht² for metabolic abnormality in women
Women (n=747)
ASM/Ht² Body fat/Ht²
Tertile 2 Tertile 3 Tertile 2 Tertile 3
OR (95% CI) OR (95% CI)
High blood pressure
Model 1 1.94 (1.34, 2.80) 3.24 (2.21, 4.76) 2.14 (1.49, 3.07) 3.53 (2.43, 5.14) Model 2 2.04 (1.41, 2.97) 3.58 (2.41, 5.31) 2.13 (1.48, 3.07) 3.46 (2.38, 5.05) Model 3 1.64 (1.11, 2.42) 2.39 (1.56, 3.66) 1.79 (1.23, 2.61) 2.48 (1.64, 3.73) Low HDL cholesterol Model 1 1.58 (1.11, 2.27) 2.23 (1.54, 3.23) 2.41 (1.68, 3.46) 1.72 (1.20, 2.46) Model 2 1.66 (1.15, 2.39) 2.44 (1.66, 3.56) 2.39 (1.66, 3.45) 1.74 (1.21, 2.50) Model 3 1.58 (1.09, 2.30) 2.24 (1.48, 3.38) 2.04 (1.40, 2.97) 1.25 (0.84, 1.87) High triglycerides Model 1 1.39 (0.92, 2.11) 1.60 (1.05, 2.43) 1.87 (1.23, 2.84) 1.83 (1.20, 2.78) Model 2 1.42 (0.93, 2.16) 1.66 (1.09, 2.54) 1.84 (1.21, 2.81) 1.84 (1.20, 2.81) Model 3 1.29 (0.84, 1.99) 1.41 (0.89, 2.23) 1.67 (1.08, 2.57) 1.51 (0.95, 2.41) High glucose Model 1 1.43 (0.98, 2.09) 1.68 (1.14, 2.47) 1.89 (1.29, 2.77) 1.88 (1.28, 2.77) Model 2 1.43 (0.97, 2.10) 1.67 (1.13, 2.47) 1.92 (1.30, 2.82) 1.93 (1.31, 2.85) Model 3 1.28 (0.86, 1.90) 1.36 (0.89, 2.07) 1.73 (1.16, 2.57) 1.58 (1.04, 2.42) Metabolic syndrome Model 1 1.90 (1.30, 2.76) 3.67 (2.50, 5.41) 4.38 (2.95, 6.52) 6.00 (4.02, 8.96) Model 2 2.05 (1.40, 3.00) 4.19 (2.81, 6.25) 4.45 (2.98, 6.64) 6.07 (4.04, 9.11) Model 3 1.52 (1.02, 2.28) 2.47 (1.60, 3.81) 3.71 (2.46, 5.60) 4.15 (2.69, 6.40)
Abbreviations: ASM, appendicular skeletal muscle; HDL, high density lipoprotein The lowest tertile (tertile1) was used as reference group.
Model1: adjusted for age.
Model2: adjusted for age, smoking, drinking and physical activity.
6. The areas under the curves of muscle mass and fat mass in the prediction of metabolic abnormalities
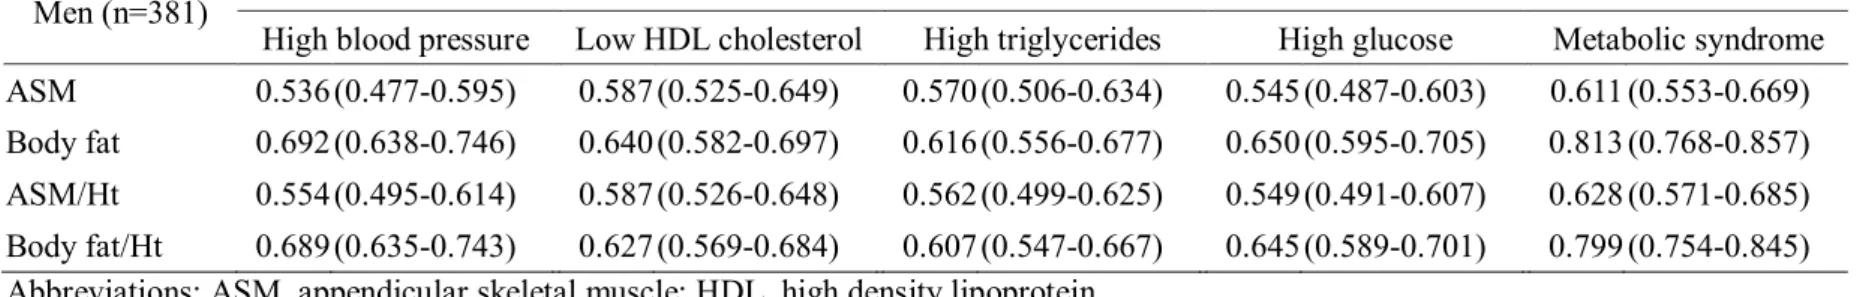
The areas under the curves (AUC) of muscle mass and fat mass in the prediction of metabolic abnormalities are shown in Table 10, 11 and Figure 3, 4. In men, the AUC of fat mass was greater than that of muscle mass in the prediction of all of the metabolic abnormalities. The AUCs for body fat and body fat /Ht² for identifying High blood pressure were 0.692 (95% CI = 0.638-0.746) and 0.689 (95% CI = 0.635-0.743); low HDL cholesterol were 0.640 (95% CI = 0.582-0.697) and 0.627 (95% CI = 0.569-0.684); high triglycerides were 0.616 (95% CI = 0.556-0.677) and 0.607 (95% CI = 0.547-0.667); high glucose were 0.650 (95% CI = 0.595-0.705) and 0.645 (95% CI = 0.589-0.701); metabolic syndrome were 0.813 (95% CI = 0.768-0.857) and 0.799 (95% CI = 0.754-0.845), respectively (Table 10 and Figure 3). In women, the AUC of fat mass was greater than that of muscle mass in the prediction of high blood pressure, high triglycerides and metabolic syndrome. The AUCs for body fat and body fat /Ht² for identifying high blood pressure were 0.660 (95% CI = 0.621-0.699) and 0.659 (95% CI = 0.620-0.698); high triglycerides were 0.573 (95% CI = 0.527-0.618) and 0.570 (95% CI = 0.524-0.616); metabolic syndrome were 0.717 (95% CI = 0.680-0.753) and 0.700 (95% CI = 0.663-0.737), respectively. The AUC of fat mass and muscle mass were showed similar in the prediction of low HDL cholesterol and high glucose. The AUCs for ASM/Ht² and body fat for identifying low HDL cholesterol were 0.581 (95% CI = 0.524-0.607) and 0.572 (95% CI = 0.530-0.614), respectively. The AUCs for ASM and body fat for identifying high glucose were 0.584 (95% CI = 0.541-0.672) and 0.591 (95% CI = 0.548-0.633), respectively (Table 11 and Figure 4).
Table 10. Comparison of areas under ROC curve for different muscle mass and fat mass by metabolic abnormalities in men
Men (n=381) Areas under ROC curve for 95% CI
High blood pressure Low HDL cholesterol High triglycerides High glucose Metabolic syndrome ASM 0.536(0.477-0.595) 0.587(0.525-0.649) 0.570(0.506-0.634) 0.545(0.487-0.603) 0.611 (0.553-0.669) Body fat 0.692(0.638-0.746) 0.640(0.582-0.697) 0.616(0.556-0.677) 0.650(0.595-0.705) 0.813 (0.768-0.857) ASM/Ht² 0.554(0.495-0.614) 0.587(0.526-0.648) 0.562(0.499-0.625) 0.549(0.491-0.607) 0.628 (0.571-0.685) Body fat/Ht² 0.689(0.635-0.743) 0.627(0.569-0.684) 0.607(0.547-0.667) 0.645(0.589-0.701) 0.799 (0.754-0.845) Abbreviations: ASM, appendicular skeletal muscle; HDL, high density lipoprotein
Table 11. Comparison of areas under ROC curve for different muscle mass and fat mass by metabolic abnormalities in women
Women (n=747) Areas under ROC curve for 95% CI
High blood pressure High glucose
High glucose High blood pressure
IV.
DISCUSSION
1. Summary of finding
The present study investigated that fat mass and muscle mass were associated with the metabolic syndrome along with its components in Korean older adults. We observed that higher fat mass was associated with increased risk of metabolic syndrome along with its components in both men and women. Furthermore, higher muscle mass was associated with increased risk of high blood pressure, low HDL cholesterol, high glucose and metabolic syndrome after adjustment for body fat and potential confounders only in women. Muscle mass is strongly correlated with fat mass in women than in men.
2. Comparison with previous studies
In the elderly population, body composition such as fat mass and muscle mass, gradually changes with age even if the body weight remains unchanged (Gallagher et al. 2000; Kim et al. 2014). Previous studies have proven that fat mass is associated with inflammatory markers and metabolic abnormalities (Bosy-Westphal et al. 2006a; Forouhi, Sattar and McKeigue 2001). Consistent with those studies, our study showed that fat mass was related to metabolic abnormalities, independent of muscle mass and other potential confounders.
Meanwhile, previous studies have reported that low muscle mass reduces the intensity and endurance of physical activity (Wannamethee and Atkins 2015). These changes may increase of obesity and obesity-relates metabolic abnormalities in older people (Ishii et al. 2014;
metabolic syndrome (Jurca et al. 2005). Furthermore, both obesity and sarcopenia are associated with metabolic disorders and are important causes of disability, morbidity and mortality (Stephen and Janssen 2009; Wannamethee and Atkins 2015). However, our study showed that the positive associations between muscle mass and high blood pressure, low HDL cholesterol, high glucose and metabolic syndrome were observed only in women. These results show that women with high muscle mass have an especially greater risk of metabolic abnormalities than those with lower muscle mass, but this is not consistent with previous studies.
3. Possible mechanism
One of the possible underlying factors is validation of a BIA equation to predict muscle mass and fat mass. The BIA is simple, noninvasive, relatively inexpensive, easy-to-use method of estimating body composition. Numerous studies have developed equations for estimating lean body mass from BIA measurements (Bosaeus et al. 2014; Rangel Peniche, Raya Giorguli and Aleman-Mateo 2015). However, to ensure that reliable BIA measurements are obtained, several factors such as hydration status, food intake, and exercise must be controlled (Thibault, Genton and Pichard 2012).
adults (Odden et al. 2012; Zuccala et al. 2005). Faster walking speed, also often termed gait speed, has been shown to reflect muscle mass (Auyeung et al. 2014; Patil et al. 2013). Consistent with those studies, our finding suggest that higher ASM/Ht2 was associated with
an increased risk of high blood pressure. In a more general sense, older age might represent a condition of frailty, which is associated with the epidemiological phenomenon of “reverse
epidemiology”(Chien et al. 2012; Guder et al. 2015). In this perspective, our study supported that muscle mass is an independent risk factor for metabolic abnormalities. However, the aforementioned studies included hospitalized patients or, very old subjects or Western population, thus these findings are limited to apply to healthy older people.
Additionally, our findings for muscle mass may be explained by assuming that the higher muscle mass group includes subjects with both obesity and high fat mass. A study by Kimyagarov et al (2010), when body composition was analyzed according to the three BMI groups, subjects with normal BMI show a significantly increased absolute body fat and body fat/Ht2, but not muscle mass from those in the low and high BMI groups (Kimyagarov et al.
2010). However, our study shows that increases in muscle mass have been shown to be related to increased body fat and grip strength. On the other hand, increases in body fat have been shown to be related to increased muscle mass but not grip strength. These finding are suggested that fat mass and muscle mass are not biologically independent. In our study, among the highest tertile of muscle mass they simultaneously included high body fat and high muscle mass groups, and low body fat and high muscle mass group, thus adjustment for body fat as a covariate might be inadequate.
In addition, we used ROC analysis to address the issue of discriminative performance. Body fat seems to be a better predictor of metabolic abnormalities in men, while muscle and fat mass indices are similar prediction in women. These result demonstrated that the pattern
and magnitude of body composition changes varied for the different indices of muscle and fat mass, was not similar for men and women (Strugnell et al. 2014).
4. Limitations
Our study has several limitations. First, muscle mass and fat mass does not directly assess the) deposition of body composition such as DXA. Thus, we could not address the relationship between direct measures and metabolic abnormalities. Second, since the subjects were community-dwelling older adults, our findings may not be able to be generalized to older Korean adults from other racial/ethnic groups. Finally, our study was a cross-sectional analysis which did not establish a causative relationship between muscle mass and fat mass with metabolic abnormalities.
V. CONCLUSIONS
The findings of the present study indicated that higher muscle mass and fat mass further increases the risks of metabolic abnormalities, such as high blood pressure, low HDL cholesterol, high glucose and metabolic syndrome even adjustment of age and body composition in older adult Korean women. This study adds to the growing knowledge on the better predictor of metabolic abnormalities is fat mass than muscle mass in men, and muscle mass is also predicted metabolic abnormalities in women. Further longitudinal studies are required to clarify the mechanism by which muscle mass is related to the development of metabolic abnormality among older adults.
REFERENCES
1. Alberti, K. G., R. H. Eckel, S. M. Grundy, P. Z. Zimmet, J. I. Cleeman, K. A. Donato, J. C. Fruchart, W. P. James, C. M. Loria and S. C. Smith, Jr. 2009. "Harmonizing the metabolic syndrome: a joint interim statement of the International Diabetes Federation Task Force on Epidemiology and Prevention; National Heart, Lung, and Blood Institute; American Heart Association; World Heart Federation; International Atherosclerosis Society; and International Association for the Study of Obesity". Circulation, 120(16). 2. Alexandre Tda, S., Y. A. Duarte, J. L. Santos, R. Wong and M. L. Lebrao. 2014.
"Sarcopenia according to the European Working Group on Sarcopenia in Older People (EWGSOP) versus dynapenia as a risk factor for mortality in the elderly". J Nutr Health
Aging, 18(8).
3. Auyeung, T. W., S. W. Lee, J. Leung, T. Kwok and J. Woo. 2014. "Age-associated decline of muscle mass, grip strength and gait speed: a 4-year longitudinal study of 3018 community-dwelling older Chinese". Geriatr Gerontol Int, 14 Suppl 1.
4. Baumgartner, R. N., P. M. Stauber, D. McHugh, K. M. Koehler and P. J. Garry. 1995. "Cross-sectional age differences in body composition in persons 60+ years of age". J
7. Bosy-Westphal, A., C. Geisler, S. Onur, O. Korth, O. Selberg, J. Schrezenmeir and M. J. Muller. 2006b. "Value of body fat mass vs anthropometric obesity indices in the assessment of metabolic risk factors". Int J Obes (Lond), 30(3).
8. Chien, C. C., C. S. Yen, J. J. Wang, H. A. Chen, M. T. Chou, C. C. Chu, C. C. Chio, J. C. Hwang, H. Y. Wang, Y. H. Lu and W. C. Kan. 2012. "Reverse epidemiology of hypertension-mortality associations in hemodialysis patients: a long-term population-based study". Am J Hypertens, 25(8).
9. Cruz-Jentoft, A. J., J. P. Baeyens, J. M. Bauer, Y. Boirie, T. Cederholm, F. Landi, F. C. Martin, J. P. Michel, Y. Rolland, S. M. Schneider, E. Topinkova, M. Vandewoude and M. Zamboni. 2010. "Sarcopenia: European consensus on definition and diagnosis: Report of the European Working Group on Sarcopenia in Older People". Age Ageing, 39(4).
10. Forbes, G. B. 1999. "Longitudinal changes in adult fat-free mass: influence of body weight". Am J Clin Nutr, 70(6).
11. Ford, E. S., W. H. Giles and W. H. Dietz. 2002. "Prevalence of the metabolic syndrome among us adults: Findings from the third national health and nutrition examination survey". JAMA, 287(3).
12. Forouhi, N., N. Sattar and P. McKeigue. 2001. "Relation of C-reactive protein to body fat distribution and features of the metabolic syndrome in Europeans and South Asians".
International journal of obesity and related metabolic disorders: journal of the International Association for the Study of Obesity, 25(9).
13. Friedewald, W. T., R. I. Levy and D. S. Fredrickson. 1972. "Estimation of the concentration of low-density lipoprotein cholesterol in plasma, without use of the preparative ultracentrifuge". Clin Chem, 18(6).
F. X. Pi-Sunyer and S. B. Heymsfield. 2000. "Weight stability masks sarcopenia in elderly men and women". Am J Physiol Endocrinol Metab, 279(2).
15. Guder, G., G. Gelbrich, F. Edelmann, R. Wachter, B. Pieske, S. Pankuweit, B. Maisch, C. Prettin, S. Brenner, C. Morbach, D. Berliner, N. Deubner, G. Ertl, C. E. Angermann and S. Stork. 2015. "Reverse epidemiology in different stages of heart failure". Int J Cardiol, 184c.
16. Ishii, S., T. Tanaka, M. Akishita, Y. Ouchi, T. Tuji and K. Iijima. 2014. "Metabolic syndrome, sarcopenia and role of sex and age: cross-sectional analysis of Kashiwa cohort study". PLoS One, 9(11).
17. Jurca, R., M. J. Lamonte, C. E. Barlow, J. B. Kampert, T. S. Church and S. N. Blair. 2005. "Association of muscular strength with incidence of metabolic syndrome in men".
Medicine and Science in Sports and Exercise, 37(11).
18. Karakelides, H. and K. S. Nair. 2005. "Sarcopenia of aging and its metabolic impact".
Curr Top Dev Biol, 68.
19. Kim, T. N., M. S. Park, J. Y. Ryu, H. Y. Choi, H. C. Hong, H. J. Yoo, H. J. Kang, W. Song, S. W. Park, S. H. Baik, A. B. Newman and K. M. Choi. 2014. "Impact of visceral fat on skeletal muscle mass and vice versa in a prospective cohort study: the Korean Sarcopenic Obesity Study (KSOS)". PLoS One, 9(12).
22. Odden, M. C., C. A. Peralta, M. N. Haan and K. E. Covinsky. 2012. "Rethinking the association of high blood pressure with mortality in elderly adults: The impact of frailty".
Archives of Internal Medicine, 172(15).
23. Park, H., S. Kim, J. Lee, J. Lee, J. Han, D. Yoon, S. Baik, D. Choi and K. Choi. 2007. "Prevalence and trends of metabolic syndrome in Korea: Korean National Health and Nutrition Survey 1998–2001". Diabetes, Obesity and Metabolism, 9(1).
24. Patil, R., K. Uusi-Rasi, M. Pasanen, P. Kannus, S. Karinkanta and H. Sievanen. 2013. "Sarcopenia and osteopenia among 70-80-year-old home-dwelling Finnish women: prevalence and association with functional performance". Osteoporos Int, 24(3).
25. Rangel Peniche, D. B., G. Raya Giorguli and H. Aleman-Mateo. 2015. "Accuracy of a predictive bioelectrical impedance analysis equation for estimating appendicular skeletal muscle mass in a non-Caucasian sample of older people". Arch Gerontol Geriatr, 61(1). 26. Roriz-Cruz, M., I. Rosset, T. Wada, T. Sakagami, M. Ishine, J. S. Roriz-Filho, T. R. Cruz,
R. P. Rodrigues, I. Resmini, S. Sudoh, Y. Wakatsuki, M. Nakagawa, A. C. Souza, T. Kita and K. Matsubayashi. 2007. "Stroke-independent association between metabolic syndrome and functional dependence, depression, and low quality of life in elderly community-dwelling Brazilian people". J Am Geriatr Soc, 55(3).
27. Stephen, W. C. and I. Janssen. 2009. "Sarcopenic-obesity and cardiovascular disease risk in the elderly". J Nutr Health Aging, 13(5).
28. Strugnell, C., D. W. Dunstan, D. J. Magliano, P. Z. Zimmet, J. E. Shaw and R. M. Daly. 2014. "Influence of age and gender on fat mass, fat-free mass and skeletal muscle mass among Australian adults: the Australian diabetes, obesity and lifestyle study (AusDiab)".
J Nutr Health Aging, 18(5).
who?". Clin Nutr, 31(4).
30. "Third Report of the National Cholesterol Education Program (NCEP) Expert Panel on Detection, Evaluation, and Treatment of High Blood Cholesterol in Adults (Adult Treatment Panel III) final report". 2002. Circulation, 106(25).
31. Thomas, G. N., C. M. Schooling, S. M. McGhee, S. Y. Ho, B. M. Cheung, N. M. Wat, E. D. Janus, K. S. Lam and T. H. Lam. 2007. "Metabolic syndrome increases all-cause and vascular mortality: the Hong Kong Cardiovascular Risk Factor Study". Clin Endocrinol
(Oxf), 66(5).
32. Wannamethee, S. G. and J. L. Atkins. 2015. "Muscle loss and obesity: the health implications of sarcopenia and sarcopenic obesity". Proc Nutr Soc.
33. Wulsin, L. R., P. S. Horn, J. L. Perry, J. Massaro and R. D'Agostino. "Autonomic Imbalance as a Predictor of Metabolic Risks, Cardiovascular Disease, Diabetes, and Mortality Autonomic Imbalance Predicts CVD, DM, Mortality". The Journal of Clinical
Endocrinology & Metabolism, 0(0).
34. Yoon, Y. S., E. S. Lee, C. Park, S. Lee and S. W. Oh. 2007. "The new definition of metabolic syndrome by the international diabetes federation is less likely to identify metabolically abnormal but non-obese individuals than the definition by the revised national cholesterol education program: the Korea NHANES study". Int J Obes (Lond),
ABSTRACT (KOREAN)
‘노년 인구의 근육량, 체지방량과 대사위험요인과의 관련성’
지도교수 김현창 연세대학교 대학원 보건학과 박지혜 연구 배경 및 목적: 최근 노년 인구에서 sarcopenia는 대사이상과 관련성이 있다고 보고되고 있다. 그러나 sarcopenia의 기준은 통일되어 있지 않고 어떤 기준을 따라야 하는지에 대한 논의가 계속되고 있다. 이에 본 연구에서는 sarcopenia를 정의하기 이전에 근육의 절대량과 대사위험요인 간의 관련성을 분석하고자 하였다. 연구 방법:본 연구는 지역사회기반 전향적 코호트인 Korean Urban Rural Elderly (KURE)
study의 일부로, 2014년에 연구 참여에 동의한 65세 이상의 성인을 대상으로
시행되었다. 대상자 중 917명은 체성분 검사와 혈액 검사 모두를 2014년에
체성분은 인바디 720(바이오스페이스)를 통해 측정하였고, 대사위험요인 지표들은 공복 혈액에서 측정되었다. 근육량, 체지방량과 대사위험요인과의 관련성을 보기 위해 상관분석, 일반선형 및 다변량회귀 분석을 하였고 혼란변수로는 연령, 흡연 및 음주 습관, 신체활동 수준과 각각 근육량과 체지방량을 보정하였다. 연구 결과: 근육량을 3구간으로 나누어 보았을 때 남녀 모두에서 근육량이 증가할수록 체지방량도 통계적으로 유의하게 증가하였다. 체지방량과 모든 대사위험요인은 연령, 흡연 및 음주 습관, 신체활동 수준과 근육량을 보정하였을 때 남자와 여자 모두에서 통계적으로 유의한 관련성을 보였으나 근육량과 대사위험요인은 연령, 흡연 및 음주 습관, 신체활동 수준과 체지방량을 보정하였을 때 여자에서 근육량이 많을 수록 혈압이 높을 오즈비가 2.46 (95% CI 1.61-3.75), HDL이 낮을 오즈비가 2.25 (95% CI 1.49-3.38), 혈당이 높을 오즈비가 1.61 (95% CI 1.05-2.48)로 독립적인 관련성을 보였고, 남자에서는 HDL이 낮을 오즈비가 1.88 (95% CI 1.01-3.49)으로 나머지 위험요인과는 통계적으로 유의한 관련성을 보이지 않았다. 고찰: 본 연구에서는 노년 인구에서 체지방의 증가뿐 아니라 근육량의 증가도