www.cdc.go.kr
374 주간 건강과 질병•제13권 제7호 만성질환 통계
영양소 섭취기준에 대한 섭취비율, 2018
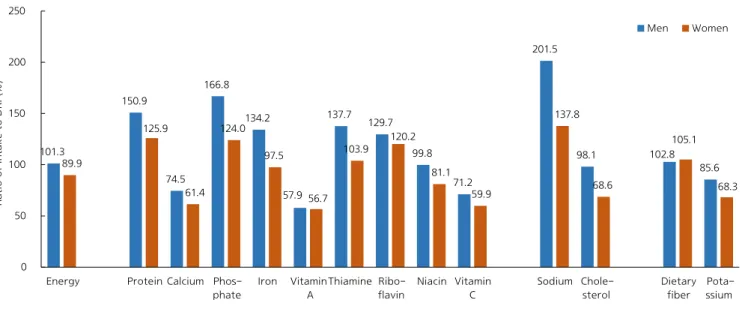
◈ 영양소별 영양소 섭취기준에 대한 섭취비율(만 1세 이상)을 살펴보면, 2018년 기준으로 에너지는 필요추정량 대비 남자가 101.3%, 여자가 89.9% 섭취하는 것으로 나타났으며, 단백질은 남자가 150.9%, 여자가 125.9%로 권장섭취량보다 더 많이 섭취하는 것으로 나타났음. 특히 남자의 나트륨 섭취비율은 201.5%로 목표섭취량의 2배 이상 섭취하고 있었음(그림 1). 101.3 150.9 74.5 166.8 134.2 57.9 137.7 129.7 99.8 71.2 201.5 98.1 102.8 85.6 89.9 125.9 61.4 124.0 97.5 56.7 103.9 120.2 81.1 59.9 137.8 68.6 105.1 68.3 0 50 100 150 200 250 에너지 단백질 칼슘 인 철 비타민 A 티아민 리보 플라빈 나이 아신 비타민 C 나트륨 콜레 스테롤 식이 섬유 칼륨 섭 취 비 율 (% ) 남자 여자 그림 1. 영양소별 영양소 섭취기준에 대한 섭취비율, 2018 * 영양소 섭취기준에 대한 섭취비율: 영양소 섭취기준에 대한 개인별 영양소 섭취량 백분율의 평균값, 만 1세 이상(나트륨 9세 이상, 콜레스테롤 19세 이상) † 영양소 섭취기준: 2015 한국인 영양소 섭취기준(보건복지부, 2015); 에너지, 필요추정량; 단백질 등, 권장섭취량; 나트륨, 콜레스테롤, 목표섭취량; 식이섬유, 칼륨, 충분섭취량www.cdc.go.kr
375 주간 건강과 질병•제13권 제7호
하루 과일, 채소 500g 이상 섭취자 분율 추이, 2007~2018
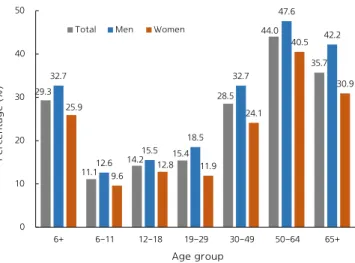
◈ 만 6세 이상에서 하루 과일, 채소 500g 이상 섭취자 분율(연령표준화)은 2007년 35.7%에서 2018년 26.2%로 9.5%p 감소하였음(그림 2). 2018년 기준 남자가 32.7%로 여자(25.9%)보다 6.8%p 높았으며, 연령별로는 50∼64세(44.0%)에서 가장 높았음(그림 3). 35.7 35.0 35.4 37.8 36.5 35.8 35.6 38.2 38.6 33.1 31.4 26.2 38.4 36.9 38.2 40.9 39.8 39 37.2 39.9 41.2 36.7 34.4 29.7 33.4 33.1 32.6 34.8 33.3 32.6 34.3 36.6 35.9 29.6 28.2 22.7 0 10 20 30 40 50 2007 2008 2009 2010 2011 2012 2013 2014 2015 2016 2017 2018 % (연 령 표 준 화) 조사년도 전체 남자 여자 그림 2. 하루 과일, 채소 500g 이상 섭취자 분율 추이, 2007∼2018 29.3 11.1 14.2 15.4 28.5 44.0 35.7 32.7 12.6 15.5 18.5 32.7 47.6 42.2 25.9 9.6 12.8 11.9 24.1 40.5 30.9 0 10 20 30 40 50 6+ 6-11 12-18 19-29 30-49 50-64 65+ % 연령별 전체 남자 여자 그림 3. 하루 과일, 채소 500g 이상 섭취자 분율, 2018 * 하루 과일, 채소 500g 이상 섭취자 분율: 1일 과일 및 채소 섭취량이 500g 이상인 분율, 만 6세이상 †그림2의 연도별 지표값은 2005년 추계인구로 연령표준화 출처: 2018년 국민건강통계, 국민건강영양조사 http://knhanes.cdc.go.kr/ 작성부서: 질병관리본부 질병예방센터 만성질환관리과www.cdc.go.kr
376 주간 건강과 질병•제13권 제7호
Noncommunicable Disease (NCD) Statistics
The Ratio of Nutrient Intake to Dietary Reference Intakes (DRI) by Nutrient, 2018
◈ As of 2018, according to the ratio of nutrient intake to Dietary Reference Intakes (DRI) by nutrients (age 1 and over), men consumed 101.3% of the estimated energy requirement and women consumed 89.9%. The ratios of protein were found to be 150.9% more consumed by men and 125.9% by women than the recommended nutrient intake. Men consumed 201.5% of the sodium intake goal, which was more than twice the intake goal (Figure 1).
101.3 150.9 74.5 166.8 134.2 57.9 137.7 129.7 99.8 71.2 201.5 98.1 102.8 85.6 89.9 125.9 61.4 124.0 97.5 56.7 103.9 120.2 81.1 59.9 137.8 68.6 105.1 68.3 0 50 100 150 200 250
Energy Protein Calcium
Phos-phate Iron Vitamin A Thiamine Ribo-flavin Niacin Vitamin C Sodium Chole-sterol Dietary fiber Pota-ssium R a ti o o f in ta k e t o D R I (% ) Men Women
Figure 1. The ratio of intake to Dietary Reference Intakes by nutrient, 2018
* The ratio of nutrient intake to Dietary Reference Intakes (DRI) by nutrient: Average value of the percentage of nutrient intake per person for the standard of nutrient intake (aged 1 and over), sodium (aged 9 and over), cholesterol (aged 19 year and over)
† Dietary Reference Intakes: Dietary Reference Intakes for Koreans 2015 (Ministry of Health and Welfare, 2015); energy, estimated energy
www.cdc.go.kr
377 주간 건강과 질병•제13권 제7호
Trends in the proportion of consuming more than 500g of vegetables and
fruits per day, 2007-2018
◈ The proportion of consuming more than 500g of vegetables and fruits per day (age standardization) among those aged 6 and over decreased by 9.5%p from 35.7% in 2007 to 26.2% in 2018 (Figure 2). As of 2018, in terms of the proportion of consuming more than 500g of vegetables and fruits per day, men (32.7%) were 6.8% higher than women (25.9%) and the highest proportions were found among those aged 50-64 (44.0%) (Figure 3).
35.7 35.0 35.4 37.8 36.5 35.8 35.6 38.2 38.6 33.1 31.4 26.2 38.4 36.9 38.2 40.9 39.8 39 37.2 39.9 41.2 36.7 34.4 29.7 33.4 33.1 32.6 34.8 33.3 32.6 34.3 36.6 35.9 29.6 28.2 22.7 0 10 20 30 40 50 2007 2008 2009 2010 2011 2012 2013 2014 2015 2016 2017 2018 P e rc e n ta g e ( a g e s ta n d a rd iz e d ) ( % ) Survey year
Total Men Women
Figure 2. Trends in the proportion of consuming more than 500g of vegetables and fruits per day, 2007-2018
29.3 11.1 14.2 15.4 28.5 44.0 35.7 32.7 12.6 15.5 18.5 32.7 47.6 42.2 25.9 9.6 12.8 11.9 24.1 40.5 30.9 0 10 20 30 40 50 6+ 6-11 12-18 19-29 30-49 50-64 65+ P e rc e n ta g e ( % ) Age group
Total Men Women
Figure 3. Proportion of consuming more than 500g of vegetables and fruits per day, 2018
* Daily intake of more than 500g of vegetables and fruits: daily intake of fruits and vegetables was 500g or more among those aged 6 and over †The mean in Figure 2 was calculated using the direct standardization method based on a 2005 population projection.
Source: Korea Health Statistics 2018, Korea National Health and Nutrition Examination Survey, http://knhanes.cdc.go.kr/ Reportedby: Division of Chronic Disease Control, Korea Centers for disease Control and Prevention