Optimal Baseline Prostate-specific
Antigen level to Distinguish the Risk
of Prostate Cancer in Healthy Men
between 40 and 69 Years of Age
Kyung Kgi Park
Department of Medicine
<Title page>
Optimal Baseline Prostate-specific
Antigen level to Distinguish the Risk
of Prostate Cancer in Healthy Men
between 40 and 69 Years of Age
Directed by Professor Young Deuk Choi
The Master's Thesis
submitted to the Department of Medicine,
the Graduate School of Yonsei University
in partial fulfillment of the requirements for the degree
of Master of Medicine
Kyung Kgi Park
December 2010
This certifies that the Master's Thesis of
Kyung Kgi Park is approved.
---Thesis Supervisor : Young Deuk Choi
---Thesis Committee Member: Byung Ha Chung
---Thesis Committee Member: Hei Cheul Jeung
The Graduate School
Yonsei University
ACKNOWLEDGEMENTS
I would like to give my great thanks to Prof. Young Deuk
Choi (Department of Urology, Yonsei University College of
Medicine) for his guidance to my research work. I also thank
Prof. Byung Ha Chung (Department of Urology, Yonsei
University College of Medicine) and Prof. Hei-Cheul Jeung
(Department of Internal medicine, Yonsei University College
of Medicine) for their invaluable discussion and
encouragements. I also thank every collegues of urologic
department in Gangnam severance hospital for their technical
and emotional supports. Most of all, This thesis would not
have been possible unless my parents and parents-in-law did
not financially support to me. I really appreciate my parents.
Finally, I owe my deepest gratitude to my wife, Yune Ah Lee
for her endurance and patience. I will sincerely love her.
<TABLE OF CONTENTS>
...
ABSTRACT
1
...
I. INTRODUCTION
2
...
II. MATERIALS AND METHODS
4
...
1. Study Population
4
...
2. Assessment of risk
4
...
3. PSA testing
4
...
4. Statistical analysis
5
...
III. RESULTS
6
...
IV. DISCUSSION
10
...
V. CONCLUSION
13
...
REFERENCES
14
LIST OF FIGURES
Figure 1. Cumulative prostate cancer-free survival according
to the age and baseline PSA percentile ··· 7
Figure 2. Trend of area under curve according to a baseline
PSA cut-off value greater than the median PSA level.·· 8
LIST OF TABLES
Table 1. Characteristics of baseline PSA study cohorts ··· 6
Table 2.
A comparison of risk of developing prostate cancer in
Korean men with baseline PSA values by age··· 9
ABSTRACT
Optimal Baseline Prostate-specific Antigen level to Distinguish the Risk
of Prostate Cancer in Healthy Men between 40 and 69 Years of Age
Kyung Kgi Park
Department of Medicine
The Graduate School, Yonsei University
(Directed by Professor Young Deuk Choi)
Objectives: To evaluated the optimal baseline PSA level at different ages to determine the risk of CaP.
Patients and Methods: We analyzed a large cohort of 6,651 Korean men in age 40-69, The serum PSA levels for the men were measured at one institute from 2000 to 2004 and were determined to be between 0-4 ng/ml. Patients were divided into 4 groups of 25th-percentile intervals, based on initial PSA level. Of these, the group which has a increased risk were selected, and the optimal value was determined by the maximal AUC from the receiver-operating characteristic curve (ROC) within the selected group. The risk of CaP diagnosis was evaluated by Cox regression.
Results: The mean follow-up period was 8.3 years. The optimal PSA values to
distinguish the risk of CaP were 2.0ng/ml for 50- to 59-year-olds and 1.5ng/ml for 60- to 69-year-olds. Patients with a baseline PSA level greater than the optimal value had a 33.15 and 24.41-fold increase in the age-adjusted prostate cancer risk, respectively. Conclusions: Baseline measurements of PSA should begin at the age of 50.
Furthermore, the optimal cutoff values depend on the age.
Impact: Optimal PSA cutoff value to distinguish the risk of prostate cancer was different depending on the incidence of prostate cancer of ages.
---Key words : Prostate-specific Antigen, Screening, Prostate Neoplasm, Asian Continental Ancestry Group
Optimal Baseline Prostate-specific Antigen level to Distinguish the Risk
of Prostate Cancer in Healthy Men between 40 and 69 Years of Age
Kyung Kgi Park
Department of Medicine
The Graduate School, Yonsei University
(Directed by Professor Young Deuk Choi)
I. INTRODUCTION
The American Urological Association (AUA) and American Cancer Society (ACS) recommend that prostate cancer screening begin at 50 years of age for men with an average risk of prostate cancer (CaP) and even earlier for men with a higher risk for prostate cancer due to risk factors, such as a positive family history in a first-degree relative or an African American heritage. Prostate cancer screening is performed for the early detection of curable prostate cancer. Prostate cancer deaths are seen in men as young as 35 to 44 years of age, according to Surveillance, Epidemiology, and End Results (SEER) data. These deaths indicate that men younger than the recommended screening age of the AUA and ACS for the early detection of prostate cancer can also be affected by the disease. Therefore, depending on the risk for developing prostate cancer, the prevention and detection strategy should be adjusted to include younger men. To assess the risk of prostate cancer, baseline prostate-specific antigen (PSA) levels are used. In 2005, Whittemore
and colleagues1 reported that PSA levels in young adults were useful
predictors of CaP detection. Loeb et al.2, reported that the baseline PSA levels
for men in their 40s were a stronger predictor of CaP risk than ethnicity, family history, or digital rectal examination findings. Ultimately, the NCCN (National Comprehensive Cancer Network) recommended a baseline PSA test for all men, starting at 40 years of age, in order to assess the risk for CaP. It has been determined that PSA level distributions differ based on ethnicity and age 3-5. Therefore, research should be conducted taking into account ethnic
differences.
Based on healthy-screened Korean men with PSA levels between 0-4 ng/ml, we assessed the optimal baseline PSA levels for the prediction of the risk of developing prostate cancer in Korean men.
II. MATERIALS AND METHODS 1. Study Population
This study was approved by our institutional review board. Between January 2000 and July 2004, a total of 6,651 men between the ages of 40 and 69, with baseline PSA levels between 0-4 ng/ml during routine health check ups, were enrolled in the study. Patients who had a previous diagnosis of CaP, a history of prostate surgery, or who had received 5-alpha reductase inhibitors within three months were excluded from the study. In July 2009, cases of CaP in enrolled patients were identified using data available from the Korean National Health Insurance Corporation (NHIC) website, which links to the Korean Severe Patient Registry. This registry includes data for over 99% of all cancer cases diagnosed in Korea6. Of our total study sample of 6,651 men, 17
died due to diseases other than prostate cancer during the study period. 2. Assessment of risk
Patients were divided into 4 groups at 25th percentile intervals based on initial PSA. Of these, the group which has a increased risk was selected and the optimal PSA value was determined using the maximal area under curve (AUC) by receiver-operating characteristic curve (ROC) within the selected group. The risk of developing prostate cancer in the enrolled men was studied based on the optimal PSA value. In this analysis, when more than one PSA measurement was available for a subject within an age decade, the earliest measurement was used as the baseline PSA level for determining risk. 3. PSA testing
Serum PSA levels were measured using an Elecsys 170 assay (Roche Diagnostics, Mannheim, Germany). Vacutainer tubes were used (Becton Dickinson, Oxford, UK) for blood collection, and the specimen was centrifuged after venipuncture and collection. After centrifugation, the specimens were immediately frozen at -70°C and were assessed for PSA within three days.
4. Statistical analysis
All statistical tests were two-sided. A p-value < 0.05 was considered to be statistically significant (SAS software, version 9.1). A Kaplan-Meier survival analysis was performed to estimate prostate cancer-free probability, with time considered as a function of the baseline PSA level. Subjects without cancer were censored at death or in July 2009. A log-rank statistical test was used to compare the Kaplan-Meier survival curves among the PSA groups.
A Cox proportional hazards regression model was used to examine the long-term relationship between baseline PSA level and prostate cancer risk. Comparison of the performance of each Cox model was calculated by C statistic (area under the ROC curve). The Hazard ratio (HR) and 95% confidence intervals were estimated using the Cox regression model, with a PSA level lower than the cutoff value treated as the reference group.
III. RESULTS
At baseline, the patients had a mean age of 50 years and a mean PSA value of 0.83 ng/ ml. The median PSA levels were 0.72, 0.81, and 0.93 ng/ml, and the third quartile PSA levels were 1.08, 1.23, and 1.51 ng/ml for men in their 40s, 50’s, and 60’s, respectively. The mean follow-up period was 8.3 years. Prostate cancer was detected in 27 of the 6,651 subjects. After initial PSA measurement, prostate cancer was discovered after at least 2.2 years in men in their 50’s and 2.7 years in men in their 60’s (Table 1).
Table 1. Characteristics of baseline PSA study cohorts.
When all subjects were classified into 4 groups based on 25th percentile intervals of baseline PSA level, the risk of prostate cancer was significantly increased in men with a baseline PSA level of more than the 75th percentile. However, men in their 40s did not have a significantly increased risk of prostate cancer (Figure 1).
Figure 1. Cumulative prostate cancer-free survival according to the age and baseline PSA percentile
Survival curves for men aged (A) 40 to 69.9 years, (B) 40 to 49.9 years, (C) 50 to 59.9 years and (D) 60 to 69.9 years. Markers represent prostate cancer and sensored cases. With time, prostate cancer incidence increased significantly in men with a baseline PSA more than the 75th percentile (reverse triangle), except for men in their 40s (log-rank test for trend)
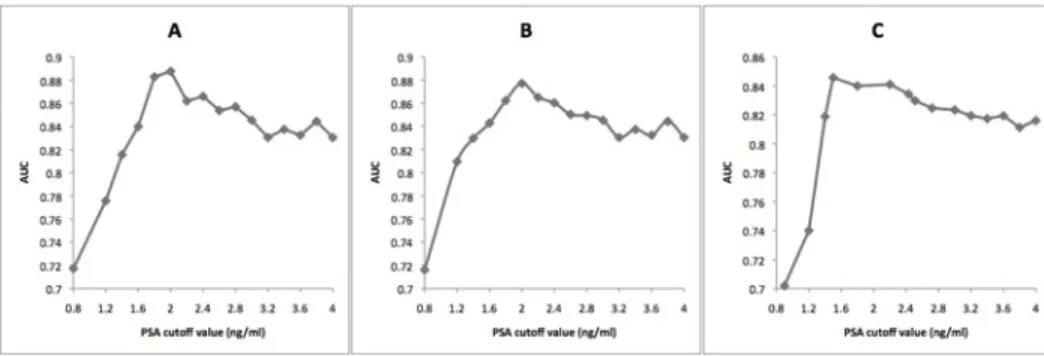
greatest sensitivity and specificity were 2.0ng/ml (93 percentile) for men in their 50’s and 1.5ng/ml (75 percentile) for men in their 60’s (Figure 2).
Figure 2. Trend of area under curve according to a baseline PSA cut-off value greater than the median PSA level.
AUC: area under curve, PSA: prostate-specific antigen, A: group of 50- to 69-year-olds, B: 50- to 59-year-69-year-olds, C: 60- to 69-year-olds.
As compared with the group with a baseline PSA level less than the cut-off value, the group with a PSA level higher than the cut-off value had a 33.15-fold increased risk for diagnosis of CaP in their 50’s (p < 0.0001) and 24.41-fold increased risk in their 60’s (p = 0.03). The age-adjusted CaP hazard ratio was also significantly increased 30.8-fold for men in their 50’s and 24.1-fold for men in their 60’s.
However, when the cut-off value was set at the median baseline PSA, the risk of CaP was 14.2-fold increased for men in their 50’s (p = 0.01) and 8.3-fold higher for men in their 60’s (p = 0.04) (Table 2).
Table 2. A comparison of risk of developing prostate cancer in Korean men with baseline PSA values by age.
Age PSA cutoff level
(ng/ml) HR† (95% CI) P (years) PSA cutoff level (ng/ml) HR† (95% CI) P
50-59 0.81* 14.22 (1.73-100.61) 0.01 50-59 1.2‡ 20.46 (4.41-87.03) <0.0001 50-59 2 33.15 (9.76-97.97) <0.0001 50-59 2.5 28.22 (9.00-71.78) <0.0001 50-59 3 27.45 (8,67-68.87) <0.0001 60-69 0.93* 8.30 (1.01-65.87) 0.04 60-69 1.5‡ 24.41 (3.03-196.58) 0.03 60-69 2 22.27 (2.85-185.14) 0.002 60-69 2.5 18.13 (4.80-68.48) <0.0001 60-69 3.5 9.99 (2.44-40.25)) 0.001 PSA: prostate-specific antigen, HR: hazard ratio, CI: confidence interval * : median baseline PSA value, ‡ : 75th percentile of baseline PSA value
† :HR estimated by Cox regression model for comparisons with the reference group (lower than cut-off).
IV. DISCUSSION
Based on our results, the median baseline PSA levels were 0.72 ng/ml, 0.81 ng/ml, and 0.93 ng/ml for men in their 40s, 50’s, and 60’s, respectively. These results are similar to those of previous studies 3,4. To estimate the risk of prostate cancer, the use of the
baseline PSA level is useful7. Therefore, we evaluated the risk according to the
baseline PSA. In men over the age of 50, the group with a baseline PSA higher than the 75th percentile had a significantly different risk, as compared to their age-specific lowest quartile baseline PSA level (Figure 1A). PSA level is also used as a screening tool to detect prostate cancer. Most diagnostic tools have cut-off points for maximal specificity and sensitivity. Therefore, it was important to determine the PSA value with the maximal AUC according to the receiver-operating characteristic curve. When the data were evaluated for men in their 50’s, and, with regard to the median
baseline PSA, there was not sufficient area under curve to provide a cut-off value. At this point, the AUC was approximately 0.7.
Ultimately, the optimal baseline cut-off PSA values for determining the risk of prostate cancer were 2.0ng/ml and 1.5ng/ml for men in their 50’s and 60’s, respectively. The cut-off value for men in their 50’s was lower than that for men in their 60’s. This difference is likely due to the lower rate of developing CaP in younger men in this study. If the overall incidence of CaP increases, the age-specific cut-off value of baseline PSA may decrease, as has been observed in statistic results based on Western populations8.
Upon reviewing the results of similar studies, we found that several authors reported that the median baseline PSA was used as a cut-off value for risk stratification in Western populations. They reported a dozen-fold increased risk of CaP diagnosis 9,10.
However, the authors did not evaluate the lowest and highest quartile value of 10
baseline PSA. Therefore, it is unknown which quartile had the greater affect. Tang et al. recently reported a 1.5 ng/ml cut-off value for estimating the risk of
developing prostate cancer, which was not the median PSA value11. However, the
authors adjusted their subjects by age, but did not stratify by age, as we did in our results. If the study had examined the subjects divided by age decade, the results might have been different because the PSA level used to estimate prostate cancer in younger ages is quite different from that used in older ages. And progression rates also differ with ages. Especially in Koreans, the PSA progression curve rapidly increases, starting at age 50, unlike the steady progression pattern in patients aged 40 or younger3.
Wright et al.12 also reported that the baseline PSA levels reflect the long-term risk of
prostate enlargement. But the cohort size of that study was too small to produce a meaningful cutoff level.
Unlike other studies, our study did not reveal a significant difference in the risk of prostate cancer among the 4 quartile groups at ages 40s. This is probably because of the low incidence of prostate cancer in Korean men.
According to the Surveillance, Epidemiology, and End Results data, CaP deaths occur in North American men between the ages of 35 and 4413. Similarly, CaP deaths are
also beginning to occur in Korean men younger than 50, and there is an increasing trend toward even younger men dying from CaP14. The age-adjusted incidence rate is
159.3 per 100,000 men per year in the US population,13 as opposed to 12.7 in the
Korean population15. This ethnicity-based difference may be attributed to two factors
discussed below. First, a relatively low overall CaP incidence rate in Korean men may lead to a low incidence at age 40 because prostate cancer requires time to manifest. Therefore, if the overall incidence is reduced, prostate cancer occurrences may be
reduced in younger age groups. Second, Korean men ultimately may not have a risk of CaP because of a lack of gene for familial prostate cancer and/or lack of African heritage, as compared to individuals in Western populations16, both of which are
factors associated with the development of prostate cancer at earlier ages. Based on these results, baseline PSA testing beginning at age 40 is not yet an effective
screening strategy for Korean men. We suggest that baseline screening should begin at age 50 for Korean men. Furthermore, we recommend that the screening strategy utilizes different baseline PSA levels for cut-off values in men in their 50’s and 60’s. There were some limitations to this study. First, subjects of the study were participants
of a routine health check-up. Therefore, these results might not be the same as those seen in the normal population. Second, digital rectal examination (DRE) was not included in the screening procedure. When PSA values are low, a positive DRE result is associated with CaP in only 3% to 5% of the cases 17,18. Vis et al. 19 calculated that
one would have to perform 289 DREs to find one case of clinically significant CaP in patients with a PSA level less than 3.0 ng/ml. Therefore, we assumed that the omission of DRE did not greatly affect our results.
Third, the presence of CaP was not confirmed by a pathologic report based on prostate biopsy, but rather from data from a cancer registry maintained by NHIC. Therefore, we were unable to access complete pathologic information for all cohort members.
V. CONCLUSION
Baseline PSA values are useful tools for determining the risk of developing prostate cancer in Korean men between the ages of 50 and 60. Appropriate follow-up
strategies should be determined not only according to optimal baseline PSA level, but also according to patient age. We recommend that men between the ages of 50 and 60 should have their baseline PSA levels measured, and they should visit their physician according to their risk category.
REFERENCES