Long-Term Care Insurance and Health Care
Financing of the Korean National Health
Insurance Program
Shin, Jaeun
(KDI School of Public Policy and Management)
This paper is to evaluate how the new element of public health insurance for long-term care services, the Long-Term Care Insurance (LTCI), financially affects the preexisting National Health Insurance (NHI) program. We focus on examining the effects of the LTCI benefit payment on the NHI expenditure and service use of the elderly members. Using longitudinal data of 245 municipalities of South Korea for the period of 2008-2010, we conduct the fixed-effects panel estimation and find the statistically significant positive association of the LTCI spending with the NHI benefit payment for the elderly: additional 7,263 million KRW spending in the NHI program for one percent increase in the LTCI spending on the elderly. Findings further show that the intensity of the NHI service use among the elderly is positively associated with the LTCI benefit payment. It suggests that coordinated management across acute care service delivery and long-term care service provision is warranted to achieve cost effectiveness of the NHI program with the support of the LTCI program.
Keywords: National Health Insurance, Long-term Care Insurance, South Korea, Population Ageing, Health Care Financing
This research is financially supported by the KDI School Research Grant. I thank Professor Stephan Haggard at University of California, San Diego for his insight and encouragement. This paper is also indebted to participants in the KDI School research seminar series and in the 89th Annual Conference of the Western Economic Association International for helpful comments. All errors are mine. ■ 투고일: 2014.10.29 ■ 수정일: 2014.12.22 ■ 게재확정일: 2014.12.30
Ⅰ. Introduction
1)1. Long-Term Care Insurance:
A Challenging Approach to Population Ageing
The principal component of the Korean health care system is the National Health Insurance (NHI) program. Over its three decades of operation, the NHI has gradually expanded its benefits to cover a greater variety of services (outpatient care, inpatient stay, pharmaceuticals, and selective Korean traditional medicines), and a larger set of costly services such as CT scan, MRI, and cancer treatment. The long-term care benefit, however, has been excluded from the NHI benefit package.
In 2008, the Long-Term Care Insurance (LTCI) program was launched to provide the long-term care benefit for the elderly. The LTCI program is designated to improve access to nursing home care and various home care services among the physically dependent elderly population (National Health Insurance Corporation, 2010). It was one of the major policy responses of the Korean government to face with rapid population ageing and the weakening informal care mechanism for the elderly. From the population health perspective, it is a desirable public action to proactively respond to the needs of the ageing society. The LTCI initiative is an approach of internalizing the informal unpaid care by family members into the framework of formal paid care of which costs will be shared by all members of society.
Although the impending need for social protection of any kind for the aging population was indisputable, the introduction of this new public health insurance program was an issue of intense political debate in two aspects. First, additional contributions required to fund the LTCI program formed a public discontent among both employers and employees. A collective financing system for the LTCI program was the central ground of political tensions across generations since the young
1) This paper is written in English for the presentation at the 89th Annual Conference of the Western
working population is mandated to subsidize the retired elderly population. Secondly, the fiscal sustainability of the LTCI was uncertain and controversial. Since late 1990s, the NHI program has been under heavy pressure to stay financially viable and this fight against the rapid increase in total health care spending seems unlikely to subdue in the near future due to population ageing2). This experience comes to a question whether the Korean society can afford another public health insurance program. Due to contribution-based financing and universality of benefit coverage similar to the NHI program, the LTCI program is barely exempt from the same challenge of financial hardship to serve the elderly beneficiaries.
Related to this general concern on fiscal viability of the entire public health insurance system, this paper proposes a specific question on the relationship between the NHI and LTCI programs: how the LTCI program financially reshapes the NHI program. Proponents of the LTCI addition expect that the long-term care service may help maintain and improve health status of the elderly population so that less intense acute care services will be demanded than otherwise. This implies the cost saving in the NHI program for the elderly and the lesser burden on the contributing population (Kim et al., 2010; Lee, 2010; Kwon, 2011). The opposite scenario is equally possible, however: the promotion of the LTCI program will inform the elderly of the accessible and affordable LTC services they can avail through the LTCI benefit. In this process, the elderly may identify the previously unrecognized need for the NHI services, which will lead to greater NHI benefit payments for the elderly. In spite of the eligibility screening process, the LTCI benefit is in principle a public subsidy program to the most disadvantaged group of the elderly, enabling and encouraging them to seek long-term care services. This may stimulate the use of other health care services by educating them about health care needs and the NHI benefits they are entitled to claim.
2) Kim (2004) estimates that additional one year life expectancy of the elderly requires 4,305.3 billion
KRW of the NHI payment, suggesting cost inefficiency of the NHI program and the need of securing additional financing source for the elderly population.
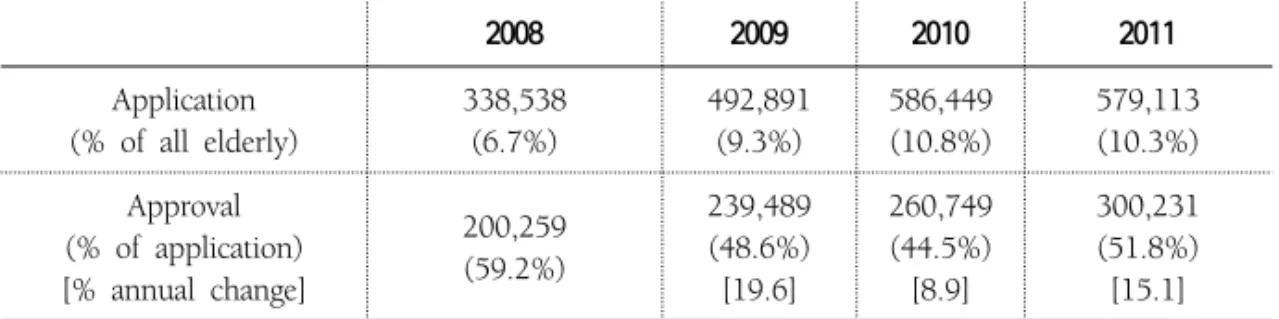
The LTCI program, unlike the NHI program, operates the eligibility selection process. The benefit of the LTCI is granted only for those applied and approved. As shown in Table 1, the number of applicants has consistently risen since the launch of the LTCI program - 6.5% to 10.3% of all eligible elderly. But the approval rate remains around 50%. This hints of the possibility of excluding the marginally needy elderly. As the eligibility criteria are under the control of the NHIS, the NHIS may adjust the approval guidelines as a handy tactic to manage the LTCI financing3) . If the NHIS attempts to use the eligibility assessment process merely for the purpose of avoiding financial deficits, the LTCI program may survive the projected financial turmoil, but fail in adequately serving the ageing Korean population. For the LTCI program truly functioning as a social protection, both the generosity in eligibility and the fiscal stability of this program should be assured. It is an overwhelming economic and political agenda for the NHIS and the Korean government.
Table 1. Eligibility of the LTCI Benefit, 2008-2011 (for person of aged 65 or more)
2008 2009 2010 2011 Application (% of all elderly) 338,538 (6.7%) 492,891 (9.3%) 586,449 (10.8%) 579,113 (10.3%) Approval (% of application) [% annual change] 200,259 (59.2%) 239,489 (48.6%) [19.6] 260,749 (44.5%) [8.9] 300,231 (51.8%) [15.1] Note: The 2008 data is for the half-year operation of the LTCI program (July to December of 2008).
3) Currently, the minimum score entitling applicants with the LTCI benefit is 53. According to the
evaluation score, applicants are classified into Class 1 (95 or higher), Class 2 (75 to 94) or Class 3 (53 to 74) (National Health Insurance Corporation, 2010). Higher score means severity of LTC needs. If they score less than 53, they are not eligible for any LTCI benefit. Class 3 cut-off is revised from 55 to 53 in July 1, 2012 to grant the marginal elderly with home care benefit. This revision shows that the benefit entitlement approval cut-off score can be arbitrarily adjusted to meet the financial ends.
2. Demographic Challenge for
South Korean Health Care System
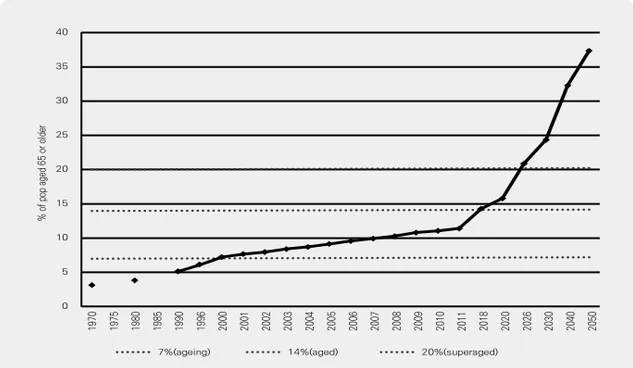
Rapid population ageing in South Korea has raised a concern of a long-term health cost risk in the Korean health care system (Kim, 2004; Tchoe & Nam, 2008; Cho et al., 2004). As shown in Figure 1, the percentage of the elderly (defined as aged 65 or more) in the Korean population has steadily increased since 1970. This trend is accelerated over time, pushing Korea into an ageing society by 2000, to an aged society by 2017 and to a super-aged society by 20264), which leaves only one decade for the Korean society to prepare for this unprecedented demographic structure.
Figure 1. Trend of Population Ageing in Korea (1970-2050)
0 197 0 197 5 198 0 198 5 199 0 199 6 200 0 200 1 200 2 200 3 200 4 200 5 200 6 200 7 200 8 200 9 201 0 201 1 201 8 202 0 202 6 203 0 204 0 205 0 5 10 15 20 25 30 35 40 7%(ageing) % o f p op a ge d 65 o r o ld er 14%(aged) 20%(superaged)
Source: National Statistical Office (NSO) of Korea, 2011.
4) The United Nations (UN) categorizes the degree of population ageing in a society based on the
percentage of the elderly persons of aged 65 or older in the population as follows: ageing society (over 7%), aged society (over 14%) and super-aged society (over 20%). The age structure prospect of the Korean population is referred to the Future Population Projection Report 2010 by the Korean Statistical Information Service (KOSIS).
This rapid population ageing in Korea is attributed to the retirement of thick cohort of baby boomers and the world-lowest level of fertility rates. Figure 2 is a snapshot of the consequences of these two factors. The child dependency ratio5) declined from 36.9% in 1990 to 29.4% in 2000 and further in 2010 it is only 22.2%. By contrast, the aged dependency ratio was 7.4% in 1990, reached to 10.1% in 2000 (36.5% increase from 1990), and to 15.0% in 2010 (48.5% increase from 2000). This particular age structure poses many economic distortions and policy challenges such as loss in quantity and productivity of the labor force and the resulting slow-down in economic growth. The population ageing presented in Figure 1 and Figure 2 is the focal point of substantial policy debate on the sustainability of the Korean economy.
Figure 2. Changes in Dependency Ratio in Korea (1970-2050)
0.0 197 0 197 5 198 0 198 5 199 0 199 6 200 0 200 1 200 2 200 3 200 4 200 5 200 6 200 7 200 8 200 9 201 0 201 1 201 8 202 0 202 6 203 0 204 0 205 0 D epn den cy R at io 5.0 10.0 15.0 20.0 25.0 30.0 35.0 40.0 45.0 50.0 55.0 60.0 65.0 70.0 75.0 80.0 85.0 90.0 95.0
Dependency Ratio Child DR Aged DR
Source: NSO of Korea, 2011 (Author’s calculation)
5) Dependency ratio is the ratio of dependents (either those of aged under 15 or those of aged
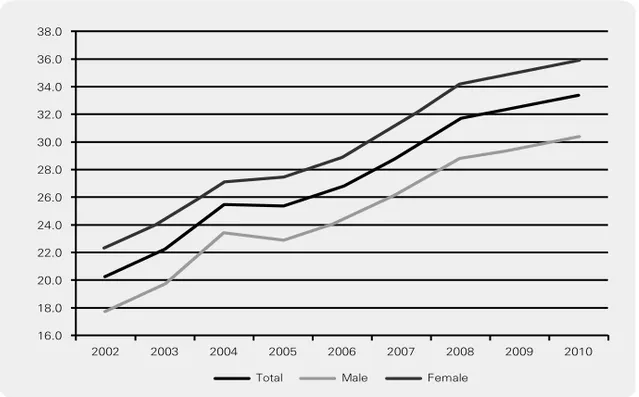
Considering the characteristics of the elderly, one of the most pressing policy issues would be how to financially sustain health care costs of these physically and mentally vulnerable group of the population. As the elderly are entirely retired or only partially active in the labor market, their contributions to tax revenue and to social security account are marginal. They, however, are likely to undergo various and complex health problems, which are costly to the national health care system. Figure 3 illustrates the share of the National Health Insurance (NHI) benefit payments for the elderly during the period of 2002-2010. The NHI benefit payment for elderly members was 20.2% of total payments in 2002 and increased to 33.4% in 2010. The total number of the elderly population is certain to mount in coming decades due to the effect of the baby boom generation. Consequently, the NHI benefit payment share for this group is likely to stay on its linear growth path as shown in Figure 3.
Figure 3. The NHI benefit payment for the elderly members (Korea, 2002-2010)
[Unit: % of total NHI benefit for all ages]
16.0
Total Male Female
2002 2003 2004 2005 2006 2007 2008 2009 2010 18.0 20.0 22.0 24.0 26.0 28.0 30.0 32.0 34.0 36.0 38.0
Figure 4 further indicates that the increase in total health care costs is more than proportional to the growth of the elderly members in the NHI system. In 2010, the annual average NHI benefit payment per person was KRW 213,445 for the 20-24 age group, but for age 50-54, it triples to KRW 740,988. The figures are starkly augmented for the older groups: KRW 1,685,560 for the 65-69 age group and KRW 2,326,361 for the 80-85 age group. Epidemiologically, the elderly population is characterized by the prevalence of non-lethal chronic illness such as diabetes, after-stroke disabilities, hypertension, heart diseases and Alzheimer’s. These health problems depend on continual care with little chance of complete cure and of rewarding society back with productivity enhancement or financial contributions. In sum, population ageing in Korea is a major threat to the fiscal security of the NHI system by bringing in more and more costly members.
Figure 4. NHI Benefit Payment by Age Group (Unit: KRW1000)
0 583 739 382 214 202 213 287 350 402 0
Annual Average NHI Benefit Payment per Person (2010)
350 539 741 985 1,272 1,686 2,010 2,2272,326 2,277 1~4 5~9 10~1 4 15~1 9 20~2 4 25~2 9 30~3 4 35~3 9 40~4 4 45~4 9 50~5 4 55~5 9 60~6 4 65~6 9 70~7 4 75~7 9 80~8 4 85 or olde r 500 1000 1500 2000 2500
3. Structure and Financing of LTCI (2008-2011)
The burden of providing necessary care for the elderly is mostly associated with demand for long-term care. It has been a cultural tradition in Korea that informal care by family members, primarily the first-born son (and his spouse) serves the long-term care needs of their ageing parents. This mechanism, however, is no longer reliable because of lower fertility, higher female labor force participation, stronger propensity of geographic and social mobility among the young generation, and the fragmentatin of the family structure. As a result, the informal care provided by household needs to be complemented by the formal care, the cost of which be shared by the working population as a form of social assistance.
Effective in July 2008, the Long-Term Care Insurance (LTCI) program, the sister element of the NHI system, provides benefits for nursing home care and home care services. While the existing NHI program is for all citizens without eligibility selection, the LTCI benefit is primarily targeted for those over 65.6) Upon the application for eligibility status, the LTCI administration officer evaluates the need of long-term care of the applicant based on their physical limitations, mental capacity and any specific demand for nursing or rehabilitation services. The LTCI benefit is available only for those approved in this evaluation process. As shown in Table 1, the number of applications increased from 6.7% to 10.3% of the total elderly population during 2008-2011. The approval rate started as 59.2% in the first year of the LTCI program (in 2008) but later dropped to 51.8% in 2011.
Financing of the LTCI program adopts a similar format of the NHI program. In the NHI program, the fixed contribution rate is applied to payroll of the employed group or to the assessed income of the self-employed group. The total amount of the LTCI contribution is determined as the LTCI contribution rate applied to total NHI contribution amount.
6) People of age under 65 may be eligible for the LTCI benefit if they are diagnosed of prelisted
age-related diseases such as paralysis, dementia, Parkinson’s and Alzheimer’s, and unableto carry out daily activities without help (Kim, 2004).
Table 2. Financing of the LTCI Program, 2008-2011
Panel 1. Contribution by Members
2008 2009 2010 2011
The NHI contribution
(% of payroll) 5.08 5.08 5.33 5.647)
The LTCI contribution
(% of the NHI contribution) 4.05 4.78 6.55 6.55 LTCI contribution per month (in KRW) per employed insured - 3,238 4,700 5,383 per self-employed household - 2,980 4,400 4,712
Panel 2. Revenue – Expenditure State
2008 2009 2010 2011 Total LTC contribution (in million KRW) Imposition - 1,199,551 1,831,555 2,142,332 Collection - 1,161,242 1,785,925 2,106,938 Collection rate (%) - 96.8% 97.5% 98.3% Total revenue (A1)
(in million KRW) 868,975 2,084,929 2,877,740 3,263,144 Total contribution (A2) 477,011 1,199,551 1,831,555 2,142,332 Total benefit payment (B) 431,414 1,746,732 2,415,263 2,602,664 Total expenditure (C) 554,901 1,908,463 2,589,135 2,787,757 Balance (A1–C) 314,074 176,467 288,605 475,387 B/A1 (%) [Average] 49.9% 84.6% 85.2% 77.6% [79.1%] B/A2 (%) [Average] 90.4% 145.6% 131.9% 121.5% [127.4%] C/A1 (%) [Average] 63.9% 91.5% 90.0% 82.0% [86.2%] Notes: The NHIS determines the contribution rate for the NHI program and LTCI program separately.
The total amount of the NHI contribution is defined by (the NHI contribution rate*income) and the LTCI contribution is calculated by (the LTCI contribution rate* the amount of NHI contribution). The 2008 data of the LTCI program is for the half-year operation of the LTCI program (July to December of 2008).
Source: NHIS Statistical Yearbook 2008-2010. Figures in 2008 not reported due to data unavailability.
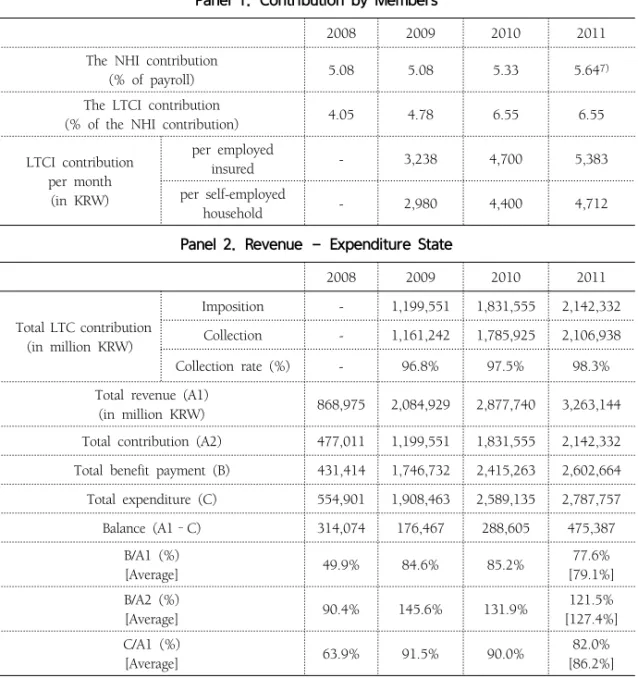
Panel 1 of Table 2 shows the structure of the LTCI contribution rate during 2008-2011. Every fiscal year, the NHIS announces the contribution rate for the NHI program and LTCI program separately. Continual increase in both contribution rates is noted, and average monthly contribution per insured was KRW 5,383 in 2011.
The aggregate fiscal state of the LTCI program is reported in Panel 2 of Table 2. The contribution collection rate improved from 96.8% in 2009 to 98.3% in 2011. This new program seems to have little administrative problem in collecting contributions as the NHIS already established this process through a decade long experience. The overall financial status of the LTCI program looks fairly strong, providing benefits to the expanding number of beneficiaries shown in Table 1 (49.9% increase from 2008 to 2011) yet still running a surplus in all years from 2008 to 2011. During 2008-2012, the ratio of benefits to total revenue stays on average at 79.1% and the ratio of benefit payment to total contribution marks at 127.4%. Both figures indicate that the LTCI contribution effectively supports the benefits for those in need, and with subsidies from the general taxation of central and local governments, the LTCI program manages to be financially stable at the moment.
As the program is virtually new-born, there are few empirical studies on how the LTCI program interplays with the NHI program in paying for the health care of the elderly population. Whether the LTCI program alleviates or aggravates the burden of the NHI program in paying for the elderly members is the main question of this paper. Using the aggregate statistics of the NHI and LTCI programs across 245 municipals (city, country, and district) for the period of 2008-2010, we empirically assess effects of the LTCI program on the NHI financing. The remainder of this paper is organized as follows. Section II describes the estimation method to investigate how LTCI benefit payment affects total service use and costs of the elderly NHI members. Section III presents findings and Section IV concludes with policy implications and suggestions for further studies.
Ⅱ. Methods
1. Data
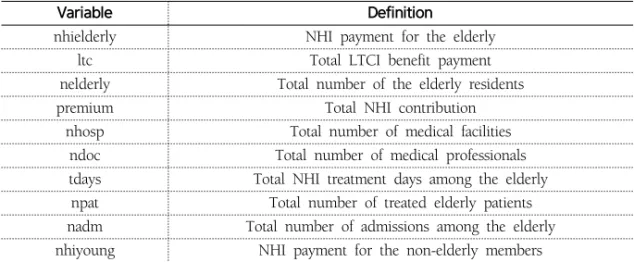
For the empirical analysis, we use data from the National Health Insurance Corporation (NHIS) Statistical Yearbook and the Long-Term Care Insurance Statistical Yearbook for 2008-2010. We merge the aggregate NHI statistics with the LTCI information for 245 municipalities of Korea. The cross-sectional unit is identified according to the administrative divisions of cities (Si), counties (Geun) and districts (Gu). Variable definitions are summarized in Table 3.
Table 3. Variable definitions
Variable Definition
nhielderly NHI payment for the elderly
ltc Total LTCI benefit payment
nelderly Total number of the elderly residents
premium Total NHI contribution
nhosp Total number of medical facilities ndoc Total number of medical professionals tdays Total NHI treatment days among the elderly npat Total number of treated elderly patients nadm Total number of admissions among the elderly nhiyoung NHI payment for the non-elderly members
2. Estimation Methodology
We conduct the multivariate ordinary least squares (OLS) estimations to meausre the interplay between the LTCI payment and the NHI payment for the elderly members. Our dependent variable is the logarithm of the NHI expenditure and service use among the elderly members, and the key explanatory variable is the logarithm of total LTCI benefit payment for the elderly. In the NHI expenditure
equation, we control for medical resource factors using total number of medical professionals and facilities, population factor using total number of the elderly residents, income factor using total amount of the NHI contributions, and health risk factor using the NHI service use measures and the NHI benefit payment for non-elderly beneficiaries (Sakong et al., 2011).
Estimates obtained from OLS method are potentially inconsistent due to unobserved region-specific heterogeneity. To deal with this empirical issue, we set up a one-way component panel fixed-effects models to average out the unobserved region-specific effect (Shin, 2012). The unobserved regions-specific effects are assumed to be time-invariant constant. The panel regression equation is written as follows:
it i it it it
LTCI
Z
u
NHI
)
=
α
+
β
⋅
log(
)
+
⋅
γ
+
μ
+
log(
where i is the index for regions (I=245) and t is time index (T=3). NHI indicates the NHI benefit payment and service use of the elderly members. LTCI denotes the expenditure of LTCI program for the elderly beneficiaries. The key coefficient measures the percentage effect of the LTCI benefit payment on the NHI outcomes. Z is the set of control variables. is the region-specific heterogeneity and is the idiosyncratic error term. We conduct the fixed-effects (FE) model because the assumption of no correlation between and explanatory variables required for the consistency of the random-effects (RE) estimator is tested invalid (Wooldridge, 2010).
Ⅲ. Findings
1. Descriptive Analysis
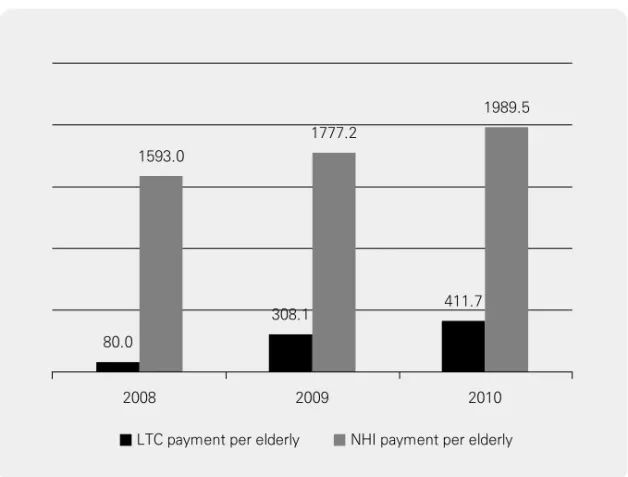
during 2008-2010. We observe a steady increase in the NHI payment per elderly from KRW 1.59 million to 1.99 million (annual growth of 11.6% and 11.9%, respectively). The LTC payment per elderly is relatively modest in magnitude (KRW 0.41 million in 2010) but it increases at a much faster rate (33.6% during 2009-2010).8) Unless the NHIS adjusts the eligibility conditions to limit the number of LTCI beneficiaries, the LTCI payment, both total and average, is predicted to grow further with population ageing.
Figure 5. Public Insurance Payment for the Elderly, 2008-2010 (Unit: KRW 1000)
LTC payment per elderly 2008
80.0
2009 2010
NHI payment per elderly 1593.0
308.1 1777.2
411.7 1989.5
Note: The 2008 data of the LTCI program is for the half-year period (July to December of 2008). Source: NHIS Statistical Yearbook, 2008-2010.
8) Substantial growth of LTCI payment during 2008-2009 (285.1% increase) may be attributed
to by the half-year operation of the LTCI program in 2008, thus calls for caution in the interpretation.
Figure 6. Relationship between NHI and LTCI Payments by Year, Unadjusted (2008-2010) 14 16 18 20 lo g( nh i) 10 12 14 16 18 log(ltc) 2008 15 16 17 18 19 lo g( nh i) 13 14 15 16 17 log(ltc) 2009 15 16 17 18 19 lo g( nh i) 13 14 15 16 17 18 log(ltc) 2010 0.867 0.945 0.868
Note: The 2008 data of the LTCI program is for the half-year period (July to December of 2008). Source: NHIS Statistical Yearbook, 2008-2010.
Figure 6 illustrates the bivariate correlation between NHI benefit payment and LTCI spending on the elderly by year. Strong association between two public insurance payments is found throughout the study period. This may reflect the higher health care needs and the larger elderly population size in a region which yield higher spending both in the NHI program and in the LTCI program, thus not necessarily indicate the causation of the LTCI spending on the NHI expenditure. It, yet, is worth to note that the observed relationship between two public health spendings has been stable, hinting no systemic change due to the addition and the full implementation of LTCI program.
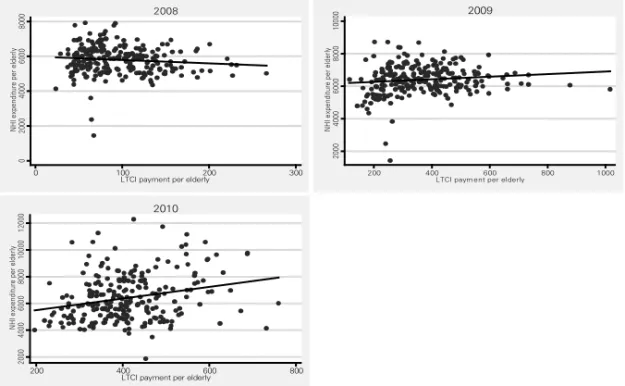
Figure 7. Relationship between NHI and LTCI Payments by Year, Per Elderly (2008-2010) 0 20 00 40 00 60 00 80 00 NH Ie xp en di tu re pe re ld er ly 0 100 200 300
LTCI payment per elderly 2008 20 00 40 00 60 00 80 00 10 00 0 NH Ie xp en di tu re pe r el de rly 200 400 600 800 1000
LTCI paym ent per elderly 2009 20 00 40 00 60 00 80 00 10 00 0 12 00 0 NH Ie xp en di tu re pe r el de rly 200 400 600 800
LTCI payment per elderly 2010
Note: The 2008 data of the LTCI program is for the half-year period (July to December of 2008). Source: NHIS Statistical Yearbook, 2008-2010.
When adjusted for the size of elderly population, the correlation becomes much weaker as shown in Figure 7. In 2008, the coefficient is -1.96 (p<0.1) implying the possible cost saving effect of the LTCI payment on the NHI expenditure. But the relationship is switched positive and statistically significant in the subsequent years (0.757, p<0.10 in 2009; 4.34, p<0.01 in 2010). Provided that the epidemilogical structure of the eldery residients in a region is likley to be stationary over time, this positive pattern implies that the LTCI program induces larger NHI payment for the elderly beneficiaries. This, on one hand, indicates that the elderly population has their health care needs of both acute and long-term care better supportded with the assistance of the LTCI program. On the other hand, it alarms that the NHIS and the general population should be prepared for the upcoming financial pressure to sustain the extended public programs.
2. Estimation Results
1) OLS estimation
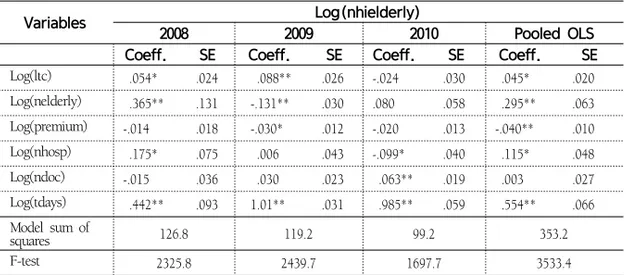
Results of OLS estimation are reported in Table 4. We find a statistically significant positive relationship between NHI payment and LTCI payments in 2008 and in 2009, but not in 2010. The magnitude of the effect is modest in 2008 (0.053%, p<0.05), larger in 2009 (0.088%, p<0.01), but negative insignificant in 2010 (-0.24%). This observed variation in the relationship between NHI and LTCI is partly attributed by the partial implementation of LTCI program in 2008 and the continual changes in the program operation in the following years. When pooled over the study period, the OLS estimate of the effect of the LTCI payment is 0.045% (p<.05).9)
Table 4. OLS Results: Impact of LTCI Expenditure on NHI Payment for the Elderly (By Year)
Variables Log(nhielderly)
2008 2009 2010 Pooled OLS
Coeff. SE Coeff. SE Coeff. SE Coeff. SE Log(ltc) .054* .024 .088** .026 -.024 .030 .045* .020 Log(nelderly) .365** .131 -.131** .030 .080 .058 .295** .063 Log(premium) -.014 .018 -.030* .012 -.020 .013 -.040** .010 Log(nhosp) .175* .075 .006 .043 -.099* .040 .115* .048 Log(ndoc) -.015 .036 .030 .023 .063** .019 .003 .027 Log(tdays) .442** .093 1.01** .031 .985** .059 .554** .066 Model sum of squares 126.8 119.2 99.2 353.2 F-test 2325.8 2439.7 1697.7 3533.4
Notes: Intercept is included. Robust standard errors are reported. * and ** indicate 5% and 1% statistical significance, respectively. The pooled OLS includes year dummies. The 2008 data of the LTCI program is for the half-year period (July to December of 2008).
Source: NHIS Statistical Yearbook 2008-2010.
9) In 2008, the LTCI data covers only half-year period from July to December of 2008. In order
to confirm the robustness of results to this data complexity, we repeat the pooled OLS estimation using the 2009 and 2010 data only. The estimated effect of the LTCI payment is 0.048 (p<0.05).
Variables Log(nhielderly)
(1) (2) (3) (4) (5)
Coeff. SE Coeff. SE Coeff. SE Coeff. SE Coeff. SE Log(ltc) .099** .024 .040** .005 .065** .005 .067** .015 .045** .006 Log(nelderly) .580** .021 -.021 .042 -.025 .039 -.020 .035 .522** .017 Log(premium) -.033 .026 -.024 .013 -.026 .013 -.019 .011 -.023 .016 Log(nhosp) -.050 .033 -.049* .021 -.058* .025 -.049* .019 -.038* .016 Log(ndoc) .089** .024 .080** .016 .087** .018 .073** .017 .053* .018 Log(tdays) -.007 .027 - - - - -.026 .014 - -Log(nadm) - - .979** .066 - - .996** .101 -
-As we control for the quantity of service use using total treatment days, the estimated positive coefficient suggests that the LTCI benefit leads to the net increase in the NHI payment when total amount of service provision for the elderly are fixed.
2) Panel Estimation
Table 5 presents results of the panel estimations. We try different sets of health status variables to capture potential endogeneity between the LTCI payment and the NHI payment – total number of patients (npat), total number of admissions (nadm), total treatment days (tdays) and total NHI expenditure for the non-elderly (nhiyoung). In model (4) where all of three measures for service use are included, the effect of LTCI payment is found as 0.067% (p<0.01). It implies that the 1% increase in the LTIC payment will induce the increase in the NHI payment by 7,263 million KRW (based on the 2010 figures). When the overall health condition in a region is controlled by total NHI spending for the non-elderly residents, the impact of the LTCI payment is found as 0.045% (p<0.01). Different model specifications seem responsible for variations in the magnitude of estimates (0.040%~0.099%). The positive relationship of the LTCI payment with the NHI expenditure on the elderly is, however, found solid across models
Table 5. Panel FE Model: The Impact of LTCI Expenditure on NHI Payment for the Elderly
Variables Log(nhielderly)
(1) (2) (3) (4) (5)
Coeff. SE Coeff. SE Coeff. SE Coeff. SE Coeff. SE
Log(npat) - - - - 1.01** .075 -.001 .102 -
-Log(nhiyoung) .561** .069
Model sum of
squares 15.25 15.87 15.76 15.88 15.48
F-test 1760.6 7897.8 2387.7 8768.4 1757.5
Notes: Intercept is included. * and ** indicate 5% and 1% statistical significance, respectively. Standard errors (SE) are calculated robust to clustering. 16 clusters are 7 metropolitan cities (Seoul, Busan, Daegu, Incheon, Gwangju, Daejeon, and Ulsan) and 9 provinces (Gyonggi, Gangwon, Chungcheong-South, Chungcheong-North, Jeonla-South, Jeonla-North, Gyongsang-South, Gyongsang-North, and Jeju). In 2008, the LTCI data covers only half-year period from July to December of 2008. Findings from the 2009-2010 data are consistent with Table 5. Full results are available upon request.
Source: NHIS Statistical Yearbook 2008-2010.
Table 6. Panel FE Model:
The Impact of LTCI Expenditure on NHI Service Use of the Elderly
Variables Log(npat) Log(nadm) Log(tdays)
Coeff. SE Coeff. SE Coeff. SE
Log(ltc) .089** .029 .078* .032 .069** .015 Log(nelderly) .604** .013 .610** .015 .072** .024 Log(premium) .009 .006 .006 .005 .0008 .003 Log(nhosp) .051 .069 .089 .071 -.054 .032 Log(ndoc) .091** .024 .108** .023 .012* .006 Log(nhi)-1 -.481** .071 -.437** .072 .049 .063 Log(adm) .903** .033
Model sum of squares 4.33 4.73 6.15
F-test 599.5 855.2 951.8
Notes: Intercept is included. * and ** indicate 5% and 1% statistical significance, respectively. Standard errors (SE) are calculated robust to clustering. Log(nhi)-1 is the one-year lag value of log(nhi).
Source: NHIS Statistical Yearbook 2008-2010.
To further examine the mechanism of this positive association of two programs, we run another sets of panel estimations in which dependent variables are total number of patients, total number of admissions and total treatment days. Health condition of a region is controlled by total NHI expenditure in the previous year. Table 6 shows
that the LTCI payment has a positive significant relationship with all three service quantity measures. Findings indicate that with more spending in the LTCI benefit, there will be more elderly patients availing NHI benefit (0.089%, p<0.01), greater number of admissions to medical facilities (0.078%, p<0.05), and larger number of treatment days among the elderly (0.069%, p<0.01). This suggests that the additional LTCI benefit has promoted the NHI service use among the elderly members.
Ⅳ. Summary and Discussion
The Long-Term Care Insurance (LTCI) program is a major step that the Korean health care system took in 2008 in order to serve long-term care needs of the ageing population. With this new public insurance benefit, the unprecedented growth of nursing homes and home care providers is facilitated to offer the adequate access to long-term care among the elderly. It raises questions about the future of the Korean health insurance system: how the LTCI program will amend health care financing of the Korean NHI system. The LTCI benefit can help the elderly avoid costly inpatient care or emergency services, which will consequently mitigate the NHI payment for the elderly. On the other hand, the LTCI benefit may generates a reinforcement effect on the NHI program, leading the elderly to seek for more health service and to cause more payment in the NHI system.
Findings of this study show that the greater use of the NHI covered service is associated with the larger LTCI spending. It is plausible that the elderly population is encouraged to pay attention to their health conditions and learn how to avail the necessary service due to the national-wide promotion of this new public program. It is, however, inconclusive whether the increase in service use in the NHI program contributes to reduce unmet needs and thus to foster better health in their later life among the elderly. Further study should investigate whether this additional benefit from
two public insurance programs enhances health outcomes of the elderly beneficiaries. The estimated positive effect of the LTCI program on the NHI financing seems contradictory to the intended role of the LTCI implementation – reduction in the NHI spending on the elderly. Cost saving in the NHI program, however, assumes that expensive and intense acute care service provided for the elderly NHI members is practically substitued by long-term care service in the LTCI program. In the present setting of two programs, there is no procedure or management scheme to trace how much the NHI-covered services are induced or avoided due to the provision of long-term care. Nursing home facilities are to be certified by NHIS as the designated LTCI providers if they have a contracted counterpart of acute care hospitals or practitioners with which the long-term care providers collaborate to serve the institutionalized elderly when specific health risks are detected. In this framework, little incentive or service delivery guideline is invovled in both sides of providers to behave cost effectively. This may account for the positive assocation of the LTCI payment with the NHI spending on the elderly. Coordinated delivery management across outpatient care, inpatient care, and long-term care service is the prerequite condition to induce cost saving effect of the LTCI benefit on the NHI program.
As both programs are under constant reforms, it is important to keep examining the dynamics of these programs in a perspective of sustainable health care in Korea. The Korean government and the NHIS face with another critical question regarding the fiscally sustainable and adequate long-term care system, such as how private insurance market should be engaged in serving the long-term care needs, and whether the increased government subsidy is necessary (in 2010, it is 15% of total LTCI revenue) to preserve the generosity of the means-testing eligibility screening. When the capacity of public financing in the LTCI program is predicted insufficient to meet the rapidly expanding need for the LTC service, individuals may look up additional private insurance coverage for long-term care instead of solely relying on public coverage. The decade-long experience of the NHI program and the Medicaid
in the U.S. to balance fiscal soundness and eligibility expansion may provide helpful lessons to these issues (Brown & Finkelstein, 2011). This study is one of the first attempts to address the implication of the newly introduced LTCI program in Korea with a focus on the NHI financing. Further research should examine the behavioral mechanism of the elderly LTCI beneficiaries in their NHI service use. Policy guidance for the cost effective delivery network among the NHI providers and the LTCI providers should be established to promote the well-aging of the elderly population and to assure fiscal sustainability of the Korean public insurance system.
신자은은 미국 Texas A&M University에서 경제학 박사학위를 받았으며 현재 KDI국제정책대학 원에서 교수로 재직 중이다. 주요 관심분야는 보건경제학, 보건의료정책, 개발협력과 국제보건, 응용미시계량이며, 민간의료보험의 서비스이용효과, 노령층의 의료보장정책등을 연구하고 있다. (E-mail: [email protected])
참고문헌
Brown, J., Finkelstein, A. (2011). Insuring Long-Term Care in the U.S. NBER Working Paper Series. No. 17451, Cambridge: MA.
Cho, KH., Chung, Y., Roh, YK., Cho, B., Kim, CH., Lee, HS. (2004). Heath Care for Older Persons: A Country Profile- Korea. Journal of American Geriatrics Society, 52(7), pp.1199-1204.
Kim, JI. (2004). Cost-Effectiveness Analysis of the Elderly for Health Insurance Programs in Korea. Journal of the Korea Gerontological Society, 24(3), pp.51-67. Kim, SH., Kim, DH., Kim, WS. (2010). Long-Term Care Needs of the Elderly in
Korea and Elderly Long-Term Care Insurance. Social Work in Public Health, 25, pp.176-184.
Kwon, SM., (2011). Future of Long-Term Care Financing for the Elderly in Korea. Journal of Aging and Social Policy, 20(1), pp.119-136.
Lee, EK. (2010). Long-Run Projection of the Long-Term Care Insurance Financing, Public Finance Forum, December, 6-25 (in Korean).
Sakong, J., Yoon, SY., Cho, MD. (2011). A Study on the Determinants of the Benefits of the Long-term Care Insurance in Korea, Korean Journal of Health Policy and Administration, 21(4), pp.617-642.
Shin, J. (2012). Private Health Insurance in Korea: An International Comparison, Health Policy, 108, pp.76-85.
Tchoe, BH., Nam, SH. (2008). Aging Risk and Health Care Cost in Korea, Asia Health Policy Program working paper, No. 3.
National Health Insurance Corporation.(2010). Summary of the Long-Term Care Insurance 2009. Statistical Yearbook of the Long-Term Care Insurance. Wooldridge, J. (2010). Econometric Analysis of Cross Section and Panel Data. Second
Acronym Full Title
CT Computed Tomography
FE Fixed Effects
KRW Korean Won
LTCI Long-Term Care Insurance
MRI Magnetic Resonance Imaging
NHI National Health Insurance
NHIS National Health Insurance Service
NSO National Statistical Office
OLS Ordinary Least Squares
UN United Nations
Appendix
A1. Summary Statistics (All figures in logarithms)
Regions
NHI spend-ing for the elderly
LTCI benefit payment for the elderly
Total number of admissions for the elderly
Total number of the elderly pa-tients Total treat-ment days of the elderly Seoul 21.71 19.70 17.81 14.13 20.13 Busan 20.97 18.70 17.15 13.26 19.22 Daegu 20.42 18.30 16.59 12.77 18.77 Incheon 20.32 18.65 16.46 12.71 18.68 Gwangju 19.83 18.04 15.95 12.11 18.05 Daejeon 19.84 18.09 16.02 12.18 18.14 Ulsan 19.36 17.19 15.55 11.67 17.56 Kyunggi 21.81 19.98 17.91 14.21 20.20 Gangwon 20.20 18.41 16.30 12.62 18.57 Choongbuk 20.16 18.17 16.36 12.53 18.49 Choongnam 20.61 18.64 16.82 12.95 18.94 Chunbuk 20.67 18.58 16.83 12.88 18.86 Chunnam 20.81 18.68 17.01 13.07 19.00 Kyungbuk 20.91 18.84 17.07 13.25 19.17 Kyunbnam 20.92 18.84 17.13 13.21 19.11 Jeju 19.15 17.55 15.46 11.48 17.49