The effect of neonatal hypothyroidism and
low family income on intellectual disability: A
population-based cohort study
Jin Young Nam1,2☯, Young Choi1,2☯, Mo Kyung Jung3, Jaeyong Shin2,4, Kyoung Hee Cho2, Woorim Kim1,2, Eun-Cheol ParkID2,4*
1 Department of Public Health, Graduate School, Yonsei University, Seoul, Republic of Korea, 2 Institute of
Health Services Research, Yonsei University College of Medicine, Seoul, Republic of Korea, 3 Department of Pediatrics, Bundang Cha Medical Center, Gyeonggi-do, Republic of Korea, 4 Department of Preventive Medicine, Yonsei University College of Medicine, Seoul, Republic of Korea
☯These authors contributed equally to this work.
Abstract
Background
To investigate relationships among neonatal hypothyroidism, family income, and intellectual disability, as well as the combined effects of neonatal hypothyroidism and low family income on intellectual disability.
Methods
Data were extracted from the National Health Insurance Service-National Sample Cohort from 2002 to 2011. This retrospective study included 91,247 infants. The presence of intel-lectual disability was based on the disability evaluation system in Korea. Newborn hypothy-roidism was identified from diagnosis and prescription codes. Family income was
determined from average monthly insurance premiums. Cox proportional hazards models were used to calculate adjusted hazard ratios.
Results
Of the 91,247 infants, 208 were considered to have intellectual disability (29.18 cases per 100,000 person-year). The risk of intellectual disability was higher in infants with hypothy-roidism than in those without hypothyhypothy-roidism (hazard ratio = 5.28, P:<.0001). The risk of intellectual disability was higher in infants with low family income than in those with high fam-ily income (hazard ratio = 2.32, P:<.0001). The risk of intellectual disability was higher in infants with hypothyroidism and low family income than in those without hypothyroidism and with high family income (hazard ratio = 36.05, P:<.0001).
Conclusions
Neonatal hypothyroidism and low family income were associated with the risk of intellectual disability in Korea. Additionally, neonatal hypothyroidism and low family income significantly increased the risk of intellectual disability. Public health policymakers should consider a1111111111 a1111111111 a1111111111 a1111111111 a1111111111 OPEN ACCESS
Citation: Nam JY, Choi Y, Jung MK, Shin J, Cho KH, Kim W, et al. (2018) The effect of neonatal hypothyroidism and low family income on intellectual disability: A population-based cohort study. PLoS ONE 13(11): e0205955.https://doi. org/10.1371/journal.pone.0205955
Editor: Paula Soares, Universidade do Porto Faculdade de Medicina, PORTUGAL Received: January 3, 2017 Accepted: October 4, 2018 Published: November 7, 2018
Copyright:© 2018 Nam et al. This is an open access article distributed under the terms of the
Creative Commons Attribution License, which permits unrestricted use, distribution, and reproduction in any medium, provided the original author and source are credited.
Data Availability Statement: These third-party data were obtained from the Korean National Health Insurance Service (KNHIS). The authors had no special access privileges to the the data. Interested, qualified researchers can apply for access to the data by contacting the National Health Insurance Sharing Service (https://nhiss. nhis.or.kr/bd/ab/bdaba001cv.do).
Funding: The authors received no specific funding for this work.
providing additional resources for alleviating neonatal hypothyroidism among low-income families.
Introduction
Intellectual disability (ID) refers to a significant reduction in the ability to understand, learn,
and apply adaptive skills, and appears before 18 years of age [1,2]. The recent definition of ID
proposed by the American Association on Intellectual and Development Disability reflects both low intellectual functioning (an IQ test score of 70 to 75 or less) and poor adaptive
behav-ior, which involves limitations in conceptual, social, and practice skills in daily life [2].
Previ-ous studies have reported different causes of ID, such as genetic conditions, problems during pregnancy or birth (congenital hypothyroidism [CHT] and fetal alcohol syndrome), birth defects that affect the brain (asphyxia), problems during infancy and childhood (serious head
injury or meningitis) [2–4], and socioeconomic status (SES) [5–7]. Although the causes of ID
are not documented in more than half of the children with ID, preventable causes of ID, such
as neonatal hypothyroidism (NH), are noted in many children [8,9].
Neonatal hypothyroidism is well known as one of the most common preventable causes of ID, and hypothyroidism can be prevented with early detection and appropriate treatment soon
after birth in the first 2–6 postnatal weeks [4,10]. Studies have shown that IQs are lower in
chil-dren with NH who are not adequately treated in the first 2–3 years after birth, compared to
unaf-fected children [11,12]. Unfortunately, the clinical signs of NH are not obvious until a later age
[13]; therefore, early detection through infant screening programs and adequate treatment during
early childhood are important to prevent ID. There are several causes of newborn hypothyroid-ism, including thyroid gland dysgenesis or ectopic location, exposure to iodides, TSH deficiency, TRH deficiency, inborn defect in hormone synthesis or effects, and maternal goitrogen ingestion
[14]. Therefore, maternal health conditions might significantly influence fetal or NH.
Childhood SES has been reported to be associated with cognitive ability measured by IQ [5].
Studies have shown that children living in households with low income or in poverty are more
likely to have ID [15] and to obtain lower scores on standardized tests of academic achievement
[7,16]. In addition, low- or middle-income countries have been found to have higher
preva-lences of ID in children/adolescents, compared to high-income countries [17]. A previous study
indicated that there is a causal effect for parental financial resources on cognitive performance
in children [18], and another study reported an association between the development of specific
areas of the brain and poverty [19]. Furthermore, previous studies have mentioned that
mater-nal conditions might be related to socioeconomic factors [8,20], and inverse socioeconomic
dif-ferences have been found to be associated with ID [9,21,22]. Additionally, a correlation has
been reported between an increase in the risk of ID in children and the presence of unhealthy
conditions in mothers during pregnancy in disadvantaged populations [8]. However, there is
no information on the combined effect of NH and family income on ID in early childhood. The present study investigated the relationships among NH, family income, and ID, as well as the combined effect of NH and low family income on ID.
Materials and methods
Data collection and participants
Data source. The National Health Insurance Service–National Sample Cohort
(NHIS-NSC) is a population-based cohort established by the National Health Insurance
Competing interests: The authors have declared that no competing interests exist.
Abbreviations: ID, intellectual disability; CHT, congenital hypothyroidism; NH, neonatal hypothyroidism; TSH, thyroid-stimulating hormone; SES, socioeconomic status; NHIS-NSC, the National Health Insurance Service-National Sample Cohort; NHIS, National Health Insurance Service; NHI, National Health Insurance; ICD, International Classification of Diseases; HR, hazard ratio; CI, confidence interval.
Service (NHIS) in South Korea [23]. Korea supports universal health insurance for all citizens
via a single-insurer system [23]. The purpose of this cohort is to provide public health
researchers and policymakers with representative, useful information on the utilization of
health insurance and health examinations among Korean citizens [23]. The NHIS provides
benefits for prevention, diagnosis, disease and injury treatment, rehabilitation, births, deaths,
health promotion, and national records for healthcare utilization and prescriptions [23]. The
NHIS-NSC was designed to include a target population of 46 605 433 individuals from 47 851 928 individuals included in the 2002 NHIS, excluding non-citizens and special purpose
employees with an unidentifiable income level [23]. From the target population, a
representa-tive sample cohort was selected. The cohort included 1 025 340 participants, who were ran-domly selected. This comprised 2.2% of the total eligible Korean population in 2002, and the participants were followed for 11 years until 2013, unless a participant’s eligibility was
disquali-fied because of death or emigration [23]. Systematic stratified random sampling with
propor-tional allocation within each stratum was performed using the individual’s total annual medical expenses, including age, sex, residence, and health insurance type, as a target variable
for sampling [24]. Therefore, the representativeness of the sample was evaluated by examining
whether a 95% confidence interval for the sample’s average total annual medical expenses
included the population average and whether the finding was satisfied for every stratum [23].
The cohort sampled in the 2002 NHIS database was followed until 2013. Its participants were still eligible for health insurance. The number of infants (age 0) in the initial cohort and those
added annually are provided in the table [23]. In addition, the structure of the cohort data was
semi-dynamic, and approximately 9,000 newborn infants were added using stratified random sampling every year (the same sampling method as in the first wave) to preserve the national representativeness of the original sample by replacing individuals lost owing to death over time. The unique de-identified numbers of the patients, age, sex, types of insurance, diagnoses according to the International Classification of Diseases (ICD-10), medical costs, procedures, and prescribed drugs were included. The degree of ID was evaluated using the disability evalu-ation system in accordance with the welfare enforcement regulevalu-ation for disabled persons in Korea. In addition, unique de-identified numbers were linked to mortality information from the Korean National Statistical Office. Currently, the NHIS plans to maintain regular annual
cohort updates for the NHIS-NSC [23].
Data collection. We performed a cohort study of newborn infants between 2002 and
2011. Among 1,025,340 NHIS-NSC enrollees in 2002, we selected 9,562 newborn infants. Additionally, we selected 81,685 newborn infants included between 2003 and 2011. To ensure confidentiality, the NHIS-NSC included only the birth year and not the exact birth date. Therefore, the coded infant birth status did not always appear within the database. This study adhered to the tenets of the Declaration of Helsinki, and the study design was reviewed and approved by the ethics board of the Graduate School of Public Health in Yonsei University (2-1040939-AB-N-01-2016-332).
Intellectual disability and follow up
The outcome variable for this study was ID. The occurrence of ID was based on the disability evaluation system. According to this system, children with ID should be diagnosed by a psy-chiatrist, neurologist, or rehabilitation specialist in a hospital. In order to assess ID, specialists commonly use the Bayley Scales of Infant Development (for early childhood), Stanford-Binet Intelligence Scales (2–23 years), K-Wechsler Preschool and Primary Scale of Intelligence (3–7 years), and Korean Educational Development Institute-Wechsler Intelligence Scale for Chil-dren (5–15 years). The specialists estimate intellectual functioning skills and adaptive behavior
through these scales and determine the IQ score [25]. All infants born between 2002 and 2011 were observed from birth until December 31, 2013 or until registration of disability or death, whichever came first.
Neonatal hypothyroidism
Neonatal hypothyroidism was identified from diagnosis and prescription drug codes. We con-sidered an infant to have hypothyroidism if the infant had at least one outpatient claim for hypothyroidism (ICD-10 codes E00, E01, E02, and E03) and one or more filled prescriptions for thyroid hormone therapy (levothyroxine) during the first year of life.
Family income as part of the socioeconomic status
We used national health insurance (NHI) premiums as a proxy for family income. In Korea, individuals qualify for medical aid if their family income is less than $600 per month. If family income is more than $600 per month, individuals qualify for NHI. The NHI premiums are mandatory and imposed based on monthly salary, taxable income, and assets. Individuals who qualified for NHI were distributed between the 1st and 100th percentiles for income, while those who qualified for medical aid were classified as the zero percentile. We classified family income as follows: (1) low income (medical aid/below the 40th percentile), (2) mid-level income (41st–70th percentile), and (3) high income (71st–100th percentile). Family income referred to household income during the infants’ first year of life.
Covariates
Demographic factors (sex, residence area, year of birth) were included. Low birth weight (<2500 g) and preterm birth (<37 weeks) were identified from medical records (ICD-10 code P07). Birth asphyxia was identified from medical records as intrauterine hypoxia or birth asphyxia (ICD-10 codes P20 and P21). Congenital factors were identified from the medical records. Congenital malformations in the following systems/organs were included: nervous system (codes Q00, Q01, Q02, Q03, and Q04); eye, ear, face, and neck (codes Q1.x); circulatory system (codes Q2.x); respiratory system (codes Q30, Q31, Q32, Q33, and Q34); digestive sys-tem (codes Q38, Q39, Q40, Q41, Q42, Q43, Q44, and Q45); genital organs (codes Q5); urinary system (codes Q60, Q61, Q62, Q63, and Q64); musculoskeletal system (codes Q65, Q66, Q67, Q68, Q69, and Q7); and others (codes Q8). Additionally, cleft lip and cleft palate (codes Q35, Q36, and Q37) were included. Chromosomal abnormalities were identified according to the ICD-10 code Q9. Inborn errors of metabolism were identified according to the ICD-10 codes E7, E80, E83, E84, E85, E87, E88, E89, and E9. These codes were obtained for all cohort mem-bers from the NHIS-NSC.
Statistical analysis
We calculated the distribution of general characteristics of the study participants born between 2002 and 2011. The relationships among hypothyroidism, family income, and ID were ana-lyzed using time-to-event methods. Cumulative incidence curves were generated for compari-son of unadjusted ID rates according to hypothyroidism and family income groups. In order to examine whether ID is related with children with hypothyroidism or with low income, mul-tivariable analyses were performed using Cox proportional hazards models to calculate adjusted hazard ratios (HRs) (95% confidence intervals [CIs]) as an estimate of the relative rate of ID. The proportionality assumption was tested by plotting Schoenfeld-like residuals. In addition, a combined Cox proportional hazards model was planned if an interaction between
hypothyroidism and family income was found to affect ID. We performed a sensitivity analysis excluding trisomies including Down syndrome, Edwards’ syndrome, and other tisomies (ICD 10: Q90, Q91, Q92). All statistical analyses were performed using SAS 9.4 (SAS Institute, Inc.,
Cary, NC, USA). The level of significance was set atP < 0.05.
Results
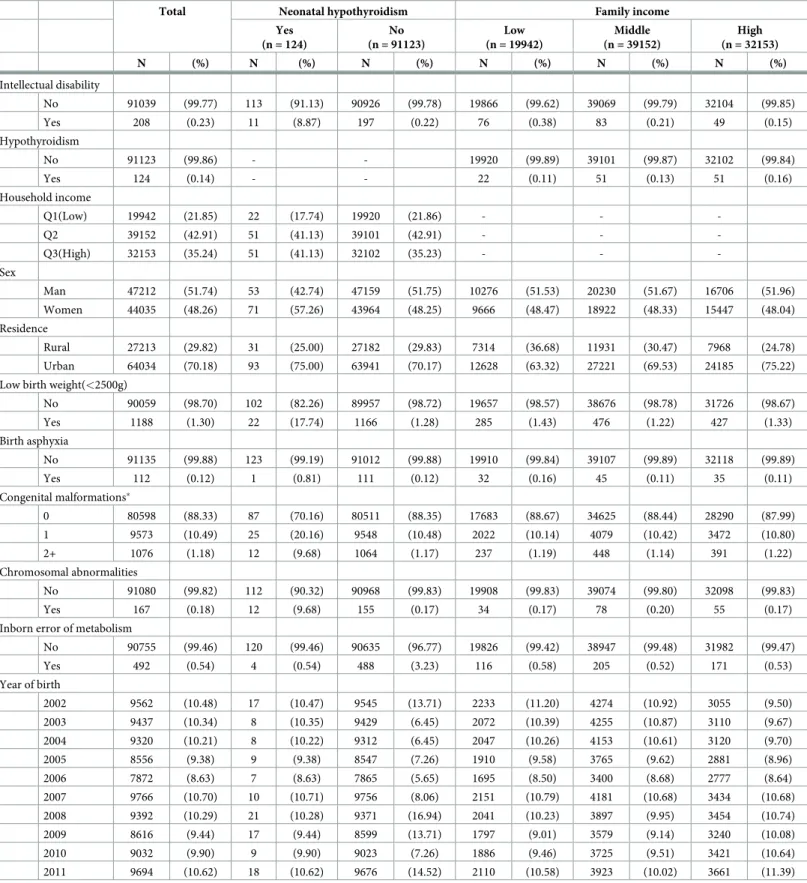
Table 1presents the general characteristics of the study population according to NH or family income. Of the 91,247 infants included in this study, 124 were found to have NH and 19,942 were found to have low family income. Among the infants with NH, ID was noted in 8.87%, and 0.22% of those without NH had ID. In regards to family income, 0.38%, 0.21%, and 0.15% of infants with low-, middle-, and high family income, respectively, had ID.
Fig 1presents the cumulative incidence of ID according to the NH and family income groups. The incidence of ID was significantly higher in infants with NH than in those without NH (P < 0.0001). Additionally, the incidence of ID was significantly higher in infants with low
family income than in those with high family income (P < 0.0001).
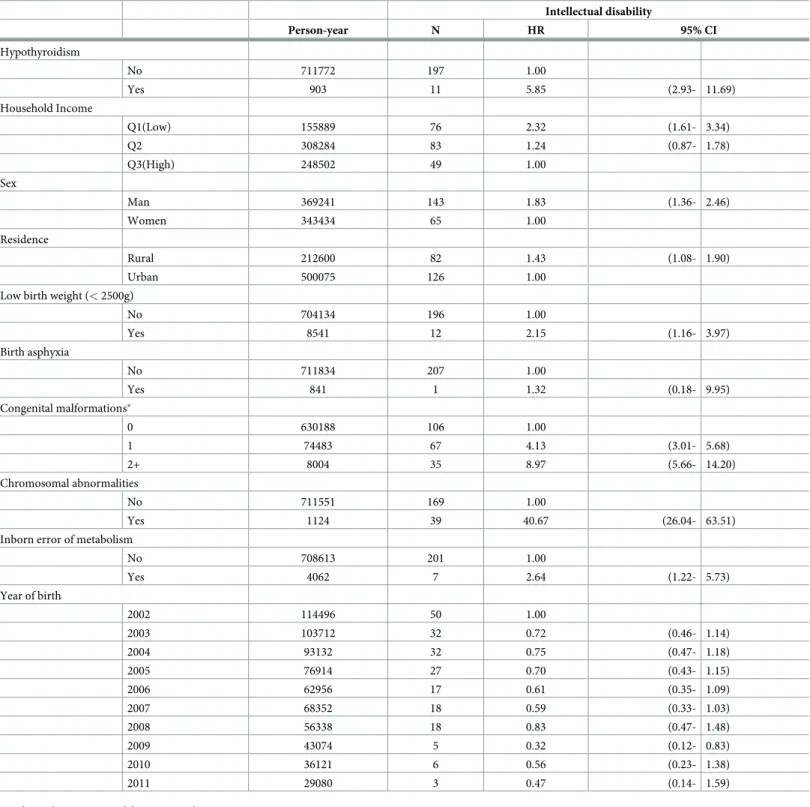
Table 2presents the results of the Cox proportional hazards analysis. The risk of ID was higher in infants with NH than in those without NH (HR = 5.28, 95%CI: 2.65–10.52). Addi-tionally, infants with low family income were likely to have a high risk of ID. There was a sta-tistically significant association between low family income and ID in infants (HR = 2.32, 95% CI: 1.61–3.34).
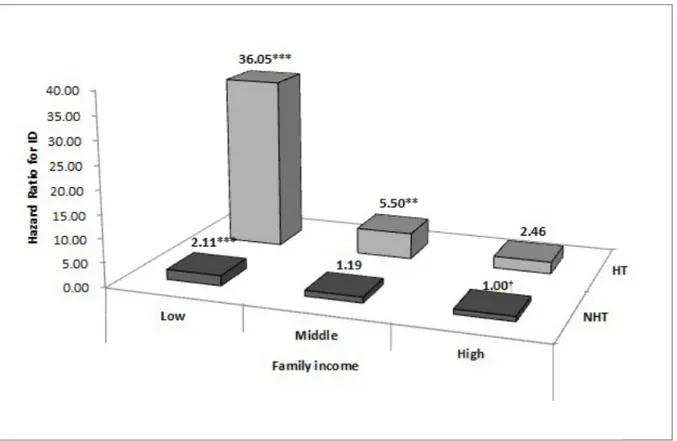
Fig 2presents the results of the Cox proportional hazards analysis of the combined effect of NH and family income on ID. Infants with NH and low or mid-level family income were more likely to have a high risk of ID than those without NH and high family income (low: HR = 36.05, 95%CI: 12.79–101.61; mid-level: HR = 5.50, 95%CI: 1.82–16.61). In addition, infants with low family income showed a high risk of ID irrespective of NH, compared with
the reference group (low family income without NH; HR = 2.11, 95%CI: 1.46–3.07) (SeeS1
Table, available online).
S2–S4Tables present the result of sensitivity analysis excluding trisomes such as Down
syn-drome. After excluding these children, infant with NH was high risk of ID compared with those without NH (HR = 7.86, 95% CI: 2.70–22.89). In addition, infants with the lowest family income had a high risk of ID compared with those with the highest family income (HR = 2.39,
95% CI: 1.62–3.52) (SeeS3 Table, available online).
Discussion
The present study found that NH increases the risk of ID. Additionally, low family income was associated with a high risk of ID. Moreover, we noted a significant combined effect for low family income and NH on the risk of ID. To our knowledge, this population-based cohort study is the first to examine the associations among NH, family income, and ID in infants born between 2002 and 2011.
Our finding of an association between NH and ID is consistent with the findings of
previ-ous studies, which showed that NH is a common, preventable cause of ID [10,26,27]. In the
study by Grosse et al., among children with clinically diagnosed CHT, 8–28% were found to
have ID [26]. In the present study, 8.8% of infants with NH had ID during childhood, and the
risk of ID was approximately six-fold higher in these infants with NH than in those without NH.
Previous studies have assessed SES, particularly poverty and low family income, in relation to ID. In a meta-analysis, Maulik and colleagues demonstrated that low- and middle-income countries had a higher prevalence of ID that was almost twice that of high-income level
Table 1. General participant characteristics according to neonatal hypothyroidism or family income from 2002 to 2011.
Total Neonatal hypothyroidism Family income
Yes (n = 124) No (n = 91123) Low (n = 19942) Middle (n = 39152) High (n = 32153) N (%) N (%) N (%) N (%) N (%) N (%) Intellectual disability No 91039 (99.77) 113 (91.13) 90926 (99.78) 19866 (99.62) 39069 (99.79) 32104 (99.85) Yes 208 (0.23) 11 (8.87) 197 (0.22) 76 (0.38) 83 (0.21) 49 (0.15) Hypothyroidism No 91123 (99.86) - - 19920 (99.89) 39101 (99.87) 32102 (99.84) Yes 124 (0.14) - - 22 (0.11) 51 (0.13) 51 (0.16) Household income Q1(Low) 19942 (21.85) 22 (17.74) 19920 (21.86) - - -Q2 39152 (42.91) 51 (41.13) 39101 (42.91) - - -Q3(High) 32153 (35.24) 51 (41.13) 32102 (35.23) - - -Sex Man 47212 (51.74) 53 (42.74) 47159 (51.75) 10276 (51.53) 20230 (51.67) 16706 (51.96) Women 44035 (48.26) 71 (57.26) 43964 (48.25) 9666 (48.47) 18922 (48.33) 15447 (48.04) Residence Rural 27213 (29.82) 31 (25.00) 27182 (29.83) 7314 (36.68) 11931 (30.47) 7968 (24.78) Urban 64034 (70.18) 93 (75.00) 63941 (70.17) 12628 (63.32) 27221 (69.53) 24185 (75.22)
Low birth weight(<2500g)
No 90059 (98.70) 102 (82.26) 89957 (98.72) 19657 (98.57) 38676 (98.78) 31726 (98.67) Yes 1188 (1.30) 22 (17.74) 1166 (1.28) 285 (1.43) 476 (1.22) 427 (1.33) Birth asphyxia No 91135 (99.88) 123 (99.19) 91012 (99.88) 19910 (99.84) 39107 (99.89) 32118 (99.89) Yes 112 (0.12) 1 (0.81) 111 (0.12) 32 (0.16) 45 (0.11) 35 (0.11) Congenital malformations� 0 80598 (88.33) 87 (70.16) 80511 (88.35) 17683 (88.67) 34625 (88.44) 28290 (87.99) 1 9573 (10.49) 25 (20.16) 9548 (10.48) 2022 (10.14) 4079 (10.42) 3472 (10.80) 2+ 1076 (1.18) 12 (9.68) 1064 (1.17) 237 (1.19) 448 (1.14) 391 (1.22) Chromosomal abnormalities No 91080 (99.82) 112 (90.32) 90968 (99.83) 19908 (99.83) 39074 (99.80) 32098 (99.83) Yes 167 (0.18) 12 (9.68) 155 (0.17) 34 (0.17) 78 (0.20) 55 (0.17)
Inborn error of metabolism
No 90755 (99.46) 120 (99.46) 90635 (96.77) 19826 (99.42) 38947 (99.48) 31982 (99.47) Yes 492 (0.54) 4 (0.54) 488 (3.23) 116 (0.58) 205 (0.52) 171 (0.53) Year of birth 2002 9562 (10.48) 17 (10.47) 9545 (13.71) 2233 (11.20) 4274 (10.92) 3055 (9.50) 2003 9437 (10.34) 8 (10.35) 9429 (6.45) 2072 (10.39) 4255 (10.87) 3110 (9.67) 2004 9320 (10.21) 8 (10.22) 9312 (6.45) 2047 (10.26) 4153 (10.61) 3120 (9.70) 2005 8556 (9.38) 9 (9.38) 8547 (7.26) 1910 (9.58) 3765 (9.62) 2881 (8.96) 2006 7872 (8.63) 7 (8.63) 7865 (5.65) 1695 (8.50) 3400 (8.68) 2777 (8.64) 2007 9766 (10.70) 10 (10.71) 9756 (8.06) 2151 (10.79) 4181 (10.68) 3434 (10.68) 2008 9392 (10.29) 21 (10.28) 9371 (16.94) 2041 (10.23) 3897 (9.95) 3454 (10.74) 2009 8616 (9.44) 17 (9.44) 8599 (13.71) 1797 (9.01) 3579 (9.14) 3240 (10.08) 2010 9032 (9.90) 9 (9.90) 9023 (7.26) 1886 (9.46) 3725 (9.51) 3421 (10.64) 2011 9694 (10.62) 18 (10.62) 9676 (14.52) 2110 (10.58) 3923 (10.02) 3661 (11.39)
�Congenital malformations of the nervous system, eye, ear, face, neck, circulatory system, respiratory system, genital organs, urinary system, digestive system,
musculoskeletal system, and other organs/systems, as well as cleft lip and cleft palate
countries [17]. In Emerson’s study, children with ID were more likely to have mothers with low educational level, low weekly household income, and poverty level, compared with
chil-dren without ID [15]. Furthermore, Hair and colleagues mentioned that children born into
poor families showed low brain development [7], and Hackman and colleagues reported that
low SES in childhood was associated with poor cognitive development and that this was posi-tively related to intelligence and academic achievement from early childhood through
adoles-cence [5,6]. The present study showed that the risk of ID was over 2.3-fold higher in infants
born into low-income families than in infants born into high-income families. Therefore, our findings are consistent with previous findings.
The combination of NH and low family income was strongly associated with a high risk of ID in infants. Moreover, we found that infants with low family income had a high risk of ID irrespective of NH. These findings indicate that NH is a strong risk factor for ID, especially infants with NH, and that low family income is significantly associated with the risk of ID.
The effect of NH and low family income might be explained by several mechanisms. First, NH is one of the most easily preventable causes of ID. If newborns with NH are treated ade-quately and promptly within the first 2–6 postnatal weeks, they can grow and develop
nor-mally [28]. However, if children remain untreated or their clinical symptoms become evident
in the second half of the first year of life, delay in the development of motor skills and ID are
unavoidable [28]. Moreover, IQs have been reported to be lower in children who are treated
inadequately in the first 2–3 years after birth than in unaffected children [10,11].
Unfortu-nately, the majority of newborns with NH do not have obvious manifestations of hypothyroid-ism, as some residual thyroid function might be present, and the clinical symptoms and signs
of hypothyroidism are relatively nonspecific, making clinical diagnosis difficult [27]. The best
approach to detect infants with NH is newborn screening programs, and such programs are
being performed in many developed countries to prevent ID [27]. Second, SES, especially
)
B
(
)
A
(
Fig 1. Cumulative incidence curves for the occurrence of intellectual disability according to neonatal hypothyroidism or family income. (A) Cumulative incidence of intellectual disability according to neonatal hypothyroidism. (B) Cumulative incidence of intellectual disability according to family income. T1, with neonatal hypothyroidism; T2, without neonatal hypothyroidism; Q1, low family income; Q2, middle family income; Q3, high family income.
Table 2. Cox proportional hazards analysis for associations between the presence of intellectual disability and risk factors. Intellectual disability Person-year N HR 95% CI Hypothyroidism No 711772 197 1.00 Yes 903 11 5.85 (2.93- 11.69) Household Income Q1(Low) 155889 76 2.32 (1.61- 3.34) Q2 308284 83 1.24 (0.87- 1.78) Q3(High) 248502 49 1.00 Sex Man 369241 143 1.83 (1.36- 2.46) Women 343434 65 1.00 Residence Rural 212600 82 1.43 (1.08- 1.90) Urban 500075 126 1.00
Low birth weight (< 2500g)
No 704134 196 1.00 Yes 8541 12 2.15 (1.16- 3.97) Birth asphyxia No 711834 207 1.00 Yes 841 1 1.32 (0.18- 9.95) Congenital malformations� 0 630188 106 1.00 1 74483 67 4.13 (3.01- 5.68) 2+ 8004 35 8.97 (5.66- 14.20) Chromosomal abnormalities No 711551 169 1.00 Yes 1124 39 40.67 (26.04- 63.51)
Inborn error of metabolism
No 708613 201 1.00 Yes 4062 7 2.64 (1.22- 5.73) Year of birth 2002 114496 50 1.00 2003 103712 32 0.72 (0.46- 1.14) 2004 93132 32 0.75 (0.47- 1.18) 2005 76914 27 0.70 (0.43- 1.15) 2006 62956 17 0.61 (0.35- 1.09) 2007 68352 18 0.59 (0.33- 1.03) 2008 56338 18 0.83 (0.47- 1.48) 2009 43074 5 0.32 (0.12- 0.83) 2010 36121 6 0.56 (0.23- 1.38) 2011 29080 3 0.47 (0.14- 1.59)
HR, hazard ratio; CI, confidence interval
�Congenital malformations of the nervous system, eye, ear, face, neck, circulatory system, respiratory system, genital organs, urinary system, digestive system,
musculoskeletal system, and other organs/systems, as well as cleft lip and cleft palate
poverty, has been shown to affect brain development in infants [5–7,13,29]. In the study by Hackman et al., prenatal factors, parental care, and cognitive stimulation were suggested to be
potential factors that influence the effect of SES on neurocognitive development [5]. Other
studies have shown that maternal inverse SES is related to ID in infants, because maternal
con-ditions might be associated with SES factors [8,20]. Additionally, low SES in pregnant women
might be associated with high levels of stress, malnutrition, and high infection rates during
pregnancy [5], as well as birth-related infections and injuries due to poor maternal and child
health care facilities [30], which could increase the likelihood of premature birth, impaired
fetal growth [31], and intra-uterine growth retardation [30]. In particular, thyroid deficiency
or disease during pregnancy has been found to increase the risk of low IQ or encephalopathy
in newborns [30,32,33], and women with less strictly managed thyroid disease have been
deemed more likely to have affected infants [33]. In order to prevent ID in children, it is
important to maintain serum free T4 levels in the mid-normal range and TSH levels in the
normal range [10]. To achieve treatment goals, serum free T4 and TSH levels should be
moni-tored periodically, and oral T4 (levothyroxine) doses should be appropriately managed [10].
The exact dose volume, time to dose, and feeding method for infants should be determined,
and food intake should be avoided during the administration period [27]. Meanwhile, low SES
of the mother might be associated with low education, low income, low health insurance
cov-erage, and high depression [29,34]. Also, low SES infants are more likely to suffer from high
blood lead levels, iron deficiency, stunting, and sensory impairment, and these outcomes likely reflect conditions associated with low SES, including inadequate nutrition, insufficient access
Fig 2. Combined effect of neonatal hypothyroidism and family income on intellectual disability. Adjusted for sex, residence area, low birth weight, birth asphyxia, congenital malformations, chromosomal abnormalities, and inborn errors of metabolism. ID, intellectual disability; NH, neonatal hypothyroidism; No NH, no neonatal hypothyroidism.�P < 0.05,��P < 0.01,���P < 0.001. †reference.
to health care, failure to get recommended immunization, and exposure to tobacco smoke
[35]. Therefore, these conditions might increase the risk of ID.
The present study has several strengths. This study included a large population of infants and implemented a population-based design. Data were obtained from the nationally repre-sentative NHIS-NSC. Additionally, we used the unique personal identity number of each Korean resident and linked it to national insurance and mortality data for follow-up. This study provided evidence of the associations of NH and low family income with ID, as well as the significant effect of NH and low family income on the occurrence of ID. Cumulative evi-dence has explained the association between socioeconomic disadvantage and ID. In addition, we used family income to measure objective method. Nevertheless, few longitudinal studies have been performed, and previous studies had issues with regard to the measurement of ID
[36]. In our study, the measurement of ID was comparatively reliable and was considered valid
because it was based on the definition of ID according to law, which considers medical opinion and various examinations by physicians. Our findings reinforce the value of analyzing different measures of ID when studying the etiology of health inequalities, especially during childhood.
Although this study had many strengths, several limitations should be considered. First, there are issues with the use of administrative claims data. The reliance on ICD-10 might yield some misclassification owing to the unavoidable characteristics of claims data, including mis-coding, whether intended or not. However, efforts have been made by the government and hospitals, and currently, nearly 70% of primary, secondary, and tertiary diagnosis codes from claims records coincide with those from medical records in hospitals. Second, we could not include maternal information on diagnosis or treatment of thyroid disease, tobacco use, alco-hol consumption, dietary habits, or other behavioral factors during pregnancy because of con-fidentiality. Furthermore, we could not ascertain the procedures performed or the health status of the newborns during/after birth because the database did not include complete infor-mation to ensure confidentiality. Therefore, some participants with incomplete inforinfor-mation might be categorized with no disease status. Finally, our study results might have been influ-enced by unmeasured variables, as is the case with all observational studies. While we tried our best to identify and account for potential confounders, such efforts are inherently imperfect.
Conclusion
This study identified associations among NH, low family income, and the risk of ID. More-over, NH and low family income were found to significantly increase the risk of ID. These findings accentuate the importance of accurate detection programs for hypothyroidism in newborns. Public health policymakers should consider providing additional resources for alle-viating NH for low-income families.
Supporting information
S1 Table. Combined effect of hypothyroidism and household income on intellectual dis-ability. Adjusted for sex, residence area, low birth weight, birth asphyxia, congenital
malfor-mations, chromosomal abnormalities, and inborn errors of metabolism.
HR, hazard ratio; CI, confidence interval; ID, intellectual disability; HT, hypothyroidism; NHT, no hypothyroidism; INC, household income.
(DOCX)
S2 Table. General characteristics of participants excluding Down syndrome by hypothy-roidism and household income during 2002–2011.
S3 Table. Results of the Cox proportional hazards analysis: association between occurrence of intellectual disability and risk factors excluding Down syndrome.�Congenital malfor-mations of the nervous system, eye, ear face and neck, the circulatory system, the respiratory system, genital organs, the urinary system, Cleft lip and cleft palate, Other congenital malfor-mations of the digestive, Congenital malformalfor-mations and deformalfor-mations of the musculoskeletal system, Other congenital malformations.
(DOCX)
S4 Table. Combined effect of neonatal hypothyroidism and family income on intellectual disability excluding Down syndrome. Adjusted for sex, residence area, low birth weight,
birth asphyxia, congenital malformations, chromosomal abnormalities, and inborn errors of metabolism.
ID, intellectual disability; NH, neonatal hypothyroidism; No NH, not neonatal hypothyroidism.
�P < 0.05,��P < 0.01,���P < 0.001.
†reference. (DOCX)
Author Contributions
Conceptualization: Jin Young Nam, Young Choi, Mo Kyung Jung, Eun-Cheol Park. Data curation: Jin Young Nam, Young Choi.
Formal analysis: Jin Young Nam, Young Choi, Kyoung Hee Cho. Investigation: Jin Young Nam, Woorim Kim.
Methodology: Jaeyong Shin.
Project administration: Jin Young Nam, Eun-Cheol Park. Resources: Kyoung Hee Cho.
Supervision: Eun-Cheol Park. Visualization: Jin Young Nam.
Writing – original draft: Jin Young Nam.
Writing – review & editing: Young Choi, Mo Kyung Jung, Jaeyong Shin.
References
1. WHO Regional Office for Europe. Definition: intellectual disability 2016 [cited 2016 August 3]. In: WHO Regional Office for Europe Web page [Internet]. Denmark: WHO 1948. Available from:http://www. euro.who.int/en/health-topics/noncommunicable-diseases/mental-health/news/news/2010/15/ childrens-right-to-family-life/definition-intellectual-disability.
2. Robert L. Schalock SAB-D, Bradley Valerie J., Buntinx Wil H.E., Coulter David L., Craig Ellis M., Gomez Sharon C., Lachapelle Yves, Luckasson Ruth, Reeve Alya, Shogren Karrie A., Snell Martha E., Spreat Scott, Tasse´ Marc J, Thompson James R., Verdugo-Alonso Miguel A, Wehmeyer Michael L., and Yea-ger Mark H. Intellectual Disability: Definition, Classification, and Systems of Supports ( 11th Edition). Washington, D.C.: American Association on Intellectual and Developmental Disabilities; 2010.
3. Pratt HD, Greydanus DE. Intellectual disability (mental retardation) in children and adolescents. Prim Care. 2007; 34(2):375–86.https://doi.org/10.1016/j.pop.2007.04.010PMID:17666233
4. Centers for Disease Control and Prevention. Facts About Developmental Disabilities 2015 [cited 2016 August 3]. In: Center for Disease Control and Prevention Web page [Internet]: Atlanta: CDC 1942. Avail-able from:http://www.cdc.gov/ncbddd/developmentaldisabilities/facts.html.
5. Hackman DA, Farah MJ. Socioeconomic status and the developing brain. Trends Cogn Sci. 2009; 13 (2):65–73.https://doi.org/10.1016/j.tics.2008.11.003PMID:19135405
6. Hackman DA, Farah MJ, Meaney MJ. Socioeconomic status and the brain: mechanistic insights from human and animal research. Nat Rev Neurosci. 2010; 11(9):651–9.https://doi.org/10.1038/nrn2897 PMID:20725096
7. Hair NL, Hanson JL, Wolfe BL, Pollak SD. Association of child poverty, brain development, and aca-demic achievement. JAMA Pediatr. 2015; 169(9):822–9.https://doi.org/10.1001/jamapediatrics.2015. 1475PMID:26192216
8. Leonard H, de Klerk N, Bourke J, Bower C. Maternal health in pregnancy and intellectual disability in the offspring: a population-based study. Ann Epidemiol. 2006; 16(6):448–54.https://doi.org/10.1016/j. annepidem.2005.05.002PMID:16182562
9. Leonard H, Petterson B, De Klerk N, Zubrick SR, Glasson E, Sanders R, et al. Association of sociode-mographic characteristics of children with intellectual disability in Western Australia. Soc Sci Med. 2005; 60(7):1499–513.https://doi.org/10.1016/j.socscimed.2004.08.014PMID:15652683
10. Counts D, Varma SK. Hypothyroidism in children. Pediatr Rev. 2009; 30(7):251–8.https://doi.org/10. 1542/pir.30-7-251PMID:19570923
11. Collaborative NECH. Neonatal hypothyroidism screening: status of patients at 6 years of age. New England Congenital Hypothyroidism Collaborative. The Journal of pediatrics. 1985; 107(6):915–9. PMID:4067750
12. Grant DB, Fuggle P, Tokar S, Smith I. Psychomotor development in infants with congenital hypothyroid-ism diagnosed by neonatal screening. Acta medica Austriaca. 1992; 19 Suppl 1:54–6. Epub 1992/01/ 01.
13. Brosco JP, Mattingly M, Sanders LM. Impact of specific medical interventions on reducing the preva-lence of mental retardation. Arch Pediatr Adolesc Med. 2006; 160(3):302–9.https://doi.org/10.1001/ archpedi.160.3.302PMID:16520451
14. Marcdante KJ, Kliegman RM. Nelson essentials of pediatrics ( 7th edition.). Philadelphia: Elsevier/ Saunders; 2015.
15. Emerson E. Mothers of children and adolescents with intellectual disability: social and economic situa-tion, mental health status, and the self-assessed social and psychological impact of the child’s difficul-ties. J Intellect Disabil Res. 2003; 47(4-5):385–99.
16. Haveman R, Wolfe B. The determinants of children’s attainments: A review of methods and findings. J Econ Lit. 1995; 33(4):1829–78.
17. Maulik PK, Mascarenhas MN, Mathers CD, Dua T, Saxena S. Prevalence of intellectual disability: a meta-analysis of population-based studies. Res Dev Disabil. 2011; 32(2):419–36.https://doi.org/10. 1016/j.ridd.2010.12.018PMID:21236634
18. Duyme M, Dumaret A-C, Tomkiewicz S. How can we boost IQs of “dull children”?: A late adoption study. Proc Natl Acad Sci USA. 1999; 96(15):8790–4. PMID:10411954
19. Chan RC, Shum D, Toulopoulou T, Chen EY. Assessment of executive functions: Review of instru-ments and identification of critical issues. Arch Clin Neuropsychol. 2008; 23(2):201–16.https://doi.org/ 10.1016/j.acn.2007.08.010PMID:18096360
20. Tang M, Chen Y, Krewski D. Gender-related differences in the association between socioeconomic sta-tus and self-reported diabetes. Int J Epidemiol. 2003; 32(3):381–5. PMID:12777423
21. Camp BW, Broman SH, Nichols PL, Leff M. Maternal and neonatal risk factors for mental retardation: defining the ‘at-risk’child. Early Hum Dev. 1998; 50(2):159–73. PMID:9483389
22. Leonard H, Wen X. The epidemiology of mental retardation: challenges and opportunities in the new millennium. Ment Retard Dev Disabil Res Rev. 2002; 8(3):117–34.https://doi.org/10.1002/mrdd.10031 PMID:12216056
23. Lee J, Lee JS, Park S-H, Shin SA, Kim K. Cohort Profile: The National Health Insurance Service– National Sample Cohort (NHIS-NSC), South Korea. Int J Epidemiol. 2017; 46(2):e15–e.https://doi.org/ 10.1093/ije/dyv319PMID:26822938
24. Cochran WG. Sampling Techniques, 3rd edn. New York, NY: Wiley; 1977.
25. Kwon J. Diagnostic Evaluation and Rehabilitation in Children with Intellectual Disabilities. J Korean Med Sci 2009; 52(6):601–10.
26. Grosse SD, Van Vliet G. Prevention of intellectual disability through screening for congenital hypothy-roidism: how much and at what level? Arch Dis Child. 2011; 96(4):374–9.https://doi.org/10.1136/adc. 2010.190280PMID:21242230
27. LaFranchi SH. Approach to the diagnosis and treatment of neonatal hypothyroidism. The Journal of clin-ical endocrinology and metabolism. 2011; 96(10):2959–67.https://doi.org/10.1210/jc.2011-1175PMID: 21976744
28. Gru¨ters A, Krude H. Detection and treatment of congenital hypothyroidism. Nat Rev Endocrinol. 2012; 8 (2):104–13.
29. Boyle CA, Boulet S, Schieve LA, Cohen RA, Blumberg SJ, Yeargin-Allsopp M, et al. Trends in the prev-alence of developmental disabilities in US children, 1997–2008. Pediatrics. 2011; 127(6):1034–42. https://doi.org/10.1542/peds.2010-2989PMID:21606152
30. Kuo-Tai T. Mentally retarded persons in the People’s Republic of China: review of epidemiological stud-ies and services. Am J Ment Retard. 1988; 93:193–9. PMID:3262360
31. Spencer N, Bambang S, Logan S, Gill L. Socioeconomic status and birth weight: comparison of an area-based measure with the Registrar General’s social class. J Epidemiol Community Health. 1999; 53(8):495–8. PMID:10562868
32. Haddow JE, Palomaki GE, Allan WC, Williams JR, Knight GJ, Gagnon J, et al. Maternal thyroid defi-ciency during pregnancy and subsequent neuropsychological development of the child. N Engl J Med. 1999; 341(8):549–55.https://doi.org/10.1056/NEJM199908193410801PMID:10451459
33. Badawi N, Kurinczuk JJ, Mackenzie CL, Keogh JM, Burton PR, Pemberton PJ, et al. Maternal thyroid disease: a risk factor for newborn encephalopathy in term infants. BJOG. 2000; 107(6):798–801. PMID: 10847239
34. Larson K, Halfon N. Family income gradients in the health and health care access of US children. Matern Child Health J. 2010; 14(3):332–42.https://doi.org/10.1007/s10995-009-0477-yPMID: 19499315
35. Bradley RH, Corwyn RF. Socioeconomic status and child development. Annu Rev Psychol. 2002; 53 (1):371–99.
36. Blackburn C, Read J, Spencer N. Can we count them? Scoping data sources on disabled children and their households in the UK. Child: care, health and development. 2007; 33(3):291–5.