저작자표시-비영리-변경금지 2.0 대한민국 이용자는 아래의 조건을 따르는 경우에 한하여 자유롭게 l 이 저작물을 복제, 배포, 전송, 전시, 공연 및 방송할 수 있습니다. 다음과 같은 조건을 따라야 합니다: l 귀하는, 이 저작물의 재이용이나 배포의 경우, 이 저작물에 적용된 이용허락조건 을 명확하게 나타내어야 합니다. l 저작권자로부터 별도의 허가를 받으면 이러한 조건들은 적용되지 않습니다. 저작권법에 따른 이용자의 권리는 위의 내용에 의하여 영향을 받지 않습니다. 이것은 이용허락규약(Legal Code)을 이해하기 쉽게 요약한 것입니다. Disclaimer 저작자표시. 귀하는 원저작자를 표시하여야 합니다. 비영리. 귀하는 이 저작물을 영리 목적으로 이용할 수 없습니다. 변경금지. 귀하는 이 저작물을 개작, 변형 또는 가공할 수 없습니다.
Master Thesis of Forest Environmental Science
Local People Participation in
Mangrove Restoration Projects:
Impacts on Social Capital
and Livelihood
-A Case Study in the Philippines-
지역주민의 맹그로브 복원사업 참여 :
사회적 자본과 생계수단에 미치는 영향
-필리핀 사례를 중심으로-
August 2019
Graduate School
Seoul National University
Department of Forest Sciences
Local People Participation in
Mangrove Restoration Projects:
Impacts on Social Capital and
Livelihood
-A Case Study in the Philippines-
A Thesis as a Partial Requirement for
Master of Science Degree in
Forest Environmental Science
Graduate School
Seoul National University
Department of Forest Science
Submitted by
Roswin B. Valenzuela
August 2019
Under the Supervision of
Professor YOUN Yeo-Chang
Approved by the Examining Committee:
Chair
PARK Mi-Sun
(Seal)
Vice Chair
YOUN Yeo-Chang
(Seal)
i
Abstract
Climate change is a global problem caused by cumulative actions of multi-level actors; hence, solving the climate change problem requires collective action. Networks have been created to establish cooperation and collaboration between multi-level stakeholders; this facilitates the exchange of knowledge and strengthens the cooperation between countries and stakeholders. Cooperation is not only relevant for actions against climate change, but it also contributes to the development of the local communities by increasing their social capital through their involvement and participation in climate change mitigation projects. Through social relations, local communities expand their assets which are relevant to gaining more economic profits. This study assessed the impacts of local community participation in mangrove restoration projects to social capital; and further analyzed its implications people’s access to information and access to services—both variables are essential in improving one’s livelihoods. This study was conducted in the Province of Quezon, Philippines using face-to-face interview as the main method for data collection. The results of this study suggest that participation is beneficial to the local people as it can improve their livelihoods. Their participation increases social capital, consequently, improves their access to information and access to services.
Keywords: mangrove restoration, social capital, local livelihood, participation, Philippines
ii
For Coy, Lyn, and Rolly – my ever-supporting family.
iii
Table of Contents
Abstract ... i
List of Tables ...v
List of Figures... vi
List of Appendices ... vii
Acronyms ... viii
1. Introduction ... 1
1.1. The Problem and Rationale of the Study ... 1
1.2. Research Objectives... 3
1.3. Research Questions and Hypotheses ... 4
1.4. Significance of the Study ... 4
2. Literature Review ... 5
2.1. The Philippine Mangroves ... 5
2.2. People’s Involvement in Forest Management ... 6
2.3. Social Capital ... 9
2.4. Factors Affecting Social Capital ... 11
2.5. The Global Problem and the International Networking ... 15
3. Methodology ... 19
3.1. Conceptual Framework ... 19
3.2. Theoretical Framework ... 20
3.3. The Research Area and the Peoples Organization ... 22
3.4. Data Collection ... 25
3.5. Sampling Method ... 25
3.6. Measuring Social Capital ... 26
3.7. Data Analysis ... 32
4. Results ... 37
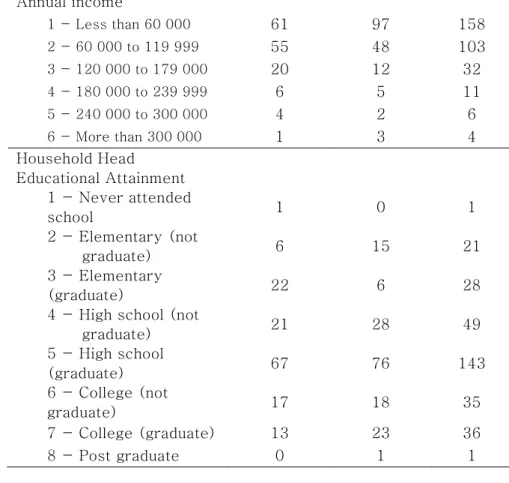
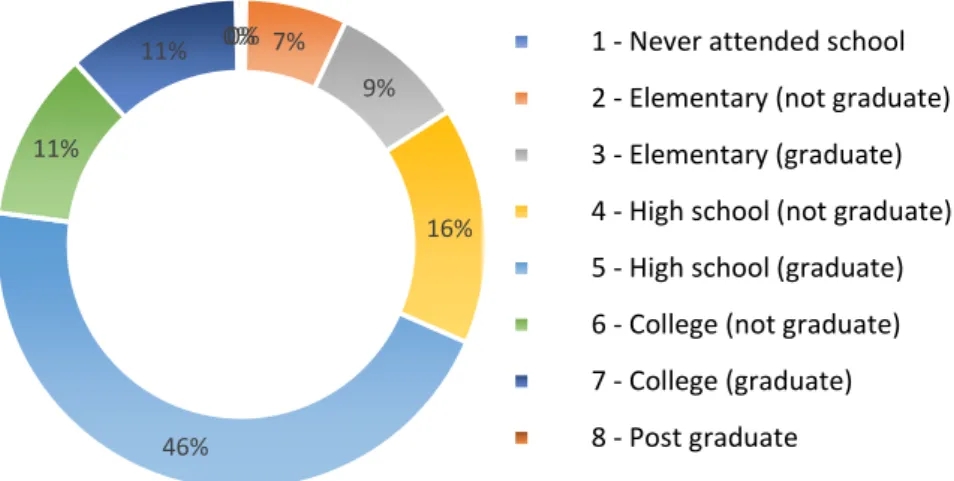
4.1. Socio-Demographic Characteristics ... 37
4.2. Descriptive Statistics ... 39
iv
5. Discussion ... 47
5.1. Impacts of participation to social capital ... 47
5.2. Social capital and access to information... 49
5.3. Social capital and access to services ... 51
6. Conclusion ... 53
6.1. Summary and Key Findings ... 53
6.2. Issues Remaining and Suggestions for Further Studies .... 54
7. Bibliography ... 56
9. Appendices ... 69
9. 국문 초록 ... 75
v
List of Tables
Table Title Page No.
Table 1. Definitions of social capital. 9
Table 2. Empirical researches on social capital. 10 Table 3. Data on population and household size of the
research areas.
23 Table 4. The variables used for the regression analysis 34 Table 5. Demographic characteristics of the
respondents.
37 Table 6. Descriptive statistics of the sampled
households by locations.
41 Table 7. Descriptive statistics of the sampled
households by PO membership.
43 Table 8. Tobit regression model for estimating social
capital (Model 1).
45 Table 9. Linear regression model for estimating access
to information (Model 2).
46 Table 10. Linear regression model for estimating
access to services (Model 3).
vi
List of Figures
Figure Title Page No.
Figure 1. Greenhouse gases emissions by economic sectors.
16 Figure 2. The conceptual model of a multi-level REDD
‘payments for environmental services’ (PES) scheme.
18
Figure 3. The concept of social capital. 20
Figure 4. The theoretical framework on the role of social capital for improvement of livelihoods.
21 Figure 5. The location map of the research areas. 24
Figure 6. Annual income of respondents. 38
vii
List of Appendices
Appendix Title Page No.
Appendix 1. The correlation matrix between the
variables used in the regression analysis. 69 Appendix 2. The interview questionnaire. 70
viii
Acronyms
AFA Alitas Farmers Association BIPCO Binonoan Producers Cooperative
CBFM Community-based Forest Management DA Department of Agriculture
DOST Department of Science and Technology
DOT Department of Tourism
DTI Department of Trade and Industry NGP National Greening Program
PES Payment for Environmental Services PO / POs People’s Organization/s
REDD+ Reducing Emissions from Deforestation and forest Degradation
1
1. Introduction
1.1. The Problem and Rationale of the Study
Participatory management is one of the key strategies for natural resource protection and conservation adopted by many countries. It recognizes the need to address social and environmental components collectively as one affects the other (Adams & Hutton, 2007; Porter-Bolland et al., 2012). The participatory approach further acknowledges the local communities and its people as the cornerstone of its management strategies; hence, their participation is essential and crucial to its success. However, the active participation of the local people is contingent to the provision of incentives and benefits (Agrawal & Gupta, 2005; Cuenca, Robalino, Arriagada, & Echeverrı, 2018; Moukrim et al., 2019; Paudyal, Thapa, Neupane, & Kc, 2018; Sirivongs & Tsuchiya, 2012). In contrast, receiving no benefits forfeits the social objective of the participatory forest management; consequently, dissuades participation of the local people.
Participatory approaches, such as community-based strategies, have become a widely accepted approach for forest management worldwide with the assumption that local people would use and manage the forest resources sustainably (Agarwal, 2001; Shrestha & McManus, 2008), and also the case of the Philippines (Lasco, Pulhin, Bugayong, & Mendoza, 2011). Furthermore, the Philippine government have also considered the local communities as the de facto managers and guardians of the forest (J. M Pulhin, Inoue, & Enters, 2007). The Department of Environment and Natural Resources (hereinafter referred to as DENR), the leading agency handling environmental concerns in the Philippines, have further reinforced the role of the local community participation in forest management and in actions against climate change. The country has also emphasized the inclusion of the local communities in the Reducing Emissions from Deforestation and Forest Degradation (hereinafter referred to as REDD+) projects (DENR-FMB, 2012, 2016) and in their National Safeguard Strategy (DENR-FMB, 2016).
2
In theory, the participatory approach would lead to a “ win-win ” result: environmental sustainability and social development; however, its on-site implementation encountered several constraints and yields to unsuccessful results (i.e. Karki, 2013; Mannigel, 2008; Méndez-López, García-Frapolli, Ruiz-Mallén, Porter-Bolland, & Reyes-Garcia, 2015). The provision of benefits and incentives for local communities seems to be problematic as well (Agrawal & Gupta, 2005; Fox & Cundill, 2018). Furthermore, the local communities and their dependency to forest resources have also caused major problems to forest. A study in the Philippines was conducted to determine the drivers of deforestation and forest degradation as part of the REDD+ project implementation. The result of the study revealed that local communities and their activities are among the major causes of deforestation and forest degradation (DENR-FMB, 2016). Carandang (2006) pointed-out the people’s poverty in the Philippines have pushed them to rely heavily on the forest that have created such environmental problems. The United Nations (1987) Brundtland Report have also indicated this concern for the international cases. This highlights the interrelation of the environmental and social problems; therefore, it can be argued that an optimal solution to deforestation and forest degradation must cover both environmental and social elements. For this reason, this study looked at the impacts of participation in natural resource management to people’s social capital. We further argued that the increase in social capital would lead to increase access to other forms of capital (Flap, 1989) that will motivate people to continually be involved in resource conservation and management projects, hence, providing a sustainable social-environmental solutions. The development of social capital may lead to improve the communities ’ and the people ’ s livelihood towards further development—a key factor for to reduce forest dependency which may lead to deforestation and forest degradation.
This research tries to shed light on these problematic on-site situations in the participatory management by conducting a case study in the Philippines. Particularly, this research focused on the intangible impacts of the participation, specifically, the effects to social capital, access to information, and access to services, as these may motivate people to participate in resource management.
3
Social capital covers more than people’s connections and engagements with other actors. Bourdieu (1986), Lin (2001), and Portes (1998) have argued that social capital also includes the people’s access to resources owned by the actors within one’s social networks—the embedded resources. Portes (1998) defined social capital as the “assets gained through membership in networks.”These theoretical definitions of social capital have led the researchers to hypothesize that the increase in social capital would lead to the increase in access to information and access to services which are essential in enhancing one ’ s livelihood. Offering social capital as an incentive may have greater impacts, in comparison to other tangible incentives, in terms of improving a person ’ s overall well-being as its development also enhances the accumulation of other forms of capitals (Flap, 1989). From the perspective of the poor, the increase in the access and the ownership of assets provides better means and more alternatives to get resources for people ’s needs and subsistence. These conditions are favorable for environmental protection and conservation as it diminishes the dependency of people to natural resources which have been identified as a major driver of deforestation and forest degradation.
1.2. Research Objectives
The general objective of this research is to understand how participation in natural resource management projects affects the local people. Specifically, the study aims to achieve the following: 1. to determine the effects of participation in natural resource management on the social capital of the local people; and,
2. to determine the impacts of social capital to people’s access to information and access to services.
4
1.3. Research Questions and Hypotheses
1. Does participation in natural resource management increases the social capital?
Hypothesis #1: Participation in natural resource
management increases social capital.
2. Does the increase of social capital increases access to resources and services, and the access to information in the community?
Hypothesis #2: The increase in social capital improves
people’s access to information and access to services.
1.4. Significance of the Study
This study can contribute to the improvement of the management of forest resources; specifically, through participatory management approach. Furthermore, this study is very timely due to the increasing recognition of forests in actions for mitigating climate change; on the other hand, deforestation and forest degradation exacerbate the climate change problem. Combined with the agriculture, and other land use (AFOLU) sector, it ranks second in terms total carbon contributions (Smith et al., 2015; Victor et al., 2014). This highlights the major importance of forest and its sustainable management in our battle against climate change.
5
2.
Literature Review
2.1. The Philippine Mangroves
The country has lost a significant amount of mangrove areas from 1918 (half a million hectares) to 1994 (120 000 hectares) (Primavera & Esteban, 2008; Primavera, 2000). The decrease of mangrove areas was mainly caused by the development of aquaculture farms and overharvesting of mangroves for fuelwood use (Primavera, 2000; Pulhin, Gevaña, & Pulhin, 2017). The conflicting policies of mangrove land-use had also worsened the problems on mangrove cover loss (Friess et al., 2016; Pulhin et al., 2017). In addition to this, very few initiatives were made by the Philippine government to protect the mangrove forests; not until the 1970s, when the ecological benefits were realized (Buitre, Zhang, & Lin, 2019). As response, revisions on the forestlands zoning were made to strengthen the management and the conservation of the mangrove areas in the 1980s ( Primavera, 2000). New legislations were also enacted, such as the Republic Act 7161 or Act of Incorporating Certain Sections of the National Revenue Code in 1991 and the Section 71 of Republic Act 7161 that bans commercial cutting of all mangrove species for timber or firewood, to support these management strategies (Pulhin et al., 2017). Furthermore, through the enactment of Executive Order No. 263 (Community-Based Forest Management), participatory management became a key approach in ensuring sustainability of the forestland resources (Primavera & Esteban, 2008). This had also led to the recognition of the role of the local communities in the mangrove ecosystems protection, conservation, and management.
However, the need for a more intensive restoration of the mangrove ecosystems was highly realized following the occurrence of the super typhoon Haiyan (“Yolanda”) in the year 2013 (Panay News, 2017) that killed more than 6000 people in the Philippines (Bueza, 2016). This has led for the government to implement the Mangrove and Beach Forest Development
6
Project (MBFDP), as part of the National Greening Program, that aims to restore mangrove areas in the country in collaboration with the local government units, private sectors, non-government organization, and other concerned stakeholders (DENR-R6, 2019). The role of the local communities was also emphasized in the MBFDP where local groups were contracted in the restoration of the lost mangrove areas.
These initiatives, along with the strengthened policies on resource management, have led to the decline in the rate of mangrove deforestation in the country (Pulhin et al., 2017). The 2015 Philippine Forestry Statistics also shows that mangrove forest cover in the country have reached more than 300 000 hectares (DENR-FMB, 2017a). The local communities and their role as co-stewards of mangrove ecosystems have also contributed to the success of its management and restoration (Gevaña, Camacho, & Pulhin, 2018). The Philippine government has put high regards to the local communities as their partners in managing the forests and mangrove resources (Walters, 2004).
2.2. People
’s Involvement in Forest Management
The governance of forest has adopted participatory approaches in the belief that this strategy would yield to environmental sustainability while also accounting for social concerns (Agarwal, 2001; Fox & Cundill, 2018; Karki, 2013; Mannigel, 2008). This shift, from direct control management by the government, does not only represent the involvement of the local communities in forest management, but also created an avenue for power distribution from a top-down standpoint to a more bottom-up system (Agarwal, 2001). Research findings have also served as proofs that the long-standing strict and exclusionary conservation caused pressures to local communities such as displacement and restriction of the use of resources (Adams & Hutton, 2007; Eriksson, Johansson, & Blicharska, 2019; Fox & Cundill, 2018; Lele, Wilshusen, Brockington, Seidler, & Bawa, 2010). On the other hand, participatory management—a more people-centered approach—in theory, would produce “ win-win ” results: a strategy for
7
resource protection and conservation, as well as, for delivering benefits to local communities (development, financial assistance, empowerment) and for the legal opportunities to use and harvest resources in supposedly sustainable way (Adams & Hutton, 2007; Porter-Bolland et al., 2012).
The potentials of the participatory management have led countries to adopt this strategy; however, even with its worldwide recognition, deforestation still is a major concern, as shown by the decreasing worldwide forest cover (World Bank, n.d.). In addition, the implementation of the participatory scheme has its own predicaments in which several cases have yielded unsuccessful results. Other cases of participatory forest management have even resulted to conflicts between the forest managers and the local communities (e.g. Karki, 2013; Mannigel, 2008; Méndez-López, García-Frapolli, Ruiz-Mallén, Porter-Bolland, & Reyes-Garcia, 2015). The provision of benefits and incentives for local communities seems to be problematic as well (Agrawal & Gupta, 2005; Fox & Cundill, 2018). These circumstances may have led to diminish the participation of the local communities resulting to the failure of the participatory approach.
The cornerstone of the participatory approach are the local communities and their participation is crucial for its success. Stimulating active participation from the local communities requires the provision of incentives such as financial assistance, empowerment, livelihood sources, and development programs (Agrawal & Gupta, 2005; Cuenca et al., 2018; Moukrim et al., 2019; Paudyal et al., 2018; Sirivongs & Tsuchiya, 2012). Furthermore, there is a spillover effect on the incentives and benefits beyond to those who participate, therefore participation also benefits the community in achieving development (Adams & Hutton, 2007; Agarwal, 2001; Agrawal & Gupta, 2005). In contrast, receiving no benefits forfeits the social objective of the participatory forest management and dissuades people from participating. The studies of Cao, Wang, Song, Chen, & Feng (2010) and Cao, Wang, & Wang (2009) have stressed that the sudden and untimely discontinuation of the provision of benefits could cause the local people to revert to their old unsustainable practices in forest product utilization. However, it is important to understand that a perpetual supply of
8
benefits for the people is irrational and inefficient; the benefits from participation should function as a means to improve people ’s capacities and capabilities to achieve reliance and self-governance in able to realize sustainability.
Participatory management recognizes that social and environmental components should be collectively addressed as one affects the other. Focusing on forest management, forest-dependent people has been identified as a major driver of deforestation and forest degradation problems (DENR-FMB, 2017; Le, Smith, Herbohn, & Harrison, 2012; Situmorang, 2018). Newton, Miller, Augustine, Byenkya, & Agrawal (2016) described forest-dependent people as the “human populations that derive benefits from forests in some way…and is often used to refer to rural people living in poverty, including indigenous and traditional people, in substantially-forested developing countries. ” Their participation in forest management would increase the effectiveness of the participatory approach as it addresses overreliance to forest resources. Furthermore, the benefits from their participation in forest management provide the alternatives for their needs and sources of livelihoods. Characteristically, as Newton et al. (2016) have referred, forest-dependent people commonly refers to people in rural areas under poverty. The World Bank (2001) has described the poor as those who are lacking in freedom, choices, and resources to improve their own well-being, and are deprived of assets, resources, and rights to make their lives better—based from the book Development as Freedom by Amartya Sen (1999) that construed poverty as people ’ s freedom to processes and opportunities. World Bank (2001) report also explained the causes of poverty from the perspective of the poor: “(1) the lack of income and assets to attain basic necessities; (2) the sense of voicelessness and powerlessness in the institutions of state and society; and, (3) vulnerability to adverse shocks, linked to an inability to cope with them,” which Sen referred to as the unfreedoms. Having no (or limited) opportunities, the poor are forced to rely on the forest resources (Gray & Moseley, 2005; Jannat, Hossain, Uddin, & Hossain, 2018; Jehan & Umana, 2003; Kumar, 2002; Nhem, Lee, & Phin, 2018; Ostrom, Burger, Field, Norgaard, & Policansky, 1999; Sundar, 2019; United Nations, 1987). On the other hand, providing a more and better opportunities can create alternatives for forest-dependent
9
people, whilst, putting less pressure to forest resources and contributing to its conservation.
2.3. Social Capital
The concept of social capital centers on people ’ s relationships and engagement between actors. Definitions of social capital proposed by different scholars are presented in table 1. In these definitions, social capital focuses more on the assets more than the social relations per se and highlight two main points. First, social capital is produced by building social relationships with others; meaning it requires having at least two actors to build social capital. Secondly, social relations function as investments to gain more resources that can further the opportunities and benefits of the individual or the group towards their development. These points cover the two dimensions of the social capital which were highlighted in this research: the social relations and the embedded resources.
Table 1. Definitions of social capital.
Social Capital References
“an entity, consisting of all expected future benefits derived, not from one’s own labour, but from connections with other persons.”
Flap (1989) “the connections and relationships
between individuals and/or groups that leads to aggregation of capitals”
Bourdieu (1986) “features of social organization, such as
trust, norms, and networks, that can improve the efficiency of society by facilitating coordinated actions.”
Putnam (1993) “refers to assets gained through
membership in networks.” Portes (1998)
“capitals captured through social relations.”
“resources embedded in social networks accessed and used by actors for actions.”
10
“stock of assets (networks, institutions) that can be drawn upon for productive ends and a flow of assets (social
participation, collective action) aimed at reinforcing existing social capital.”
Tiepoh & Reimer (2004) “the resources available to individuals and
groups through membership in social networks.”
Carrillo Álvarez & Riera Romaní
(2017)
Accumulation of social capital requires building of social relations (ties and networks) with other actors. Social relations can benefit people in two ways: (1) having connections with people that are “ prepared and obliged to provide help and support” (Flap, 1989); and, (2) access to embedded resources owned by the people within their networks (Lin, 2001; Portes, 1998; Putnam, 2000; Teilmann, 2012; Tiepoh & Reimer, 2004). Through these social relations, a person can gain control over resources that he originally does not own (Lin, 2001; Portes, 1998). In Lin's (2001) theory of social capital, he elucidated that each member of a group is recognized as a “custodian of the limits of the group” and each has an influence in the decision making. Accordingly, being a member of a group, a person can influence how the resources can be used to their advantage. From a perspective of a poor, benefits of social capital can improve one’s status in the society as it contributes to improve a person’s recognition as well as to increase his assets (Sen, 1999; World Bank, 2001). Table 2 presents empirical researches on social capital.
Table 2. Empirical researches on social capital. Research findings/conclusions on social
capital Reference
Social capital may positively or negatively affect organizational outcomes in three general courses: (1) increased and/or more complex forms of social capital, reduced; (2) transaction costs; and, (3) organizational advantage.
Hazleton & Kennan (2000)
The study identified that social capital is positively associated with the participation
Gurney et al. (2016)
11
in marine protected area management. In particular, they have determined that being a member of a community organization and their active involvement in decision making increase the probability that the individual will participate in the decentralized
management of common resources. Social capital positively affects the livelihood diversity of the rural people. A person, who is trusted and with good relationship with others, tends to receive more assistance from neighbors and be involved in their activities.
Avila-Foucat & Rodríguez-Robayo (2018) Improvement of social capital of the
community improves management of
tourism projects. It contributes to reducing the level of poverty by improving the economic conditions of the host community.
Prayitno, Sari, & Putri (2019)
Enhancing collaboration and social relationships between government,
grassroots organizations, and communities improve the effectiveness and efficiency of government-implemented projects. Collaboration between groups broadens the solution options for environmental problems, thus, heightens the resiliency of the community against environmental disasters.
Social capital is considered as a factor of collaboration. The study argues that the higher the social capital and the stronger the bond within the community will improve the collaboration with people.
Morris, McNamara, & Belcher (2019)
2.4. Factors Affecting Social Capital
As defined by scholars, social capital are the resources captured from social relations (i.e. Carrillo Álvarez & Riera
12
Romaní, 2017; Portes, 1998). In this regard, the number of ties and networks of a person is a major factor that determines his social capital. However, the increase of the of social relations may not always increase one’s social capital as several factors may affect the amount of resources a person can access through his social relations. This study focused on three factors, namely: (a) diversity of social relations; (b) resource accessibility and social capacity; and, (c) trust.
2.4.1. Social Relations and its Diversity
Theoretically, a larger size of social relations corresponds to having higher social capital as these social relations function as the sources of the embedded resources (Flap, 1989; Teilmann, 2012; Tiepoh & Reimer, 2004; Woolcock & Narayan, 2000). However, as elaborated by Teilmann (2012), “not all ties are similar.” Each tie is different from the other and on the amount of resources and information he possesses, therefore each tie and network impacts to a person also varies. For instance, person A is a member of three local labor organizations in their village while person B, living in the same village, is also a member of three organizations, but of different nature: a local labor organization, a municipal-level organization, and a business group. Ceteris paribus, we can expect that the resources and information accessible to person B, through his social relations, exceeds than of person A albeit both having the same number of networks. The major difference between person A and person B is the homogeneity of their organizations. The organizations of person A, being homogenous, may have provided the same resources and information. On the other hand, person B, having a more heterogenous network, can have access to more diverse resources—i.e. farming tools from the local labor organization, information about the increasing prices of fertilizers for vegetables from the municipal-level group, and financial aid from the business group.
The types of the social relations a person is associated with affects the quantity and the diversity of resources he can access. Two of the most common dichotomous of social relations were provided by Granovetter (1973) and Putnam (2000). Granovetter (1973) differentiated strong ties from weak ties. Strong ties are those relations that are readily available and can
13
be easily established (Granovetter, 1973) and “does not require much maintenance ” (Teilmann, 2012), i.e. family members, friend, and neighbors. Meanwhile, weak ties are the connections that are more distanced (Dasgupta, Putnam, & Dasgupta, 2005; Granovetter, 1973), i.e. business groups and professional connections. Putnam (2000), on the other hand, classified social relations between bonding and bridging. Bonding social capitals are the relationships with the homogenous individuals and groups (closely related to the concept of strong ties) while bridging social capital are the connections with people and groups from other social classes (closely related to the concept of weak ties) (Kay, 2005; Putnam, 2000; Villalonga-Olives & Kawachi, 2015). Even though the linkage and the relationship of actors are stronger in the strong ties and bonding social capital, it may not be enough to produce sufficient benefits, opportunities, and impacts to improve one ’ s condition, for this purpose, it is necessary to establish weak ties and bridging social capital. Furthermore, the work of Woolcock & Narayan (2000) has explained that for the poor, bridging social capital are more important since it lets the poor to “get ahead” by accumulating more resources and better opportunities. Although bonding social capital is also relevant, it can only help them to “get by.”
2.4.2. Resource Accessibility and Social Capacity
Social relations are sources of information and resources; having social relations benefits a person as it increases his assets (Bourdieu, 1986; Lin, 2001). All social relations and social structures can improve one’s social capital (Coleman, 1988), however, just having social relationships may not be sufficient enough to advance one’s condition and status. A person should be able to utilize his social relations for it to be beneficial. As each tie is different, its impacts to a person also varies. Simply put, if person A and person B established connections with group Z, this may not mean that the impacts of group Z to person A and person B is the same or equal. Each person has his own capacity to utilize their established social relations and their embedded resources—the social capacity. Tiepoh & Reimer (2004) defined social capacity as the “ability of rural people to organize and use their social capital and other assets through various social structures and processes to achieve valued economic objectives. ” Lin (2001) also highlighted this concern in his theory of social
14
capital elaborating that the access and use of the social resources are dependent on the ability of the individual. Those people who can use their social relations more effectively are expected to have higher income (Tiepoh & Reimer, 2004).
2.4.3. Trust
“Trust is a basic element of the relational dimension” (Nardone, Sisto, & Lopolito, 2010) and the most essential element of social capital (Kay, 2005). Building and maintaining social relations requires trust (Putnam, 1993a) as people only forms ties with people or organizations they trust. In addition, trust functions as the lubricator for interaction and cooperation between actors (Teilmann, 2012). Groups exhibiting trust to its members can accomplish more compared to those without trust (Coleman, 1988, 1990; Sandefur & Laumann, 1998). Furthermore, trust is necessary to utilize social relations while having no trust depletes the purpose of social capital — contribution and sharing of the embedded resources (Kay, 2005; Portes, 1998). Without trust, a tie cannot be formed as no rational person will cooperate with someone without a proof that he is trustworthy. In Putnam's (1993) classical example of rotating credit association, he elaborated that without proof, the association cannot accept every person who wants to join unless there is a proof that he will pay the contributions and will not quit the after he receives his credit. This is also true at the micro- level, in accepting members of the organization, the person’s trustworthiness matters. This can be proven based on his reputation from other people and from his track record. A person with a good reputation can be trusted (Putnam, 1993a, 2000).
Trust also fortifies the realization of commitments of the people who are part in the social relations. In Coleman's (1988, 1990) expectation-obligation concept, a trusted person is pressured to keep the end of his bargain and to perform what the others expect him to do. Failing to do so might diminish the trust of the other party which can damage their relationship and impede future cooperation. Moreover, trust, when it is mutual to both parties, can result to social solidarity that exists when there is generalized reciprocity and commitment between and among actors in social relations (Sandefur & Laumann, 1998). Social solidarity, as explained by Sandefur and Laumann, can be
15
observed when people are mutually obligated to help those in their networks in the times of need since they also received help from them previously. Repeated engagement and cooperation strengthens trust that reinforces social relations (Dasgupta et al., 2005; Fukuyama, 2001; Putnam, 1993a).
2.5. The Global Problem and the International
Networking
Climate change is a global problem that can adversely affect all people regardless of nationality and country. Solving this problem requires collective action (Ostrom, 2010). As defined by the UNFCCC (1992), it is the “change of climate which is attributed directly or indirectly to human activity that alters the composition of the global atmosphere and which is in addition to natural climate variability observed over comparable time periods.” As a global response, international collaborations have been initiated for the purpose of creating solutions for this dilemma, e.g. the Kyoto Protocol and the Paris Agreement. These agreements aim to combat climate change by reducing national level emissions (Kyoto Protocol, 1998; Paris Agreement, 2015). Furthermore, through different mechanisms and programs, countries were able to work together in able to achieve their national emission targets, e.g. Clean Development Mechanism and International Emissions Trading (UNFCCC, 2012).
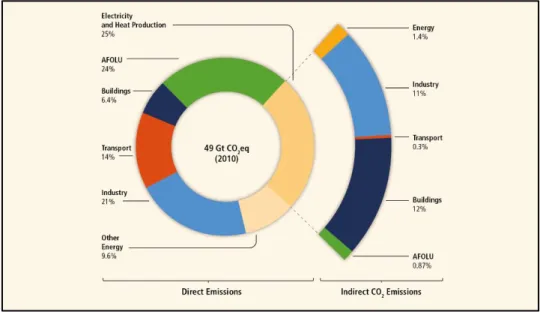
The role of agriculture and forest were also highlighted as major contributors to the global carbon emitted into the atmosphere. The agriculture, forestry, and other land use (AFOLU) sector ranks second in terms total carbon contributions, next only to electricity and heat production sector (Figure 1) (Smith et al., 2015; Victor et al., 2014). Moreover, the loss of forests and its degradation were also recognized as major sources of carbon emissions (Forest Carbon Partnership Facility, 2017; Holloway & Giandomenico, 2009; Smith et al., 2015; UNFCCC, 2012) as it contributes 11% of the total greenhouse gases (UN-REDD Programme, 2016). This incited international programs for the protection, conservation, and reforestation of forest areas as a mitigation measure against climate change. One of the more recognized approaches for this
16
purpose is the reduce emissions from deforestation and forest degradation, popularly known as REDD+. It is a program that credits the actions of the developing countries in reducing their emissions through (a) reducing carbon emissions from deforestation; (b) reducing carbon emissions from forest degradation; (c) conservation of forest carbon stocks; (d) sustainable management of forests; and, (e) enhancement of forest carbon stocks (UN-REDD Programme, 2016).
Source: (Victor et al., 2014)
Figure 1. Greenhouse gases emissions by economic sectors. Negotiations and conferences had become a channel for countries, both developed and developing, to voice-out their stands and be recognized by others. One infamous example happened during the 2005 Conference of the Parties 11 in Montreal, where the governments of Papua New Guinea and Costa Rica requested the agenda for reducing emissions from deforestation in developing countries. This was recognized by the other Parties had become the starting point of REDD+ that acknowledges the role of the developing countries in protecting their forests as part of the mitigation efforts (Holloway & Giandomenico, 2009).
Climate change mitigation projects have also paved the way for establishing connections and networks between countries and players for achieving a common goal. Networking
17
has also created benefits and opportunities for the local-level stakeholders. In the conceptual model of a multi-level REDD payments for environmental services (PES) scheme proposed by Angelsen & Wertz-Kanounnikof (2008), vertical and horizontal networking in REDD can be observed (Figure 2). In vertical networking, the emissions reduction from the sub-national level projects are accredited at the national and international level. Then, the international level offers finance to the national level and is transferred to the sub-national level. This presents benefit transfer to and from the three levels. Meanwhile, in horizontal networking, focusing on the sub-national level, shows the potential of collaboration between land-users, communities, local government, and other local-level players. The establishment of the horizontal connections in REDD+ may strengthen the cooperation between the players that creates further opportunities for them (this will be discussed more in the next part). Aside from financial benefits and strengthening of ties, participation in climate change projects also improves asset ownership of the community and local people, they are also receiving capacity buildings, technology transfer, trainings, as well as livelihood programs (Bayrak & Marafa, 2017; Herr, Blum, Himes-Cornell, & Sutton-Grier, 2019).
18
Source: (Angelsen & Wertz-Kanounnikof, 2008) Figure 2. The conceptual model of a multi-level REDD ‘
19
3.
Methodology
3.1. Conceptual Framework
To this point, we already had established that social capital is more than just ties and networks, but also covers the resources embedded in one’s social relations. Through social relations, resources are being contributed, shared, and become accessible for those who are part of the network (Bourdieu, 1986; Carrillo Álvarez & Riera Romaní, 2017; Lin, 2001; Portes, 1998). Social capital in this study uses the definition by Lin (2001) as the “capitals captured through social relations… with expected returns in the marketplace.” In addition, Nan Lin’s theory of social capital was built with two assumptions: first, “ actions are primarily driven or motivated by the innate need for survival;” and second, “survival is seen as dependent upon the accumulation of valued resources.” From this, we can argue that people build and maintain social relations as they perceive that it is advantageous in accumulating resources and assets. In contrast, people will not engage and maintain their connections if they perceive that it is not beneficial. Furthermore, the theory tacitly suggests that the concept of social capital is understood by its function which was also argued by Coleman (1988). Scholars such as Bourdieu (1986), Flap (1989), and Tiepoh & Reimer (2004) also supports this view and dispute that social capital is a productive asset that facilitates social and economic improvement. People and communities with better network and higher social capital have a higher possibility of achieving better outcomes (Flap, 1989; Harrison, Montgomery, & Jeanty, 2019; Putnam, 1993b; Woolcock & Narayan, 2000). Meanwhile, the absence of social capital and connections have unfavorable consequences (Woolcock & Narayan, 2000). Bourdieu (1986), Coleman, (1988), Flap (1989), and Lin (2001) described social capital as a form of investment in achieving profits and returns by gaining access to more resources. Furthermore, Flap (1989) has emphasized that the investment in social capital must also be seen as investment in other assets since social capital packages other forms of capital. Utilizing social relations makes it feasible to access and mobilize more resources, thus, having a higher
20
possibility of achieving success and progress. The conceptual framework of the study is shown in Figure 3.
Figure 3. The concept of social capital.
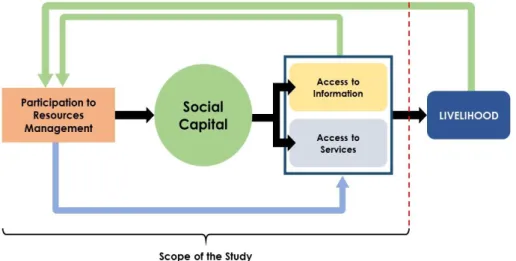
3.2. Theoretical Framework
This study focuses on the impacts of participation in resource management to the development of the community and its local people, specifically social capital and people ’ s livelihoods. The utility of social capital for the improvement of livelihoods is considered as an incentive that can motivate local people to actively and continuously participate in resource management projects. “[P]eople who are better equipped with social capital will be better able to attain their ends” (Flap, 1989). However, creating and maintaining social capital investments (Dasgupta et al., 2005), as well as the utilizing the social networks to gain benefits (Woolcock & Narayan, 2000), incur costs and require investments (Dasgupta et al., 2005; (Woolcock & Narayan, 2000).
21
This study further analyzed the impacts of social capital to the local people ’s livelihoods. Livelihoods, as defined by Farrington (2002), encompasses components beyond financial capital and income. He referred to livelihoods as “ the capabilities, assets (stores, resources, claims and access) and activities required for a means of living. ” However, due to limitations, this study only covered the access to information and the access to services as variables that affect people ’ s livelihoods. “Information is important in providing a basis for action ” (Coleman, 1988). In addition, having access to information improves a person’s opportunity for development, i.e. in seeking a job (Lin, 2001), typhoons and other disasters,
etc. The access to services provides the support for the people to improve their overall capabilities and conditions, such as to improve their health, financial insurance, and literacy. Positive effects of participation and social capital to livelihoods includes improved people ’ s motivation and positive perception in resource management projects; thus, improving their participation in the projects and increasing the possibility of the projects’ success. The theoretical framework of the study is shown in Figure 4.
Figure 4. The theoretical framework on the role of social capital for improvement of livelihoods.
22
3.3. The Research Area and the Peoples
Organization
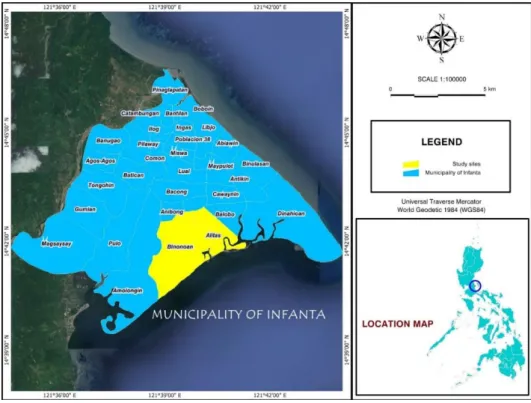
The study was conducted in Brgy. (the abbreviation for Barangay, the smallest political unit in the Philippines) Alitas and Brgy. Binonoan in the municipality of Infanta in the province of Quezon. Infanta lies in the southern part of the main island of the Philippines, about 140 km away from Manila, the capital city. It is situated in the northern part of Quezon mainland lying along the coast of the Pacific Ocean facing the Polillo Island and straddles a portion of the Sierra Madre Mountains. It is comprised of 36 barangays with a total land area of 19 934.2717 ha including 10 817 ha of upland forests and 2 341 ha of mangrove forests (Local Government Unit of Infanta, 2013, 2018).
Brgy. Alitas and Brgy. Binonoan are among the 36 barangays of the municipality of Infanta. Both are classified as rural barangays and are clustered by the municipality under estuarine ecosystem with mangroves and Nipa swamps common in the area; Brgy. Alitas has 519.2 ha (320.06 ha under protection zone) of mangrove areas while Brgy. Binonoan has 460.2 ha (203.97 ha under protection zone). Both barangays also have forest lands within their political boundary with Brgy. Alitas having 353 ha while Brgy. Binonoan having 298 ha (Local Government Unit of Infanta, 2013, 2018).
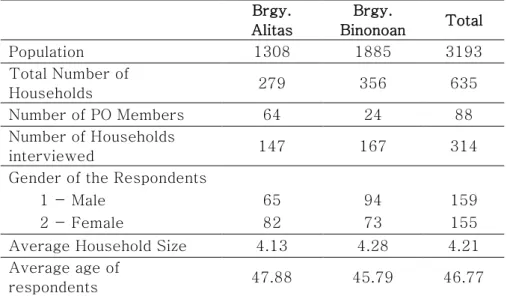
Based from the 2016 national census, Brgy. Alitas has a total population of 1 308 people living in 279 households. Its population increased by 2.91% from 2011 to 2016. Meanwhile, Brgy. Binonoan has a total population of 1 885 people living in 356 households. The population growth rate from 2011 to 2016 is 2.63%. In both barangays, the main sources of income are jobs related to farming, forestry, and fishing, and being contracted as laborers and unskilled laborers (Local Government Unit of Infanta, 2013, 2018). Population and household data of the two barangays are presented in Table 3.
23
Table 3. Data on population and household size of the research areas. Population Number of Families Number of Household Growth Rate (2011-2016) Brgy. Alitas 1308 317 279 2.91% Brgy. Binonoan 1885 448 356 2.63%
Both barangays are home to a People ’s Organization (hereinafter referred to as PO), Brgy. Alitas has the Alitas Farmers Association (AFA) while Brgy. Binonoan has the Binonoan Producers Cooperative (BIPCO). The two POs started as groups cooperating with a federation in Infanta to fight against private groups and individuals illegally taking over mangrove areas and converting it to fish ponds. These illegal activities had caused the decline of the fishes caught by the local people affecting their day-to-day livelihood since it is one of their main sources of income in the area. After that incident in 2013, both groups were formally formed as POs each handling their own projects in collaboration with the local government and different government agencies such as the DENR, Department of Agriculture (DA), Department of Tourism (DOT), and the Department of Trade and Industry (DTI).
The two POs have also been involved in reforestation and restoration projects. They took part in the National Greening Program (hereinafter referred to as NGP), a massive reforestation program under the Aquino Administration that aimed to plant 1.5 billion trees in 1.5 million-hectare lands in the country that started in 2011. Both organizations focused their reforestation and restoration projects in mangrove areas. They also created monitoring teams to guard their project areas from people who cut and harvest mangroves. Mangroves of Infanta were heavily used for its capacity to burn longer compared to ordinary timber resulting in massive deforestation of mangroves in Infanta. Making the problem worse is the wine industry in the province that still uses traditional method of winemaking— relying heavily on woods for cooking their wine. The wine distilleries use mangroves as a better alternative to woods. Furthermore, both People’s Organization actively promotes the
24
use of rice hull as an alternative in for the mangroves as the main heat production material in wine production.
The AFA and BIPCO have also expanded their projects and government involvement outside environmental protection and restoration programs. Both POs are currently implementing projects that focus on livelihood development. Among these programs include wine distillery, sugar production from Nipa palms, and ecotourism development projects. The AFA has also started their mushroom production program in collaboration with the DTI, the DA, and the municipal government of Infanta. Meanwhile, the BIPCO had created their own winery store that produces nipanog (natural wine from Nipa) and red wine in partnership with the Southern Luzon State University (SLSU) and the Department of Science and Technology (DOST).
25
3.4. Data Collection
Face-to-face interview using a semi-structured questionnaire (Appendix 1) was the main mode of data collection for this research. In addition, key-informant interviews were carried-out for a more detailed discussion and for better understanding of the situations in the research areas. Reports provided by the POs, the barangay offices, the local government unit of the municipality of Infanta, and the DENR-Community Environment and Natural Resources Office of Real were used as sources for secondary data.
Preparatory meetings, consultations, and coordination were done during November 2018. The meetings were attended by government officials and selected residents of the two barangays. Free, prior, and informed consent was also confirmed during these meetings. Meanwhile, the actual data collection was conducted from the third week of December 2018 until the second week of January 2019. Face-to-face interviews were done with the support of hired enumerators. The enumerators were recommended by the barangay officials as well as the presidents of the POs and have prior experiences in conducting interviews. The enumerators underwent briefing and training from the research team about the questions in the survey and for the pointers in conducting the interview. Each of the questionnaires was checked and reviewed by the research team.
3.5. Sampling Method
The formula developed by Cochran (1953) was used to determine the representative sample size of households to be interviewed. Two formulas were used for the computation (1) the general formula to compute the sample size proportion; and, (2) the formula for the finite proportion correction for proportions (Israel, n.d.). Formulas are shown below.
n˳ = 𝑍²𝑝𝑞 𝑒² (1)
26 where: n˳is the sample size
Z2 is the abscissa of the normal curve that cuts off
an area at the tails (1 - a equals the desired confidence level, e.g., 95%)
e is the desired level of precision
p is the estimated proportion of an attribute that is present in the population
q is 1 less p
For the computation of the sample size proportion, the confidence level was set at 95% and precision at ± 5%. Furthermore, it was assumed that p is at maximum variability (0.5). Z is equal to 1.96. Using the formula, and with the stated conditions, it was determined that the minimum number of samples to represent the population is 385 (n˳).
n = 𝑛˳
1+ 𝑛˳−1
𝑁
(2) where: n is the sample size
n˳is the sample size proportion
N is the population size
There is a total of 635 households in the study area: 279 from Brgy. Alitas and 356 from Brgy. Binonoan (Local Government Unit of Infanta, 2018). From key informant interviews, it was determined that there are 88 members of the PO: 64 from Brgy. Alitas; and, 24 from Brgy. Binonoan. Therefore, the total size of the population not involved in mangrove restoration programs is 547. Applying the formula, it was determined that 226 households are needed to be interviewed for the study. Random sampling was used to select 226 non-member households from the two barangays. Meanwhile, all 88 members of the PO were interviewed. In total, 314 households were surveyed.
3.6. Measuring Social Capital
This research adopts theoretical definition of social capital as the embedded resources captured by building social relations
27
(Bourdieu, 1986; Carrillo Álvarez & Riera Romaní, 2017; Lin, 2001). This research also recognized the two components of the social capital theory proposed by Lin (2001): first, “resources embedded in social relations rather than individuals; ” and secondly, the “access and use of such resources reside with actors.” Furthermore, three main components were used to compute for the level of social capital, namely: ties, embedded resources, and trust. Ties covers Lin’s first component of social capital while the embedded resources cover the second component. Trust emphasizes the significance of trust in social capital.
3.6.1. The Social Capital Formula
This research developed Formula 3 for the computation of the social capital. The computed value ranges from 0 to 1, where the values closer to 1 represents a higher level of social capital.
Social Capital =
𝑻𝒊𝒆𝒔 𝑽𝒂𝒍𝒖𝒆 × 𝑬𝒎𝒃𝒆𝒅𝒅𝒆𝒅 𝑹𝒆𝒔𝒐𝒖𝒓𝒄𝒆𝒔 𝑽𝒂𝒍𝒖𝒆 × 𝑻𝒓𝒖𝒔𝒕 𝑽𝒂𝒍𝒖𝒆
(3)
It is important to point out that several respondents obtained a computed social capital value of 0, this however, does not reflect that these respondents do not have networks. In a general, social capital includes any form of social connections that includes neighbors, family, and friends. However, this research focuses on the social relations that has actual and potential impacts to people’s livelihood; for this reason, not all social relations were covered.
3.6.2. Ties Value – covers the concept of social relations.
Resources are captured through the establishment of connection with other individuals or groups (Lin, 2001). Without ties, there is neither a network nor social capital, thus, there would be no embedded resources. Ties value was computed using the Formula 4. The computed ties value ranges from 0 to 1, where values closer to 1 represent the higher merits.
28
Ties Value = 𝑻𝒊𝒆𝒔 + 𝑫𝒊𝒗𝒆𝒓𝒔𝒊𝒕𝒚 𝒐𝒇 𝑻𝒊𝒆𝒔
𝟐 (4) where;
a. Ties – the size of networks matter (Bourdieu, 1986; Kay, 2005) as the number of the ties and networks may represent sources of resources one can have access to (Bourdieu, 1986; Lin, 2001). The increase in the number of ties may also increase the collectively-owned resources the individual can access. Flap (1989) further elaborated that the number of ties represents the people and groups “prepared and are obliged” to provide help. To determine the number of ties, the respondents list all his organizations, associations, or companies they have connections. The number of ties is equal to the number of the respondent’s affiliation. In this study, the highest number of ties of a respondent is 8 (the maximum actual number of ties).
Ties = 𝐧𝐮𝐦𝐛𝐞𝐫 𝐨𝐟 𝐭𝐢𝐞𝐬
𝒎𝒂𝒙𝒊𝒎𝒖𝒎 𝒂𝒄𝒕𝒖𝒂𝒍 𝒏𝒖𝒎𝒃𝒆𝒓 𝒐𝒇 𝒕𝒊𝒆𝒔 (5)
b. Diversity of the ties – “a more diverse composition of ties
is positive for the accumulation of social capital ” (Teilmann, 2012). Each tie owns a particular kind of assets; consequently, a more diversified ties/networks creates access to a more diversified forms of resources and assets. Furthermore, the diversity of the ties represents the sources of information. Each tie was classified into five categories: (1) local association; (2) local businesses; (3) municipality level association; (4) professional association; and, (5) national level association. The diversity of the ties was measured by the number of different kinds of tie of each respondent. The maximum diversity of ties is equal to 5 since there are 5 classifications of ties.
Diversity of the ties = 𝐝𝐢𝐟𝐟𝐞𝐫𝐞𝐧𝐭 𝐤𝐢𝐧𝐝𝐬 𝐨𝐟 𝐭𝐢𝐞𝐬
29
3.6.3. Embedded Resources Value – represents the actual and
potential resources accessible to the respondents through their social relations. Embedded Resources Value was computed using Formula 8. Computed values range from 0 to 1, where values closer to 1 represent the higher merits. Embedded Resources Value = 𝑮𝑬𝑺𝑴 + 𝑨𝑬𝑹
𝟐 (7) where;
a. General economic status of the members (GESM) – one of
the key points on the definition of social capital proposed by Lin (2001) is the access to the resources embedded in the social relations. The amount of the resources possess by the individuals and groups in one’s social relations is a major factor in one’s social capital (Bourdieu, 1986) as these resources are the embedded resources they can potentially gain. GESM was measured through the respondent ’ s perception on the amount of resources owned by the members of their social relations using a 5-level Likert scale: 1 – very low; 2 – low; 3 – average; 4 – high; and, 5 – very high. The max possible weight of the perceived resource ownership is equal to 5. General economic status of the members is represented by the sum of all the weight of resource ownership by the members of the respondents’ social relations.
GESM =
𝜮 𝒘𝒆𝒊𝒈𝒉𝒕𝒔 𝒐𝒇 𝒑𝒆𝒓𝒄𝒆𝒊𝒗𝒆𝒅 𝒓𝒆𝒔𝒐𝒖𝒓𝒄𝒆 𝒐𝒘𝒏𝒆𝒓𝒔𝒉𝒊𝒑 𝒏𝒖𝒎𝒃𝒆𝒓 𝒐𝒇 𝒕𝒊𝒆𝒔
𝒎𝒂𝒙 𝒑𝒐𝒔𝒔𝒊𝒃𝒍𝒆 𝒘𝒆𝒊𝒈𝒉𝒕 𝒐𝒇 𝒑𝒆𝒓𝒄𝒆𝒊𝒗𝒆𝒅 𝒓𝒆𝒔𝒐𝒖𝒓𝒄𝒆 𝒐𝒘𝒏𝒆𝒓𝒔𝒉𝒊𝒑 (8)
This research assumes that people’s perception about the economic status of members of their group reflects the ceiling of the resources they can have access or borrow. People’s perception and the actual resources embedded on the members may have discrepancy; however, it can be argued that only those resources which are perceived to be owned by the members are the only resources people can have access to, but still depends on the discretion of the resource ’ s owner. Without the knowledge that their members own the particular resources, individuals cannot access or borrow these resources.
30
b. Access to the embedded resources (AER) – this relates
to the second component of the social capital concept of Lin (2001) and to social capability. Building ties with wealthy people and groups are not sufficient enough to impact a person’s life, what truly matters is whether the person can access the resources embedded to the people and groups whom they established connections with. Mobilizing these resources could lead to development and the person ’ s advancement (Lin, 2001). AER was measured using a 5-level Likert scale: 1 – very low; 2 – low; 3 – average; 4 – high; and, 5 – very high. Respondents were asked the level in which they can access and use the resources of their organizations and is owned by its members. The max possible weight of access to resources is equal to 5.
AER =
𝜮 𝒘𝒆𝒊𝒈𝒉𝒕𝒔 𝒐𝒇 𝒂𝒄𝒄𝒆𝒔𝒔 𝒕𝒐 𝒕𝒉𝒆 𝒆𝒎𝒃𝒆𝒅𝒅𝒆𝒅 𝒓𝒆𝒔𝒐𝒖𝒓𝒄𝒆𝒔 𝒏𝒖𝒎𝒃𝒆𝒓 𝒐𝒇 𝒕𝒊𝒆𝒔
𝒎𝒂𝒙 𝒑𝒐𝒔𝒔𝒊𝒃𝒍𝒆 𝒘𝒆𝒊𝒈𝒉𝒕 𝒐𝒇 𝒂𝒄𝒄𝒆𝒔𝒔 𝒕𝒐 𝒓𝒆𝒔𝒐𝒖𝒓𝒄𝒆𝒔 (9)
3.6.4. Trust Value – Trust between actors is a requisite for
working together; without it, cooperation and reciprocity may not exist (Coleman, 1988; Putnam, 2000; Teilmann, 2012). Trust is significant in building, strengthening, and maintaining social relationships. Consequently, in having no trust, there is a less possibility of (strong) engagement and networking; in turn, there is a less chance of creating opportunities and producing profits that go with the creation of social ties. Trust value was computed using Formula 12 with computed values ranging from 0 to 1 and those that are closer to 1 represents the higher merits. Trust Value = 𝑻𝒓𝒖𝒔𝒕 𝒕𝒐 𝒕𝒉𝒆 𝒕𝒊𝒆𝒔 + 𝑷𝒂𝒓𝒕𝒊𝒄𝒊𝒑𝒂𝒕𝒊𝒐𝒏 𝒕𝒐 𝒔𝒐𝒄𝒊𝒂𝒍 𝒕𝒊𝒆𝒔
𝟐 (10) where;
a. Trust to ties – signifies the person’s level of trust with
his current ties. This represents the possibility to continue working and maintain his social relations. This was measured using a 5-level Likert scale: 1 – very low; 2 – low; 3 – average; 4 – high; and, 5 – very high. The max possible weight of current ties is equal to 5.
31 Trust to the ties =
𝜮 𝒘𝒆𝒊𝒈𝒉𝒕𝒔 𝒐𝒇 𝒕𝒓𝒖𝒔𝒕 𝒕𝒐 𝒕𝒊𝒆𝒔 𝒏𝒖𝒎𝒃𝒆𝒓 𝒐𝒇 𝒕𝒊𝒆𝒔
𝒎𝒂𝒙 𝒑𝒐𝒔𝒔𝒊𝒃𝒍𝒆 𝒘𝒆𝒊𝒈𝒉𝒕 𝒐𝒇 𝒕𝒓𝒖𝒔𝒕 𝒕𝒐 𝒄𝒖𝒓𝒓𝒆𝒏𝒕 𝒕𝒊𝒆𝒔 (11)
b. Participation to social ties – for partnership to function,
both sides need to trust each other and to perform their responsibilities and obligations that will yield to reciprocity. In the expectation-obligation concept by Coleman (1988): “If A does something for B and trusts B to reciprocate in the future, this establishes an expectation in A and an obligation on the part of B. This obligation can be conceived as a credit slip held by A for performance by B.” Following this analogy, the local people are obligated to actively participate in activities and projects of their social ties to extend trust between both parties. People’s level of participation also reflects their dedication to their social ties to maintain the cooperation. This component was measured by the respondent’s degree of participation in the activities and events of the ties and the groups they were involved. Respondents were asked to select one from four choices: (1) Does not attend on events and meetings; (2) Fair number of absences (average); (3) Present most of the time on events and meetings; and (4) Never absent at any events and meetings. The max possible weight of the trust by the ties is equal to 4.
Participation to social ties =
𝜮 𝒘𝒆𝒊𝒈𝒉𝒕𝒔 𝒐𝒇 𝒕𝒉𝒆 𝒑𝒂𝒓𝒕𝒊𝒄𝒊𝒑𝒂𝒕𝒊𝒐𝒏 𝒕𝒐 𝒔𝒐𝒄𝒊𝒂𝒍 𝒕𝒊𝒆𝒔 𝒏𝒖𝒎𝒃𝒆𝒓 𝒐𝒇 𝒕𝒊𝒆𝒔
𝒎𝒂𝒙 𝒑𝒐𝒔𝒔𝒊𝒃𝒍𝒆 𝒘𝒆𝒊𝒈𝒉𝒕 𝒐𝒇 𝒕𝒉𝒆 𝒕𝒓𝒖𝒔𝒕 𝒃𝒚 𝒕𝒉𝒆 𝒕𝒊𝒆𝒔
32
3.7. Data Analysis
3.7.1. Differences between participants and non-participants
and between research areas
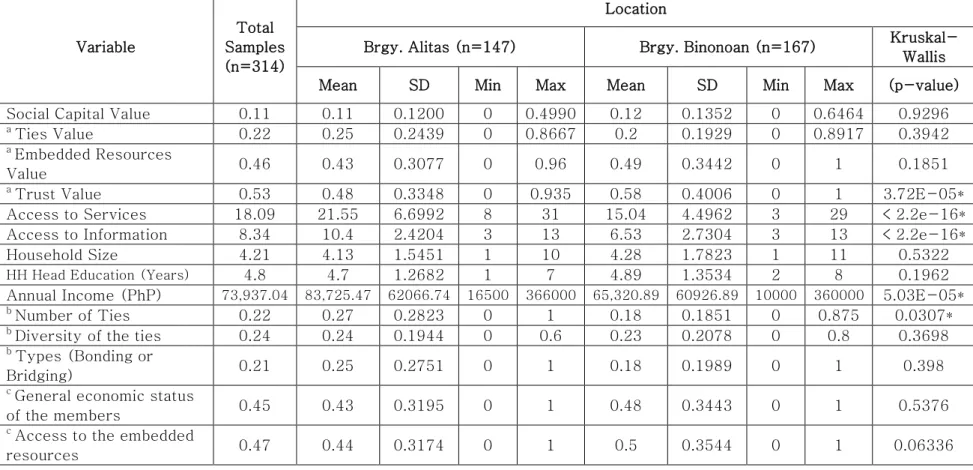
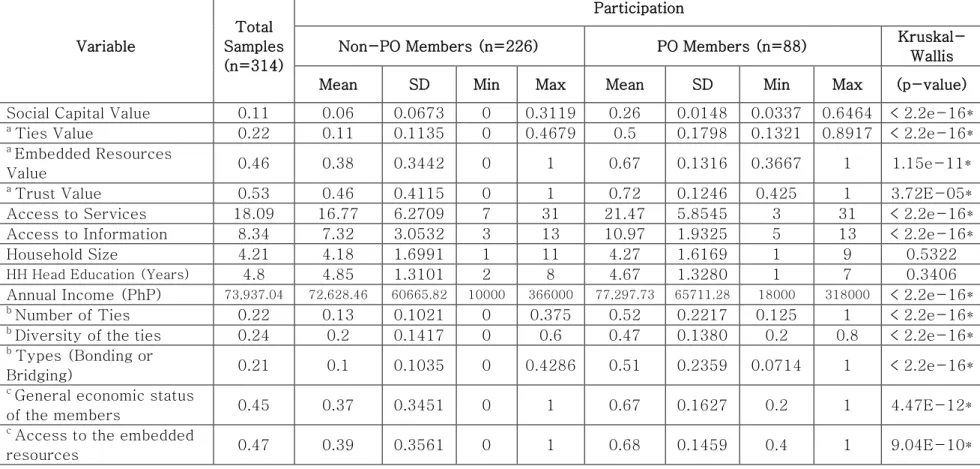
The study analyzed the differences between the participants and non-participants, and between the two research areas. For this purpose, Kruskal-Wallis Test, a non-parametric test, was performed to determine if there are significant differences between groups (Laerd Statistics, n.d.). Social capital, the components of social capital (ties value, embedded resources value, and trust value), as well as several socio-demographic variables (access to information, access to services, household size, educational attainment of the household head, and annual income) were all assessed using the Kruskal-Wallis Test.
3.7.2. Factors Affecting Social Capital
Tobit model was used to determine the factors affecting social capital. This model is the most frequently used model for censored data (Long, 1997). The social capital values, using the formula developed in this study, will result to values ranging from 0 to 1; hence, were treated censored data due to the presence of upper and lower boundaries. We regressed the computed values of social capital (dependent variable) against PO membership (dummy variable) and social-demographic factors (annual income, and the educational attainment of the household head) which were treated as the explanatory variables (Model 1). The variables used in the regression analysis are explained in Table 4.
Y
SC Value= β
0+ β
PO+ β
Education+ β
Income+ u
i (Model 1)where: YSC Value has a lower threshold of 0 and an upper
33
3.7.3. Factors Affecting Access to Information and Access to
Services
Factors affecting the people’s access to information and access to services are some of the potential benefits people can gain from their participation in the mangrove restoration projects, and at the same time, can motivate them to continue their involvement in the project. In particular, the social capital was analyzed, whether it has significant impacts to these variables. Two linear regression models were developed for this purpose: access to information (Model 2); and, access to services (Model 3). Social capital, education of the household head, and the annual income were treated as the explanatory variables. The correlation matrix between variables used in the regression analysis is presented in Appendix 2 while the variables used in the regression analysis are explained in Table 4. Below are the specifications of the regression model: