저작자표시-비영리-변경금지 2.0 대한민국 이용자는 아래의 조건을 따르는 경우에 한하여 자유롭게 l 이 저작물을 복제, 배포, 전송, 전시, 공연 및 방송할 수 있습니다. 다음과 같은 조건을 따라야 합니다: l 귀하는, 이 저작물의 재이용이나 배포의 경우, 이 저작물에 적용된 이용허락조건 을 명확하게 나타내어야 합니다. l 저작권자로부터 별도의 허가를 받으면 이러한 조건들은 적용되지 않습니다. 저작권법에 따른 이용자의 권리는 위의 내용에 의하여 영향을 받지 않습니다. 이것은 이용허락규약(Legal Code)을 이해하기 쉽게 요약한 것입니다. Disclaimer 저작자표시. 귀하는 원저작자를 표시하여야 합니다. 비영리. 귀하는 이 저작물을 영리 목적으로 이용할 수 없습니다. 변경금지. 귀하는 이 저작물을 개작, 변형 또는 가공할 수 없습니다.
석사학위논문
Carnosine을 이용한
흰다리새우(Litopenaeus vannamei)
사료 내 histidine 요구량
제주대학교 대학원
해 양 생 명 과 학 과
신 재 범
2021년 2월
목 차
ABSTRACT
... ⅳLIST OF FIGURES
... ⅵLIST OF TABLES
... ⅸ실험-1 : 흰다리새우 사료 내 histidine의 형태(dipeptide,
crystalline AA)에 따른 이용성 연구
1.1. 서론
... 12.1. 재료 및 방법
2.1.1. 실험사료 ... 3 2.1.2. 실험새우 및 사육관리 ... 7 2.1.3. 실험새우 무게측정 ... 8 2.1.4. 일반성분분석 ... 9 2.1.5. 사료의 외관상 소화율 측정 ... 9 2.1.6. RNA 추출 및 cDNA 합성 ... 11 2.1.7. qPCR (quantitative real-time PCR)에 의한 유전자 발현 분석 ... 11 2.1.8. 통계학적 분석 ... 123.1. 결과
... 134.1. 고찰
... 14실험-2 : Carnosine 을 이용한 흰다리새우 사료 내 histidine
요구량 연구
1.2. 서론
... 252.2. 재료 및 방법
2.2.1. 실험사료 ... 27 2.2.2. 실험새우 및 사육관리 ... 30 2.2.3. 실험새우 무게측정 ... 31 2.2.4. 일반성분분석 ... 31 2.2.5. RNA 추출 및 cDNA 합성 ... 31 2.2.6. qPCR (quantitative real-time PCR)에 의한 유전자 발현 분석 ... 31 2.2.7. 통계학적 분석 ... 323.2. 결과
... 334.2. 고찰
... 455. 요약문
... 496. 참고문헌
... 51Abstract
This study was conducted to evaluate the optimum dietary histidine requirement using
two molecular forms (dipeptide or crystalline amino acid) of histidine and different levels of
L-carnosine in diets for Pacific white shrimp (Litopenaeus vannamei) (Exp 1 and 2). In this
study, growth performance, feed utilization, diet digestibility, non-specific immunity and
qPCR analysis were examined.
In the Exp-1, five experimental diets were prepared. The control (Con) diet was prepared
without histidine and other diets were with 0.3 and 1.2% addition of histidine in the form of
crystalline AA or dipeptides (Con, C-0.3, C-1.2, D-0.3 and D-1.2). Experimental diets were
kept isonitrogenous and isocaloric by decreasing alanine while increasing histidine levels.
Pacific white shrimp (body weight: 0.15 g) were randomly stocked into twenty tanks (96 L)
in quadruplicate groups per dietary treatment and fed one of the diets for 62 days. Final mean
body weight, weight gain and specific growth rate were significantly higher in shrimp fed
D-0.3 and D-1.2 than those of shrimp fed the Con diet. No significant differences were
observed in feed utilization and survivals by experimental diets. Analysis of whole body
composition and amino acid profile were not significantly different among all the groups.
Apparent digestibility cofficiency of dry matter was significantly higher in shrimp fed C-1.2
and D-1.2 than those of shrimp fed the Con. Apparent digestibility cofficiency of protein was
significantly higher in shrimp fed C-1.2, D-0.3 and D-1.2 than those of shrimp fed the Con.
The relative gene expression of IGF-BP mRNA was significantly higher in shrimp fed D-1.2
than those of shrimp fed the Con.
In the Exp-2, a control diet contained a minimum level of His (0.05% in diet from the
dietary ingredients). Carnosine was gradually added to the control diet to contain 0, 0.26,
0.69, 1.11, 1.53, 1.95 or 2.37% histidine (designated as 0.05, 0.24, 0.40, 0.62, 0.78, 0.93 or
1.13, respectively). Experimental diets were kept isonitrogenous and isocaloric by decreasing
randomly stocked into twenty-eight tanks (110 L) in quadruplicate groups per dietary
treatment and fed one of the diets for 8 weeks. Final mean body weight, weight gain and
specific growth rate were significantly higher in shrimp fed 0.78 and 0.93 than those of
shrimp fed the Con. No significant differences were observed in feed utilization and
survivals by the gradual supplementation of carnosine in diets. Phenoloxidase activity was
significantly higher in shrimp fed all groups than those of shrimp fed the Con. Lysozyme
activity was significantly higher in shrimp fed 0.62 and 0.78 than those of shrimp fed the
Con. Anti-protease activity was significantly higher in shrimp fed 0.24, 0.4, 0.62, 0.78 and
0.93 than those of shrimp fed the Con. Total protein concentration in hemolymph was
significantly higher in shrimp fed 0.78 than those of shrimp fed the Con. Muscle
composition protein content of shrimp was significantly higher in shrimp fed 0.24, 0.62 and
0.78 than those of shrimp fed the Con. Prophenoloxidase (proPO) and mRNA relative gene
expression of crustin was most significantly higher in shrimp fed 0.78 and 0.93 than those of
shrimp fed the Con. The quadratic regression analysis indicated that the optimal dietary
histidine requirement for L. vannamei is 0.79% of dry diet.
In conclusion of Exp-1, the availability of histidine could be better in Pacific white
shrimp when they are fed with dipeptides form rather than crystalline form. Dipeptides can
be used as promising amino acid source for amino acid requirement study in Pacific white
shrimp.
In conclusion of Exp-2, the result from the present study indicated that dietary histidine
improved growth performance and innate immunity. Based on a quadratic regression of
specific growth rate, the optimal dietary histidine requirement by carnosine for Pacific white
shrimp was estimated to be 0.79% in diet (2.19% of dietary protein). This information will
be useful in developing amino-acid balanced diets for the intensive culture of Pacific white
LIST OF FIGURES
[EXP-1]
Figure 1. Preparation of experimental diets ... 3
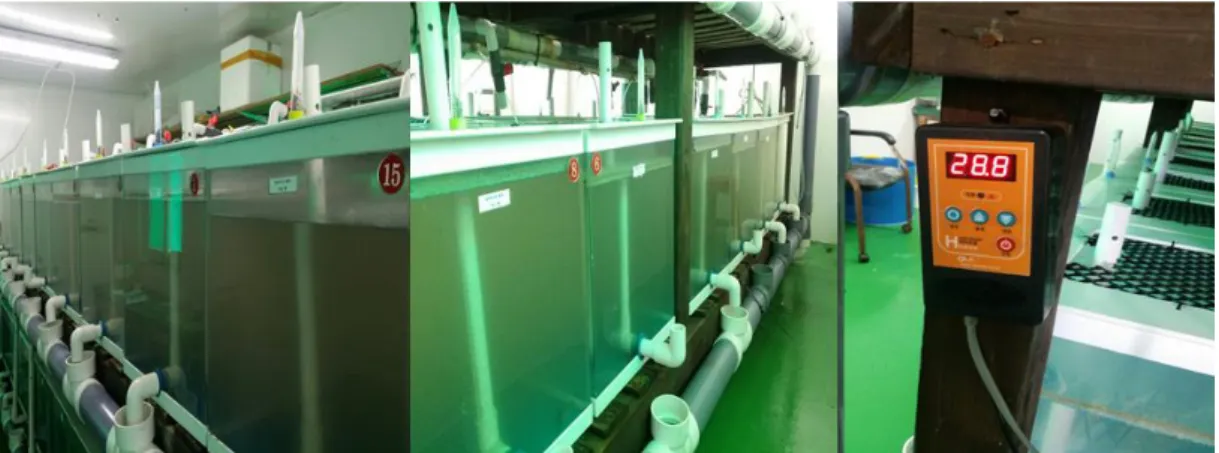
Figure 2. Experimental rearing tank for Pacific white shrimp Litopenaeus vannamei ... 7
Figure 3. Measurement of shrimp body in every 2 weeks during 62 days feeding trial ... ... 8
Figure 4. Analysis of chromic oxide concentration in shrimp feces ... 10
Figure 5. Measurement of mRNA concentration and cDNA synthesis for the qPCR analysis
... 11
Figure 6. Relative mRNA expression of Insulin-like growth factor binding proteins
(IGF-BP) for the qPCR analysis ... 12
Figure 7. Growth performance of Pacific white shrimp (Litopenaeus vannamei) fed the
experimental diets with different levels or molecular forms of histidine for 62 days.
Values are means ± S.D. (n=3). Bars with different letters are significantly
different (P<0.05). The experimental diets were prepared with supplementing
different levels or molecular forms of histidine by 0, 0.3 and 1.2% (Con, 0.3,
C-1.2, D-0.3 and D-1.2). ... 18
Figure 8. Whole body composition of Pacific white shrimp (Litopenaeus vannamei) fed the
experimental diets with different levels or molecular forms of histidine for 62 days.
Values are means ± S.D. (n=3). Bars with different letters are significantly
different (P<0.05). The experimental diets were prepared with supplementing
different levels or molecular forms of histidine by 0, 0.3 and 1.2% (Con, 0.3,
C-1.2, D-0.3 and D-1.2). ... 20
Figure 9. Apparent digestibility coefficients (%, ADC) for dry matter and protein of Pacific
white shrimp (Litopenaeus vannamei) fed the experimental diets with different
Bars with different letters are significantly different (P<0.05). The experimental
diets were prepared with supplementing different levels or molecular forms of
histidine by 0, 0.3 and 1.2% (Con, C-0.3, C-1.2, D-0.3 and D-1.2). ... 23
Figure 10. Relative mRNA expression of Pacific white shrimp (Litopenaeus vannamei) fed
the experimental diets with different levels or molecular forms of histidine for 62
days. Values are means ± S.D. (n=3). Bars with different letters are significantly
different (P<0.05). The experimental diets were prepared with supplementing
different levels or molecular forms of histidine by 0, 0.3 and 1.2% (Con, 0.3,
C-1.2, D-0.3 and D-1.2). ... 24
[EXP-2]
Figure 1. Experimental rearing tank for Pacific white shrimp Litopenaeus vannamei ... 30
Figure 2. Growth performance of Pacific white shrimp (Litopenaeus vannamei) fed the
experimental diets with different levels of histidine for 56 days. Values are means
± S.D. (n=3). Bars with different letters are significantly different (P<0.05). The
experimental diets were prepared with supplementing different levels of histidine
by 0, 0.26, 0.69, 1.11, 1.53, 1.95 and 2.37% (0.05, 0.24, 0.40, 0.62, 0.78, 0.93 and
1.13). ... 36
Figure 3. Non specific Immune parameters of Pacific white shrimp (Litopenaeus vannamei)
fed the experimental diets with different levels of histidine for 56 days. Values are
means ± S.D. (n=3). Bars with different letters are significantly different (P<0.05).
The experimental diets were prepared with supplementing different levels of
histidine by 0, 0.26, 0.69, 1.11, 1.53, 1.95 and 2.37% (0.05, 0.24, 0.40, 0.62, 0.78,
0.93 and 1.13). ... 38
Figure 4. Hemolymph analysis parameters of Pacific white shrimp (Litopenaeus vannamei)
means ± S.D. (n=3). Bars with different letters are significantly different (P<0.05).
The experimental diets were prepared with supplementing different levels of
histidine by 0, 0.26, 0.69, 1.11, 1.53, 1.95 and 2.37% (0.05, 0.24, 0.40, 0.62, 0.78,
0.93 and 1.13). ... 40
Figure 5. Muscle composition of Pacific white shrimp (Litopenaeus vannamei) fed the
experimental diets with different levels of histidine for 56 days. Values are means
± S.D. (n=3). Bars with different letters are significantly different (P<0.05). The
experimental diets were prepared with supplementing different levels of histidine
by 0, 0.26, 0.69, 1.11, 1.53, 1.95 and 2.37% (0.05, 0.24, 0.40, 0.62, 0.78, 0.93 and
1.13). ... 42
Figure 6. Relative mRNA expression of Pacific white shrimp (Litopenaeus vannamei) fed
the experimental diets with different levels of histidine for 56 days. Values are
means ± S.D. (n=3). Bars with different letters are significantly different (P<0.05).
The experimental diets were prepared with supplementing different levels of
histidine by 0, 0.26, 0.69, 1.11, 1.53, 1.95 and 2.37% (0.05, 0.24, 0.40, 0.62, 0.78,
0.93 and 1.13). ... 43
Figure 7. Based on quadratic regression analysis of the specific growth rate against the
dietary histidine level, the optimal dietary histidine requirement for Pacific white
shrimp was estimated to be 0.79% of the dry diet, corresponding to 21.9 g kg-1 of
LIST OF TABLES
[EXP-1]
Table 1. The requirements of essential amino acids for Pacifc white shrimp Litopenaeus
vannamei ... 4
Table 2. Dietary formation and proximate composition of the experimental diets for Pacific
white shrimp Litopenaeus vannamei. ... 5
Table 3. Essential and non-essential amino acid composition of the experimental diets for
Pacific white shrimp Litopenaeus vannamei ... 6
Table 4. Growth performance and feed utilization of Pacific white shrimp Litopenaeus
vannamei (initial mean body weight : 0.15 g) fed the experimental diets for 62 days.
The experimental diets were prepared with supplementing different levels or
molecular forms of histidine by 0, 0.3 and 1.2% (Con, C-0.3, C-1.2, 0.3 and
D-1.2). ... 17
Table 5. Whole body composition of Pacific white shrimp Litopenaeus vannamei fed the
experimental diets for 62 days (%, dry matter). The experimental diets were
prepared with supplementing different levels or molecular forms of histidine by 0,
0.3 and 1.2% (Con, C-0.3, C-1.2, D-0.3 and D-1.2). ... 19
Table 6. Whole body amino acid composition of Pacific white shrimp Litopenaeus vannamei
fed the experimental diets for 62 days (% dry matter). The experimental diets were
prepared with supplementing different levels or molecular forms of histidine by 0,
0.3 and 1.2% (Con, C-0.3, C-1.2, D-0.3 and D-1.2). ... 21
Table 7. Apparent digestibility coefficients (%, ADC) for dry matter and protein of Pacific
white shrimp L. vannamei fed the experimental diets for 62 days. The experimental
diets were prepared with supplementing different levels or molecular forms of
[EXP-2]
Table 1. Dietary formation and proximate composition of the experimental diets for Pacific
white shrimp Litopenaeus vannamei. ... 28
Table 2. Essential and non-essential amino acid composition of the experimental diets for
Pacific white shrimp Litopenaeus vannamei. ... 29
Table 3. Growth performance and feed utilization of Pacific white shrimp Litopenaeus
vannamei (initial mean body weight : 0.28 g) fed the experimental diets for 56 days.
The experimental diets were prepared with supplementing different levels of
histidine by 0, 0.26, 0.69, 1.11, 1.53, 1.95 and 2.37% (0.05, 0.24, 0.40, 0.62, 0.78,
0.93 and 1.13). ... 35
Table 4. Non specific Immune parameters of Pacific white shrimp Litopenaeus vannamei
(initial mean body weight : 0.28 g) fed the experimental diets for 56 days. The
experimental diets were prepared with supplementing different levels of histidine by
0, 0.26, 0.69, 1.11, 1.53, 1.95 and 2.37% (0.05, 0.24, 0.40, 0.62, 0.78, 0.93 and 1.13).
... 37
Table 5. Muscle composition of Pacific white shrimp Litopenaeus vannamei (initial mean
body weight : 0.28 g) fed the experimental diets for 56 days (%, wet basis). The
experimental diets were prepared with supplementing different levels of histidine by
0, 0.26, 0.69, 1.11, 1.53, 1.95 and 2.37% (0.05, 0.24, 0.40, 0.62, 0.78, 0.93 and 1.13).
... 39
Table 6. Hemolymph parameters of Pacific white shrimp Litopenaeus vannamei (initial mean
body weight : 0.28 g) fed the experimental diets for 56 days. The experimental diets
were prepared with supplementing different levels of histidine by 0, 0.26, 0.69, 1.11,
[실험 1]
흰다리새우 사료 내 histidine 의 형태(dipeptide, crystalline
AA)에 따른 이용성 연구
1.1. 서론
흰다리새우는 사료 내 단백질을 주요 에너지원으로 이용하기 때문에 단백질과 아미노산(amino acid, AA)의 조성은 새우의 성장과 번식 등에 중요한 요소로 알려져 있다. 특히 사료 내 AA 의 균형은 새우의 영양에 있어 단백질 합성 뿐만 아니라 에너지원으로써 중요한 요소로 알려져 있다(Rønnestad and
Conceição, 2005). 사료 섭이에 의해 섭취된 단백질은 새우의 체내에서 소화효소에
의해 가수분해되어, peptide (mono-, di-peptides) 또는 free AA 로 장에서 흡수된다(NRC, 2011). Senegal sole (Solea senegalensis)를 대상으로 한 연구에서 Free AA 는 dipeptide 에 비해 체내에서 비교적 빠르게 흡수되어, 혈액 내 AA 의
균형을 무너뜨려 단백질의 이용효율을 저하시킨다고 보고되었다(Rønnestad et al., 2000). 넙치(Paralichthys olivaceus)에서도 사료에 dipeptides (Leu-Gly, 5-15 g/kg-1)의
첨가는 crystalline AA (L-Leu, 5-15 g/kg-1
)의 첨가에 비해 단백질의 이용효율이
높다고 보고되었다(Kim and Lee, 2013). 사료 내 dipeptide 의 첨가는 치어기 무지개송어(Oncorhynchus mykiss)의 성장을 증진시키며, crystalline AA 보다 이용성이 높은 것으로 보고되었다(Terjesen et al., 2006). Dabrowski et al. (2003)은 치어기 무지개송어(O. mykiss) (0.79 g)를 대상으로 사료 내 dipeptide 와 crystalline AA 의 이용성을 비교한 결과, dipeptide 구가 crystalline AA 에 비해 높은 성장을
농도를 높인다고 보고하였다. Crystalline AA 는 Dipeptide 보다 흡수와 대사가 빠르게 일어나기 때문에 비효율적이며, crystalline AA 를 이용하여 도출된 아미노산의 요구량은 실제 적정 요구량보다 높게 측정되었다고 보고되었다(Dabrowski et al., 2010). 기존의 어류 및 새우 사료 내 아미노산 요구량에 관한 연구들은 모두 crystalline AA 를 사용하였으며 이를 통해 규명된 요구량은 과대측정 되었을 가능성이 높다. 흰다리새우는 수온과 염분에 대한 내성이 강하고 단위 면적당 생산성이 높아 전 세계적으로 각광받고 있는 양식대상종이다. 흰다리새우는 배합사료만을 공급하여 단기간 사육(5-6 개월)으로도 출하할 수 있어, 그 생산량이 급속하게 증가하고 있다. 흰다리새우의 세계 양식 생산량은 2016 년도에 약 4,156 천 톤으로, 흰다리새우에 대한 수요가 높아, 그 생산량은 계속해서 증가할 것으로 예상되고 있다(FAO, 2018). 국내에서도 흰다리새우의 생산량은 2019 년도에 7,542 톤으로, 최근 7 년간 약 171% 증가하였다(KOSIS, 2020). 본 연구에서는 흰다리새우를 대상으로 사료 내 필수아미노산인 histidine 을 crystalline 과 dipeptide 형태로 첨가(0.3, 1.2%)하여 성장, 체조성, 소화율 및 비특이적 면역력에 미치는 영향을 평가하였다.
2.1. 재료 및 방법
2.1.1. 실험사료
실험사료는 아미노산 mixtures (histidine free)를 주단백질 원료로 사용한 반정제(semi-purified)사료를 이용하였고, 사료의 기호성을 증진시키기 위해 오징어간분말을 첨가해주었다. Histidine 을 첨가하지 않은 대조구(control, Con)에 2 가지 형태(crystalline, dipeptides)의 histidine 이 각각 0.3, 1.2%(C-0.3, C-1.2, D-0.3,
D-1.2) 첨가된 실험구로, 총 5 개의 실험사료를 이용하였다. 실험사료의 조성표와
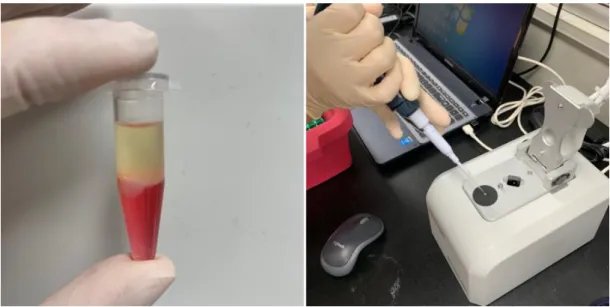
일반성분 함량은 Table 2 에 나타내었다. 실험사료는 아미노산을 제외한 사료원료를 혼합한 후, 500ml 크기의 플라스틱 통에 혼합된 사료원을 넣고, 4 회에 걸쳐 나누어 소량씩 다시 혼합해 주었다. 사료원 총 중량의 10%에 해당하는 증류수를 혼합물에 첨가한 후, 펠릿성형기(SP-50, 금강 ENG, Daegu, Korea)를 이용하여 실험사료를 제작하였다(Figure 1). 제작된 사료는 건조 후(24 시간), 사료공급 전까지 냉동 보관(-20℃)하였다. 실험사료 내 AA 의 조성은 Table 3 에 나타내었다.
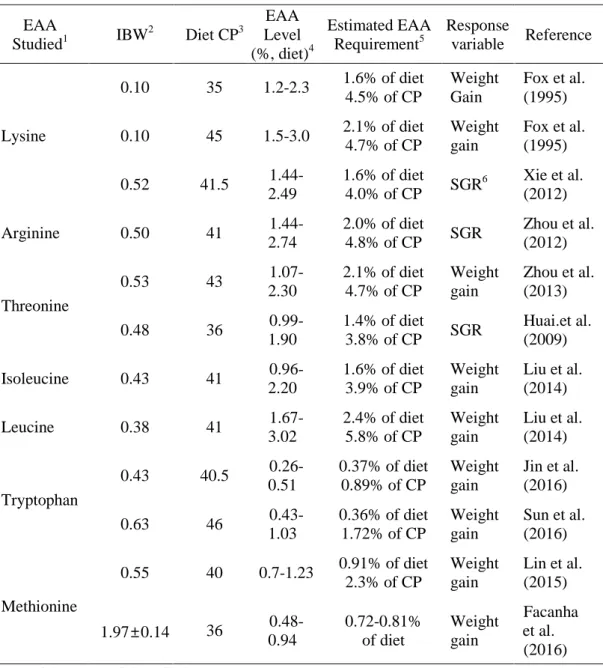
Table 1. The requirements of essential amino acids in diet for Pacifc white shrimp Litopenaeus vannamei. EAA Studied1 IBW 2 Diet CP3 EAA Level (%, diet)4 Estimated EAA Requirement5 Response variable Reference Lysine 0.10 35 1.2-2.3 1.6% of diet 4.5% of CP Weight Gain Fox et al. (1995) 0.10 45 1.5-3.0 2.1% of diet 4.7% of CP Weight gain Fox et al. (1995) 0.52 41.5 1.44-2.49 1.6% of diet 4.0% of CP SGR 6 Xie et al. (2012) Arginine 0.50 41 1.44-2.74 2.0% of diet 4.8% of CP SGR Zhou et al. (2012) Threonine 0.53 43 1.07-2.30 2.1% of diet 4.7% of CP Weight gain Zhou et al. (2013) 0.48 36 0.99-1.90 1.4% of diet 3.8% of CP SGR Huai.et al. (2009) Isoleucine 0.43 41 0.96-2.20 1.6% of diet 3.9% of CP Weight gain Liu et al. (2014) Leucine 0.38 41 1.67-3.02 2.4% of diet 5.8% of CP Weight gain Liu et al. (2014) Tryptophan 0.43 40.5 0.26-0.51 0.37% of diet 0.89% of CP Weight gain Jin et al. (2016) 0.63 46 0.43-1.03 0.36% of diet 1.72% of CP Weight gain Sun et al. (2016) Methionine 0.55 40 0.7-1.23 0.91% of diet 2.3% of CP Weight gain Lin et al. (2015) 1.97±0.14 36 0.48-0.94 0.72-0.81% of diet Weight gain Facanha et al. (2016) 1
Essential amino acid studied.
2
Initial body weight (g/shrimp).
3
Diet crude protein (%).
4
Essential amino acid level.
5
Estimated essential amino acid requirement.
6
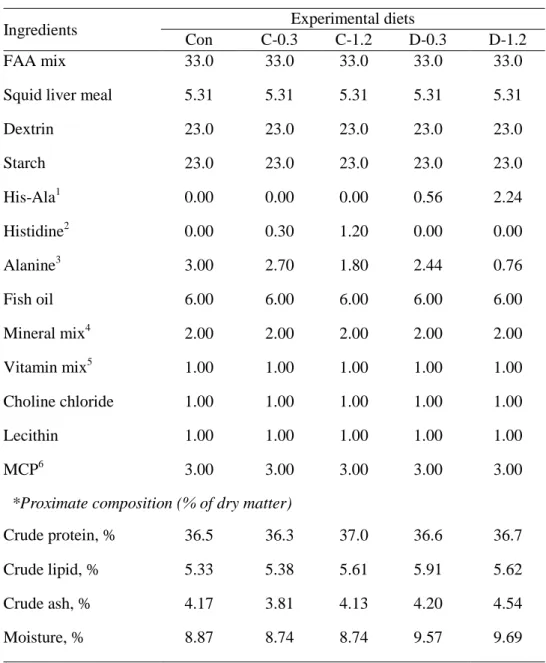
Table 2. Dietary formation and proximate composition of the experimental diets for Pacific
white shrimp Litopenaeus vannamei.
Ingredients Experimental diets
Con C-0.3 C-1.2 D-0.3 D-1.2 FAA mix 33.0 33.0 33.0 33.0 33.0
Squid liver meal 5.31 5.31 5.31 5.31 5.31
Dextrin 23.0 23.0 23.0 23.0 23.0 Starch 23.0 23.0 23.0 23.0 23.0 His-Ala1 0.00 0.00 0.00 0.56 2.24 Histidine2 0.00 0.30 1.20 0.00 0.00 Alanine3 3.00 2.70 1.80 2.44 0.76 Fish oil 6.00 6.00 6.00 6.00 6.00 Mineral mix4 2.00 2.00 2.00 2.00 2.00 Vitamin mix5 1.00 1.00 1.00 1.00 1.00 Choline chloride 1.00 1.00 1.00 1.00 1.00 Lecithin 1.00 1.00 1.00 1.00 1.00 MCP6 3.00 3.00 3.00 3.00 3.00
*Proximate composition (% of dry matter)
Crude protein, % 36.5 36.3 37.0 36.6 36.7
Crude lipid, % 5.33 5.38 5.61 5.91 5.62
Crude ash, % 4.17 3.81 4.13 4.20 4.54
Moisture, % 8.87 8.74 8.74 9.57 9.69
1
Histidine: Sigma Chemicals, L-Histidine
2
Alanine: Sigma Chemicals, L-Alanine
3
His-Ala : Swanson health products, L-Carnosine.
4
Mineral premix (g kg-1of mixture): MgSO4.7H2O, 80.0; NaH2PO4.2H2O, 370.0; KCl, 130.0; Ferriccitrate, 40.0; ZnSO4.7H2O, 20.0; Ca-lactate, 356.5; CuCl2, 0.2; AlCl3.6H2O, 0.15; Na2Se2O3, 0.01; MnSO4.H2O, 2.0; CoCl2.6H2O, 1.0
5
Vitamin premix (g kg-1of mixture): L-ascorbic acid, 121.2; DL-α tocopheryl acetate, 18.8; thiamin hydrochloride, 2.7; riboflavin, 9.1; pyridoxine hydrochloride, 1.8; niacin, 36.4; Ca-D-pantothenate, 12.7; myo-inositol, 181.8; D-biotin, 0.27; folic acid, 0.68; p-aminobezoic acid, 18.2; menadione, 1.8; retinylacetate, 0.73; cholecalficerol, 0.003; cyanocobalamin, 0.003. 6MCP: monocalcium phosphate
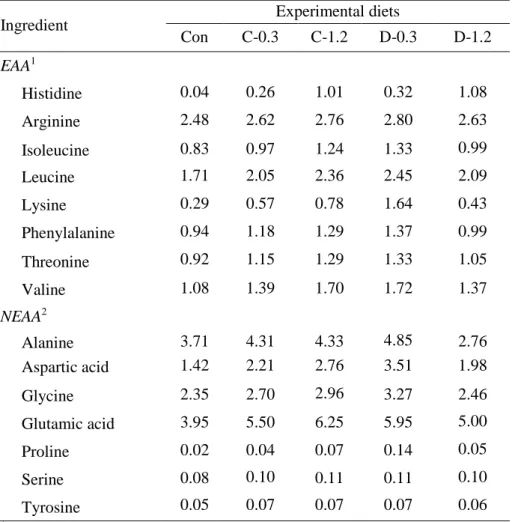
Table 3. Essential and non-essential amino acid composition of the experimental diets for
Pacific white shrimp Litopenaeus vannamei.
Ingredient Experimental diets
Con C-0.3 C-1.2 D-0.3 D-1.2 EAA1 Histidine 0.04 0.26 1.01 0.32 1.08 Arginine 2.48 2.62 2.76 2.80 2.63 Isoleucine 0.83 0.97 1.24 1.33 0.99 Leucine 1.71 2.05 2.36 2.45 2.09 Lysine 0.29 0.57 0.78 1.64 0.43 Phenylalanine 0.94 1.18 1.29 1.37 0.99 Threonine 0.92 1.15 1.29 1.33 1.05 Valine 1.08 1.39 1.70 1.72 1.37 NEAA2 Alanine 3.71 4.31 4.33 4.85 2.76 Aspartic acid 1.42 2.21 2.76 3.51 1.98 Glycine 2.35 2.70 2.96 3.27 2.46 Glutamic acid 3.95 5.50 6.25 5.95 5.00 Proline 0.02 0.04 0.07 0.14 0.05 Serine 0.08 0.10 0.11 0.11 0.10 Tyrosine 0.05 0.07 0.07 0.07 0.06 1
Essential amino acid
2
2.1.2. 실험새우 및 사육관리
실험에 사용된 흰다리새우는 충남 서산에 위치한 새우양식장에서 구입하여 제주대학교 양어사료영양학연구실 내 새우전용 사양실험 시설에서 실험을 진행하였다. 실험용 새우는 2 주 동안 시판 배합사료를 공급하면서 실험환경에 적응할 수 있도록 순치시킨 후 사료공급 실험에 사용하였다. 예비사육 후 흰다리새우(초기평균무게: 0.15 g)는 총 20 개의 96 L 수조에 각 15 마리씩 무작위로 선택하여 배치되었다(Figure 2). 모든 실험수조에 용존산소 유지를 위하여 에어스톤을 설치하였고, 62 일간의 실험기간 동안 사육수온은 27-29℃ 범위로 유지되었다. 광주기는 형광등을 이용하여 12L:12D 로 유지하였다. 사료공급은 1 일 4 회(08:30, 11:30, 15:00, 18:00 h)에 나누어 제한공급(새우 체중의 8%)하였다.2.1.3. 실험새우 무게측정
실험새우의 무게측정은 사육실험 종료 후 실시하였고, 사료공급은 실험새우의 스트레스를 최소화 하기 위해 측정 18 시간 전부터 절식시켰다. 최종무게 측정 후(Figure 3), 수조 당 3 마리(실험구 당 12 마리)의 실험새우를 무작위로 선별하여, 얼음물에 마취 시킨 후, 간췌장을 적출하였다. 간췌장은 액체질소에 넣어 급속 냉동 시킨 후, IGF-BP (insulin-like growth factor binding proteins) 유전자발현 분석에 사용되기 전까지 초저온냉동고(-80℃)에 보관되었다. 실험새우의 성장률과 사료효율 관련 조사항목과 계산식은 다음과 같다.
성장률(weight gain, WG, %) = 100 × (final mean body weight – initial mean body
weight)/initial mean body weight; 사료효율(feed conversion ratio, FCR) = dry feed fed/wet
weight gain; 단백질이용효율(protein efficiency ratio, PER) = wet weight gain/total protein
given; 일간성장률(specific growth rate, SGR, %) = [(loge final body weight – loge initial
body weight)/days] × 100.
2.1.4. 일반성분분석
사료원료, 실험사료, 분(feces), 전하체에 대한 일반성분분석은 AOAC (1995) 방법에 따라 수분은 상압가열건조법(125℃, 3 h), 조회분은 직접회화로법(550℃, 6 h), 단백질은 자동 조단백분석기(Kejltec system 2300, Sweden)로 분석하였으며,
지방은 Folch et al. (1957)의 방법에 따라 Soxhlet 추출장치(Soxhlet Heatersystem C-SH6, Korea)를 이용하여 분석하였다.
2.1.5. 사료의 외관상소화율 측정
특수실험 사료는 각 실험사료에 지시제인 산화크롬(chromium oxide, Cr2O3)를 1%
첨가하여 제조하였다. 실험사료는 사료원들을 혼합기에 넣어 혼합 후, 사료원 총 중량의 약 15%에 해당하는 증류수를 첨가하였다. 혼합반죽물은 펠렛성형기(SP-50, Gumgang ENG, Daegu, Korea)를 이용하여 알맞은 크기(2 mm)로 성형하였다. 성형된
사료는 건조기로 24 h 건조시킨 후 사료공급 전까지 -20℃에 냉동 보관하여 사용하였다.
흰다리새우의 분은 총 5 개의 acrylonitrile butadiene styrene (ABS) 수조(215 L)에 각 30 마리씩 배치하여 수집되었다. 사료공급은 1 일 3 회(08:30, 13:00, 17:30 h), 분(feces) 수집은 1 일 2 회(11:30, 16:00 h) 실시하였다. 사료공급 30 분 후, 수조 내 남은 사료와 찌꺼기는 siphoning 을 이용하여 제거 되었다. 수집된 분은 여과지를 이용하여 해수를 제거하고 냉동보관(-80℃)되었다.
실험사료와 분에서의 지시제로 사용된 chromium oxide 함량은 Divakaran et al. (2002)의 방법을 토대로 분석하였다(Figure 4). 실험사료 및 분 샘플은 회화로(550℃)에서 3 h 동안 회화한 후 얻어진 시료를 분석에 사용하였다. Chromium oxide 를 mono-chromate 형태로 산화시키기 위해 샘플 5-10 mg 을
측량하여 glass test tube 에 옮긴 후, perchloric reagent (HClO4) 4 ml 를 첨가하였다.
시료와 perchloric reagent 가 첨가된 tube 를 가열판에 넣고 320℃에서 15 min 간 가열한 후 유리플라스크에 옮겨 3 차 증류수를 이용하여 25 ml 가 되도록 정량하였다. 그 후 분광광도계(Beckman DU-730, USA)를 이용하여 350 nm 에서 흡광도를 측정하여 시료의 chromium oxide 함량을 계산하였다. 실험사료 내 영양소의 소화율은 다음과 같은 식에 의해 계산하였다.
Apparent digestibility coefficient of dry matter (%, ADCd) = 100-100×(% of Cr2O3 in
diet / % of Cr2O3 in feces); Apparent digestibility coefficient of protein (%, ADCp) =
100-100×(% of Cr2O3 in diet / % of Cr2O3 in feces) ×(% of protein in feces / % of protein in diet).
2.1.6. RNA 추출 및 cDNA 합성
RNA는 TRI-zol® (Sigma, St. Louis, MO, USA)을 이용하여 추출하였다. RNA
purity는 μDropTMPlate (Thermo Scientific, Waltham, MA, USA)를 측정하여 확인하였다.
cDNA는 분리한 RNA 2.5μg과 reaction mixture를 총 볼륨 20μL로 맞추어
PrimeScriptTM first-strand cDNA synthesis kit (TaKaRa, Shiga, Japan)를 이용하여
합성하였다. 합성한 cDNA는 nuclease free water에 100배로 희석하여 IGF-BP 분석을 수행하기 전까지 -80℃ 초저온냉동고 에 보관하였다(Figure 5).
Figure 5. Measurement of mRNA concentration and cDNA synthesis for the qPCR analysis
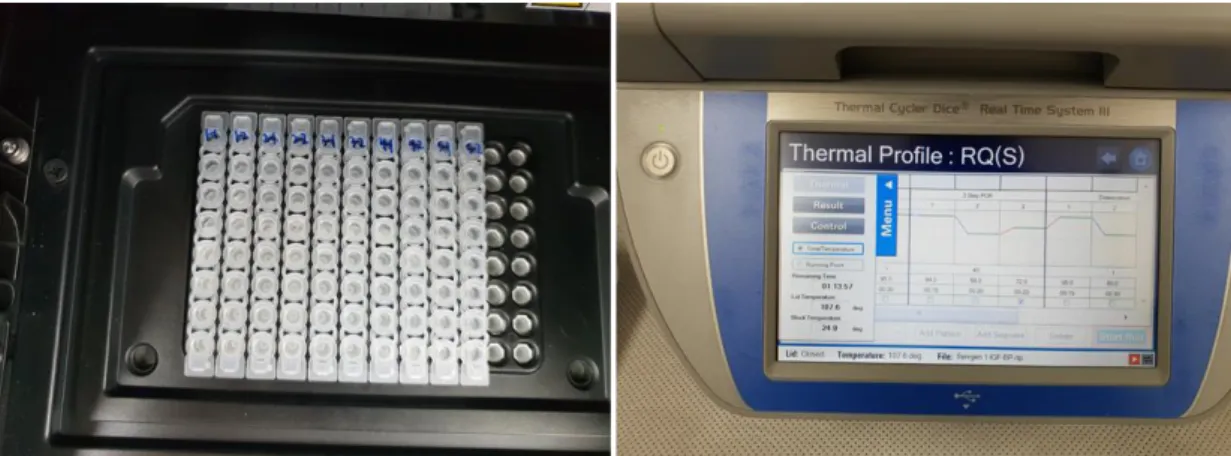
2.1.7. qPCR (quantitative real-time PCR)에 의한 유전자 발현 분석
qPCR을 수행하여 간췌장에서 흰다리새우의 IGF-BP의 발현량을 알아보고자
하였다. Reference gene으로는 β-actin을 사용하였고 forward (5`-GAGCAACACGGAGTTCGTTGT-3`), reverse
(5`-CATCACCAACTGGGACGACATGGA-3`)의 oligonucleotide primer를 사용하였다.
IGF-BP 의 oligonucleotide primer는 forward (5`-GTGGGCAGGGACCAAATC-3`) &
TP 950 Thermal Cycler DiceTM (TaKaRa)를 이용하여 진행하였고, 3μl의 cDNA, 5μl의
TaKaRa Ex TaqTMSYBR premix, 0.4μl의 forward & reverse primer, 1.2μl H2O를 넣어 총
볼륨을 10μl로 맞추어 분석을 진행하였다(Figure 6).
Figure 6. Relative mRNA expression of Insulin-like growth factor binding proteins
(IGF-BP) for the qPCR analysis.
2.1.8. 통계학적 분석
실험사료의 배치는 완전확률계획법(Completely randomized design)을 실시하였고, 성장 및 분석결과는 SPSS (Version 11.0) 프로그램을 이용하여 One-way ANOVA 로 통계 분석되었다. 데이터 값의 유의차는 Tukey's HSD test (P<0.05)로 비교하였다. 데이터는 평균값 ± 표준편차(mean ± SD)로 나타내었다. 백분율 데이터는 arcsine 변형값으로 계산하여 통계 분석하였다.
3.1. 결과
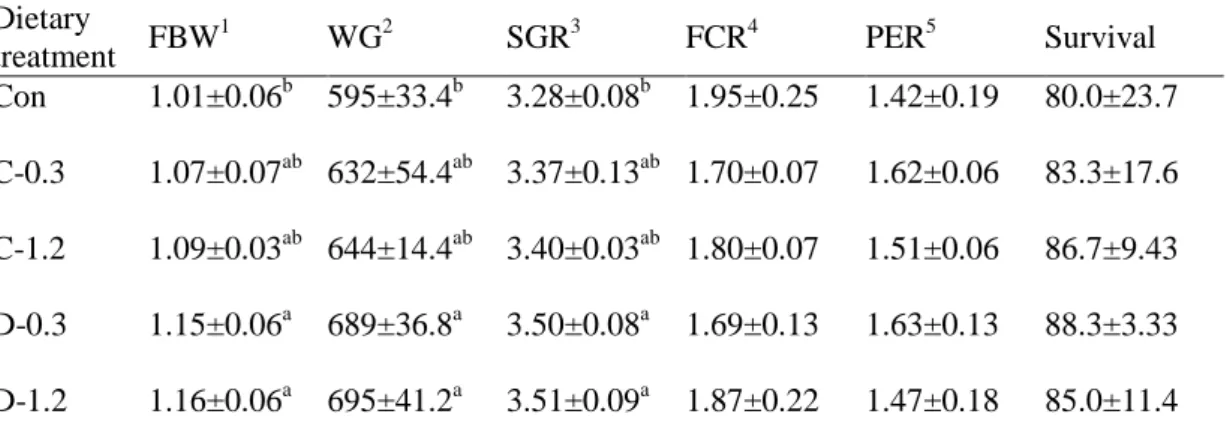
62 일 동안의 사육실험 결과, 실험새우의 최종평균무게, 성장률, 일간성장률은 dipeptide 구(D-0.3, 1.2)가 대조구에 비해 유의적으로 높았다. 특히 D-1.2 실험구가 대조구에 비해 각 14.9, 16.8, 7.0% 증가하여 가장 높은 차이를 나타내었다(Table 4, Figure 7) (P<0.05). 사료전환효율, 단백질이용효율, 생존율은 실험구와 대조구 사이에 유의적인 차이가 없었지만 D-0.3 실험구가 대조구에 비해 각 15.4, 14.8, 10.4% 증가하여 가장 높은 차이를 나타내었다(P>0.05). Crystalline 구는 모든 성장결과에서 대조구와 비교하여 유의적인 차이를 나타내지 않았다(P>0.05). 실험새우의 구성 아미노산의 조성, 조단백질, 조지질, 조회분 함량은 모든 실험구 사이에 유의적인 차이를 보이지 않았다(Table 5, 6, Figure 8) (P>0.05). 실험새우의 건물소화율은 D-1.2, C-1.2 구가 대조구에 비해 유의적으로 높았다. 단백질소화율은 0.3, 1.2, C-1.2 구가 대조구에 비해 유의적으로 높았다. 특히 D-1.2 실험구가 대조구에 비해 각 6.2, 6.9% 증가하여 가장 높은 차이를 나타내었다(Table 7, Figure 9) (P<0.05). 실험새우 간췌장의 IGF-BP 발현량은 D-1.2 구가 대조구에 비해 유의적으로 높았다. 특히 D-1.2 실험구가 대조구에 비해 234% 증가하여 가장 높은 차이를 나타내었다(Figure 10) (P<0.05).4.1. 고찰
본 연구에서 dipeptide 형태의 histidine은 crystalline AA보다 이용성이 높았다. 일반적으로 단백질은 소화효소의 작용을 통해 free 혹은 peptide (di-, tri-)형태로 가수분해 된 후, Na+
-dependent amino acid transporter system (Na+ transporter system)
을 통해 장 내에 흡수되거나 방출된다(Zhang et al., 2006). Peptide transporter-1 (PepT-1)은 주로 소장 내 Na+ transporter system에서 dipeptide와 tripeptide의 흡수를 주로
담당하는 수송체이다(Daniel and Kottra, 2004; Bröer, 2008; Verri et al., 2017). 어류의 경우 PepT-1는 소장의 근위부(proximal)에서 원위부(distal region)까지 넓은 범위에 걸쳐 분포하고 있어, 장 전체 에서 peptide를 효과적으로 흡수할 수 있다고 보고되었다(Rønnestad et al., 2010; Terova et al., 2013; Xu et al., 2016). 어류의 경우, crystalline AA는 peptides (intact protein)보다 빠르게 흡수되지만, 조직 내 아미노산
pool의 균형을 무너뜨려 단백질의 합성을 저하시키는 것으로 알려져 있다(Cowey
and Walton, 1988; Berge et al., 1994). Pacu (Piaractus mesopotamicus), 잉어, 넙치,
터봇(Scophthalmus maximus)에서도 dipeptide가 crystalline AA 보다 성장과 근육 내 단백질의 합성면에서 이용성이 높다고 보고되었다(Tesser et al., 2005; Kwasek et al., 2010; Kim and Lee, 2013; Wei et al., 2020). 따라서, dipeptide는 crystalline AA에 비해
소화기관에서의 흡수되는 범위가 넓기 때문에 흰다리새우 사료에서 이용성이 비교적 높게 나타난 것으로 판단된다.
본 연구에서 사료 내 두 종의 histidine 첨가는 새우의 일반 성분과 아미노산
조성에 영향을 미치지 않았다. 어류 및 새우의 whole-body 내 AA 조성은 일반적으로 사료 내 AA 요구량을 나타내는 지표로 사용되어 왔다(Bicudo and Cyrino, 2009). 이번 연구결과와 유사하게 common carp 를 대상으로 아미노산과
2006).
본 연구에서 사료 내 dipeptide의 첨가는 crystalline AA 보다 효율적으로 체내에 흡수되어 새우의 소화율을 증진시키는 것으로 나타났다. Peptides는 섭취된 단백질이 내강(lumen) 또는 위장관 세포에서 빠르게 분해되어 아미노산의 형태로 흡수된다(NRC, 2011). 어류의 경우, 체내에 PepT-1의 활성을 띄는 것으로 확인되어, free 아미노산 뿐만 아니라, peptide와 같은 intact protein 이 다른 대사경로를 통해 체내로 흡수되는 것으로 알려져 있다(Verri et al., 2011). 무지개송어와 차넬메기를 대상으로한 연구에서 crystalline AA는 peptides (intact protein)보다 소화관에서 비교적 빠르게 흡수 된다고 보고되었다(Murai et al., 1987;
Cowey and Walton, 1988; Tantikitti and March, 1995; Zarate and Lovell, 1997; Zarate et al.,
1999). Luo et al. (2005)은 crystalline AA는 어류의 조직에서 빠르게 흡수되나, 조직
내 아미노산 pool의 불균형을 초래하기 때문에 intact protein에서 분해된 아미노산보다 이용효율이 낮다고 보고하였다.
이번 연구에서 사료 내 dipeptide 의 첨가는 새우의 IGF-BP 의 발현을 증진시키는 것으로 나타났다. insulin-like growth factor-Ⅰ (IGF-Ⅰ)은 70 개의 아미노산으로 이루어진 펩타이드로서 척추동물의 성장호르몬을 매개로 간에서 생성된다(Nam et al., 2001). IGF-Ⅰ은 세포의 대사와 단백질 합성을 촉진하여 포유동물의 성장에 중요한 역할을 한다(Baxter, 1993; Cohich and Clemmons, 1993). IGF-BP 는 IGF-Ⅰ을 조직 내 표적세포까지 운반해줄 뿐만 아니라, IGF-Ⅰ과 결합하여 다른 세포의 수용체와 부착하는데 중요한 역할을 한다(Nam et al., 2001). Wilson-Arop et al. (2018)은 blunt snout bream (Megalobrama amblycephala) 사료 내
histidine 의 첨가(1.1%)는 IGF-Ⅰ의 발현을 증진시킨다고 보고하였다. 어류 사료 내
필수아미노산의 함량은 IGF-Ⅰ 발현에 직∙간접적으로 영향을 미친다고 보고되었다(Dyer et al., 2004; Li et al., 2006). 흰다리새우에서도 사료 내 tryptophan 이
결핍될 경우, IGF-Ⅰ의 합성을 감소시킨다고 보고하였다(Jin et al., 2017). 따라서 흰다리새우 사료 내 dipeptide 는 아미노산으로써 그 요구량 충족시킬 수 있을 뿐만 아니라, crystalline AA 보다 그 이용성이 높은 것으로 판단된다. 그러나, dipeptide 에 대한 정확한 작용기전이 밝혀지지 않아 이에 대한 보충연구가
Table 4. Growth performance and feed utilization of Pacific white shrimp Litopenaeus
vannamei (initial mean body weight: 0.15 g) fed the experimental diets for 62 days. The
experimental diets were prepared with supplementing different levels or molecular forms of
histidine by 0, 0.3 and 1.2% (Con, C-0.3, C-1.2, D-0.3 and D-1.2)
Dietary treatment FBW 1 WG2 SGR3 FCR4 PER5 Survival Con 1.01±0.06b 595±33.4b 3.28±0.08b 1.95±0.25 1.42±0.19 80.0±23.7 C-0.3 1.07±0.07ab 632±54.4ab 3.37±0.13ab 1.70±0.07 1.62±0.06 83.3±17.6 C-1.2 1.09±0.03ab 644±14.4ab 3.40±0.03ab 1.80±0.07 1.51±0.06 86.7±9.43 D-0.3 1.15±0.06a 689±36.8a 3.50±0.08a 1.69±0.13 1.63±0.13 88.3±3.33 D-1.2 1.16±0.06a 695±41.2a 3.51±0.09a 1.87±0.22 1.47±0.18 85.0±11.4 1
FBW: final body weight (g)
2
Weight gain (%) = 100 x (final mean body weight – initial mean body weight)/initial mean body weight,
3
Specific growth ratio (% day-1) = [(loge final body weight - loge initial body weight)/days] x 100
4
Feed conversion ratio = dry feed fed (g) / wet weight gain (g) 5
Protein efficiency ratio = wet weight gain /total protein given.
Values are mean of triplicate groups and presented as mean ± S.D. Values with different superscripts in the same column are significantly different (P<0.05). The lack of superscript letter indicates no significant differences among treatments.
Figure 7. Growth performance of Pacific white shrimp Litopenaeus vannamei fed the
experimental diets with different levels or molecular forms of histidine for 62 days. Values
are mean of triplicate groups and presented as mean ± S.D. Bars with different letters are
significantly different (P<0.05). The experimental diets were prepared with supplementing
different levels or molecular forms of histidine by 0, 0.3 and 1.2% (Con, C-0.3, C-1.2, D-0.3
Table 5. Whole body composition of Pacific white shrimp Litopenaeus vannamei fed the
experimental diets for 62 days (% of dry matter). The experimental diets were prepared with
supplementing different levels or molecular forms of histidine by 0, 0.3 and 1.2% (Con,
C-0.3, C-1.2, D-0.3 and D-1.2).
Dietary treatment Crude protein Crude lipid Crude Ash
Con 69.9±3.83 3.08±0.26 18.0±2.48 C-0.3 74.0±0.03 2.85±0.18 15.7±1.45 C-1.2 71.4±1.81 3.23±0.20 16.8±0.48 D-0.3 72.3±2.46 3.12±0.21 16.5±0.21 D-1.2 72.0±2.36 3.24±0.30 16.0±0.42
Values are mean of triplicate groups and presented as mean ± S.D. Values with different superscripts in the same column are significantly different (P<0.05). The lack of superscript letter indicates no significant differences among treatments.
Figure 8. Whole body composition of Pacific white shrimp Litopenaeus vannamei fed the
experimental diets with different levels or molecular forms of histidine for 62 days. Values
are mean of triplicate groups and presented as mean ± S.D. Bars with different letters are
significantly different (P<0.05). The experimental diets were prepared with supplementing
different levels or molecular forms of histidine by 0, 0.3 and 1.2% (Con, C-0.3, C-1.2, D-0.3
Table 6. Whole body amino acid composition of Pacific white shrimp Litopenaeus vannamei
fed the experimental diets for 62 days (% dry matter). The experimental diets were prepared
with supplementing different levels or molecular forms of histidine by 0, 0.3 and 1.2% (Con,
C-0.3, C-1.2, D-0.3 and D-1.2).
Essential amino acids Experimental diets (added histidine level, %) Con C-0.3 C-1.2 D-0.3 D-1.2 Arginine 6.24 6.15 6.08 6.27 6.34 Lysine 4.40 4.38 4.37 4.56 4.49 Threonine 2.44 2.50 2.47 2.52 2.48 Phenylalanine 2.72 2.74 2.75 2.87 2.79 Isoleucine 2.54 2.57 2.56 2.68 2.64 Leucine 4.30 4.30 4.26 4.44 4.37 Histidine 2.96 3.23 3.13 3.02 2.91 Valine 2.89 2.92 2.89 3.03 2.98 Values are mean of triplicate groups and presented as mean ± S.D. Values with different superscripts in the same column are significantly different (P<0.05). The lack of superscript letter indicates no significant differences among treatments.
Table 7. Apparent digestibility coefficients (%, ADC) for dry matter and protein of Pacific
white shrimp L. vannamei fed the experimental diets for 62 days. The experimental diets
were prepared with supplementing different levels or molecular forms of histidine by 0, 0.3
and 1.2% (Con, C-0.3, C-1.2, D-0.3 and D-1.2).
Dietary treatment ADCd1 ADCp2 Con 72.8±0.53c 82.4±0.35c C-0.3 74.6±1.23bc 83.1±0.82c C-1.2 75.5±1.25ab 86.0±0.71b D-0.3 75.0±2.08abc 84.8±1.27b D-1.2 77.3±0.91a 88.1±0.48a 1
Apparent digestibility coefficient of dry matter (%)
2
Apparent digestibility coefficient of protein (%)
Values are mean of triplicate groups and presented as mean ± S.D. Values with different superscripts in the same column are significantly different (P < 0.05).
Figure 9. Apparent digestibility coefficients (%, ADC) for dry matter and protein of Pacific
white shrimp (Litopenaeus vannamei) fed the experimental diets with different levels or
molecular forms of histidine for 62 days. Values are mean of triplicate groups and presented
as mean ± S.D. Bars with different letters are significantly different (P<0.05). The
experimental diets were prepared with supplementing different levels or molecular forms of
Figure 10. Relative mRNA expression of Pacific white shrimp Litopenaeus vannamei fed the
experimental diets with different levels or molecular forms of histidine for 62 days. Values
are mean of triplicate groups and presented as mean ± S.D. Bars with different letters are
significantly different (P<0.05). The experimental diets were prepared with supplementing
different levels or molecular forms of histidine by 0, 0.3 and 1.2% (Con, C-0.3, C-1.2, D-0.3
[실험 2]
Carnosine 을 이용한 흰다리새우 사료 내
histidine 요구량 연구
1.2. 서론
Histidine 은 생물의 체내에서 합성되지 않아 반드시 먹이를 통해 섭이해야만 하는 필수아미노산 중 하나이다(NRC, 2011). Histidine 은 어류 체내 근육의 pH 완충 및 삼투압을 조절하는 역할을 하며, 사료 내 적절한 histidine 의 첨가는 체내 단백질 합성과 성장 증진, 근육 내의 histidine 함량 증진에 도움을 주는 것으로 알려져 있다(Forde-Skjaevik et al., 2006; Waagbo et al., 2010; Farhat, 2013). Glover et al. (2003)은 무지개송어(O. mykiss) 사료 내 적절한 histidine 첨가는 장내에 아연(zinc)의 흡수를 증진시켜 소화효소(amylase, protease, lipase)의 촉진에 도움을 준다고 보고하였다. Jian carp (Cyprinus carpio var. Jian) 사료 내 histidine 첨가는 간췌장과 근육 내 glutamate pyruvate transaminase (GPT) 함량을 증진시킨다고 보고되었다(Zhao et al., 2012). GPT 는 주로 간과 근육에서 histidine 의 신진대사 생성물인 carnosine (β-alanine-L-histidine)의 합성에 관여하는 물질이다(Stifel and Herman, 1971). 어류 및 새우 사료 내 histidine 이 결핍 될 경우, 성장 감소, 척추 전만(lordosis), 식욕 부진, 백내장(cataract)을 일으킨다고 보고되었다(Breck et al., 2005; NRC, 2011; Michelato et al., 2017). 사료 내 histidine 의 요구량에 관한 연구는 어류의 경우, 차넬메기(Ictalurus punctatus) (1.54%, Wilson et al., 1980), chum salmon (Oncorhynchus keta) (1.6%, Akiyama et al., 1985), 잉어 (2.1%,
무지개송어 (1.1%, Rodehutscord et al., 1997), gilthead sea bream (Sparus auratus) (1.7%, Kaushik, 1998), african catfish (Clarias gariepinus) (1.0%, Khan and Abidi, 2009)를
대상으로 진행되었다. 그러나, 새우의 경우에는 kuruma prawn (Marsupenaeus
japonicus) (0.5-0.7%, Teshima et al., 2002), 홍다리얼룩새우(P. monodon) (0.8%,
Millamena et al., 1999)를 대상으로 일부 연구만 진행되었고, 흰다리새우를 이용한
연구는 전무한 실정이다(Table 1).
Carnosine 은 β-alanine 과 L-histidine 이 결합된 dipeptide 이며 동물의 두뇌, 신경, 근육에 많이 함유되어 있다(Sale et al., 2013). Caronsine 은 근육 내 지방과 단백질의 산화를 억제하며(Nagasawa et al., 2001), 장 내에 pro-inflammatory cytokines 를 제거하여 염증반응을 감소시킨다고 보고되었다(Shimizu, 2004; Son et
al., 2008). Karabulut-Bulan et al. (2017)은 흰 쥐(albino mice)에 canosine (250 mg/kg-1)을
정맥 주사(intravenous injection, IV)하면 장 내 염증반응을 감소시킨다고 보고하였다. 무지개송어(79.1 g±1.15 g)의 경우, 사료 내 carnosine (3.9 g/kg-1
)의
첨가는 무첨가구에 비해 성장률과 사료효율을 유의적으로 증가시키지 못한 것으로 보고되었다(Snyder et al., 2015).
대두박(soybean meal)은 단백질 함량이 높고(40-60%), 가격이 어분(fish meal)에 비해 저렴하여 새우 양식 사료에 주 단백질원료로 사용되고 있다(Amaya et al., 2007; Suárez et al., 2009). 그러나, 대두박은 제한아미노산의 부족으로 어분에 비해
사료에 대량으로 첨가(45-55%)할 경우, 새우의 성장률을 저하시키는 것으로 보고되었다(Lim and Dominy, 1990). 사료의 부적합한 AA 조성은 새우의 성장을 감소시키거나 사료비용을 증가시키는 결과를 초래한다. 단백질은 양식 사료에 있어 감안하여야 할 가장 중요한 영양소로써 이러한 단백질을 구성하는 각 AA 의 조성 및 각 요구량 설정은 새우의 성장과 배합사료의 비용 절감을 위해
매우 중요하다. 따라서 흰다리새우 양식산업의 지속 가능한 개발을 위해서는 정확한 영양소 요구량 자료를 기반으로 만들어진 사료의 개발이 요구된다(Peres and Oliva-Teles, 2006).
2.2. 재료 및 방법
2.2.1. 실험사료
실험사료는 아미노산 mixtures (histidine free)를 주단백질 원료로 사용한 반정제(semi-purified)사료를 이용하였고, 기호성을 증진시키기 위해 오징어간분말을 첨가해주었다. Histidine 을 첨가하지 않은 대조구(Control, 0.05)에 dipeptides 형태의 histidine 을 각 0, 0.26, 0.69, 1.11, 1.53, 1.95, 2.37%(0.05, 0.24, 0.40, 0.62, 0.78, 0.93, 1.13) 첨가된 실험구로 총 7 개의 실험사료를 이용하였다. 실험사료 조성표와 일반성분 함량은 Table 1 에 나타내었다. 실험사료는 아미노산을 제외한 사료원료를 혼합한 후, 500 ml 크기의 플라스틱 통에 혼합된 사료원을 넣고, 4 회에 걸쳐 나누어 소량씩 다시 혼합해 주었다. 사료원 총 중량의 10%에
해당하는 증류수를 첨가 한 후, 펠릿성형기(SP-50, 금강 ENG, Daegu, Korea)를 이용하여 실험사료를 제작하였다. 제작된 사료는 건조 후(24 시간), 사료공급 전까지 냉동 보관(-20℃)하였다. 실험사료 내 AA 의 조성은 Table 2 에 나타내었다.
Table 1. Dietary formation and proximate composition of the experimental diets for Pacific
white shrimp Litopenaeus vannamei.
Ingredients Diets (added histidine level %)
0.05 0.24 0.40 0.62 0.78 0.93 1.13
FAA mix 33.0 33.0 33.0 33.0 33.0 33.0 33.0
Squid liver meal 5.31 5.31 5.31 5.31 5.31 5.31 5.31
Dextrin 23.0 23.0 23.0 23.0 23.0 23.0 23.0 Starch 23.0 23.0 23.0 23.0 23.0 23.0 23.0 His-Ala1 0.00 0.26 0.69 1.11 1.53 1.95 2.37 Alanine2 3.00 2.74 2.31 1.89 1.47 1.05 0.63 Fish oil 6.00 6.00 6.00 6.00 6.00 6.00 6.00 Mineral mix3 2.00 2.00 2.00 2.00 2.00 2.00 2.00 Vitamin mix4 1.00 1.00 1.00 1.00 1.00 1.00 1.00 Choline chloride 1.00 1.00 1.00 1.00 1.00 1.00 1.00 Lecithin 1.00 1.00 1.00 1.00 1.00 1.00 1.00 MCP5 3.00 3.00 3.00 3.00 3.00 3.00 3.00
*Proximate composition result (% DM)
Crude protein, % 35.7 35.7 35.5 36.0 35.8 36.4 36.4
Crude lipid, % 6.00 5.88 6.19 6.65 6.69 6.77 6.42
Crude ash, % 4.72 4.67 4.71 4.69 4.75 4.78 4.74
Moisture, % 10.5 10.4 9.60 9.90 9.48 9.91 9.48
1
His-Ala : Swanson health products, L-Carnosine
2
Alanine: Sigma Chemicals, L-Alanine
3
Mineral premix (g kg-1of mixture): MgSO4.7H2O, 80.0; NaH2PO4.2H2O, 370.0; KCl, 130.0;
Ferriccitrate, 40.0; ZnSO4.7H2O, 20.0; Ca-lactate, 356.5; CuCl2, 0.2; AlCl3.6H2O, 0.15;
Na2Se2O3, 0.01; MnSO4.H2O, 2.0; CoCl2.6H2O, 1.0 4
Vitamin premix (g kg-1of mixture): L-ascorbic acid, 121.2; DL-α tocopheryl acetate, 18.8; thiamin hydrochloride, 2.7; riboflavin, 9.1; pyridoxine hydrochloride, 1.8; niacin, 36.4; Ca-D-pantothenate, 12.7; myo-inositol, 181.8; D-biotin, 0.27; folic acid, 0.68; p-aminobezoic acid, 18.2; menadione, 1.8; retinylacetate, 0.73; cholecalficerol, 0.003; cyanocobalamin, 0.003
Table 2. Essential and non-essential amino acid composition of the experimental diets for
Pacific white shrimp Litopenaeus vannamei.
Ingredients Diets (added histidine level %)
0.05 0.24 0.40 0.62 0.78 0.93 1.13 EAA1 Arginine 2.29 2.15 2.15 2.11 2.18 2.11 2.33 Histidine 0.05 0.24 0.40 0.62 0.78 0.93 1.13 Isoleucine 1.65 1.63 1.58 1.58 1.61 1.58 1.69 Leucine 2.64 2.63 2.63 2.60 2.64 2.60 2.75 Lysine 2.09 2.11 2.10 2.08 2.08 2.08 2.16 Phenylalanine 1.81 1.79 1.79 1.77 1.79 1.77 1.86 Threonine 1.35 1.33 1.37 1.32 1.34 1.32 1.37 Valine 1.79 1.77 1.70 1.72 1.73 1.72 1.82 NEAA2 Alanine 3.62 3.61 3.59 3.61 3.58 3.61 2.66 Aspartic acid 3.49 3.46 3.48 3.50 3.48 3.50 3.65 Glycine 1.67 1.69 1.69 1.77 1.66 1.77 1.71 Glutamic acid 7.53 7.34 7.38 7.30 7.36 7.30 7.72 Proline 2.11 1.98 2.12 2.15 2.05 2.15 2.16 Serine 1.59 1.57 1.67 1.58 1.63 1.58 1.69 Tyrosine 1.09 1.10 1.14 1.08 1.17 1.08 1.15 Total (%) 34.8 34.4 34.8 34.8 35.1 35.1 35.8 1
Essential amino acid
2
2.2.2. 실험새우 및 사육관리
실험에 사용된 흰다리새우는 제주도 서귀포시 표선면에 위치한 새우양식장에서 구입하여 제주대학교 양어사료영양학연구실 내 새우전용 사양실험 시설에서 실험을 진행하였다. 실험용 새우는 4 주 동안 시판 배합사료를 공급하면서 실험환경에 적응할 수 있도록 순치시킨 후 사료공급 실험에 사용하였다. 예비사육 후 흰다리새우(초기평균무게: 0.28 g)는 총 28 개의 110 L 수조에 각 25 마리씩 무작위로 선택하여 배치되었다(Figure 1). 모든 실험수조에 용존산소 유지를 위하여 에어스톤을 설치하였고, 56 일간의 실험기간 동안 사육수온은 28-30℃ 범위로 유지되었다. 광주기는 형광등을 이용하여 12L:12D 로 유지하였다. 사료공급은 1 일 5 회(08:45, 11:15, 13:45, 16:15, 18:45 h)에 나누어 제한공급(새우체중의 8%)을 하였다.2.2.3. 실험새우 무게측정
실험새우의 무게측정은 사육실험 종료 후 실시하였고, 사료공급은 실험새우의 스트레스를 최소화 하기 위해 측정 18 시간 전부터 절식시켰다. 최종무게 측정 후, 수조 당 5 마리(시험구 당 20 마리)의 실험새우를 무작위로 선별하여, 얼음물에 마취 시킨 후, Alsever’s 용액(Alsever’s solution, Sigma, St. Louis, MO, USA)이 처리된 주사기를 이용하여 hemolymph 를 채혈하였다. Hemolymph 는
비특이적 면역분석, 혈액분석을 위해 원심분리(800 g, 20 min)하여 혈장(plasma)을 분리하였다. Hemolymph 채혈 후, 해부를 통해 간췌장을 적출하였다. 분리된 간췌장은 액체질소에 넣어 급속 냉동 시킨 후, proPO (prophenoloxidase), crustin 유전자발현 분석에 사용되기 전까지 초저온냉동고(-80℃)에 보관되었다. 간췌장 적출 후 남은 tail muscle 은 일반성분분석에 사용되었다. 실험새우의 성장률과 사료효율 관련 조사항목과 계산식은 실험-1 과 같다.
2.2.4. 일반성분분석
실험-1 과 동일하게 진행되었다.2.2.5. RNA 추출 및 cDNA 합성
실험-1 과 동일하게 진행되었다.2.2.6. qPCR (quantitative real-time PCR)에 의한 유전자 발현분석
β-actin (F-5`-GAGCAACACGGAGTTCGTTGT-3`, R-5`-CATCACCAACTGGGACGACATGGA-3`)은 reference gene 으로 사용되었고, proPO5’- TCCATTCCGTCCGTCTG-3’, R-5’- GGCTTCGCTCTGGTTAGG-3’), crustin
이용되었다. qPCR 은 Real Time System TP 950 Thermal Cycler DiceTM
(TaKaRa)를
이용하여 진행하였고, 3μl 의 cDNA, 5μl 의 TaKaRa Ex TaqTM
SYBR premix, 0.4μl 의
forward & reverse primer, 1.2μl H2O 를 넣어 총 볼륨을 10μl 로 맞추어 분석을
진행하였다.
2.2.7. 통계학적 분석
실험사료의 배치는 완전확률계획법(completely randomized design)을 실시하였으며, 분석결과는 SPSS (Version 18.0) 프로그램을 이용하여 One-way ANOVA 로 통계 분석하였다. 데이터 값의 유의차는 Duncan’s multiple test 로
비교하였다. 데이터는 평균값±표준편차(mean±SD)로 나타내었다. 백분율데이터는 arcsine 변형 값으로 통계분석 하였다. 사료의 histidine 의 적정 함량은 실험새우의
일간성장률을 기준으로 quadratic regression model (Sigma plot, Systat Software, San Jose, CA, USA)을 이용하여 산출되었다.
3.2. 결과
56 일 동안의 사육실험 결과, 실험새우의 최종평균무게와 성장률, 일간성장률은 0.78, 0.93 실험구가 대조구(0.05)에 비해 유의적으로 높았다. 특히 0.78 실험구가 대조구에 비해 각각 15.9, 18.3, 7.8% 증가하여 가장 높은 차이를
나타내었다(Table 3 & Figure 2) (P<0.05).
사료전환효율(FCR), 단백질이용효율(PER), 생존율은 실험구와 대조구 사이에 유의적인 차이를 보이지 않지만 단백질이용효율에서 0.93 실험구가 대조구에 비해 12.3% 증가하여 가장 높은 차이를 나타내었다(P>0.05). 실험새우 비특이적 면역력에서 PO 활성은 대조구를 제외한 모든 실험구가 대조구 에 비해 유의적으로 높았다. Lysozyme 활성은 0.62, 0.78 실험구가 대조구에 비해 유의적으로 높았다. 특히, 0.78 실험구가 대조구에 비해 각각 27.5, 17.6% 증가하여 가장 높은 차이를 나타내었다(P<0.05). Anti-protease 활성은 0.24, 0.4, 0.62, 0.78, 0.93 실험구가 대조구에 비해 유의적으로 높았다. 특히 0.93 실험구가
대조구에 비해 31.5% 증가하여 가장 높은 차이를 나타내었다(Table 4 & Figure 3) (P<0.05).
실험새우 혈액분석에서 Total protein 의 농도는 0.78 실험구가 대조구에 비해 유의적으로 높았다. 특히 0.78 실험구가 대조구에 비해 45.1% 증가하여 가장 높은 차이를 나타내었다(P<0.05). Cholesterol 의 농도는 실험구와 대조구 사이에 유의적인 차이를 보이지 않지만 특히 1.13 실험구가 대조구에 비해 25.6% 증가하여 가장 높은 차이를 나타내었다(Table 5 & Figure 4) (P>0.05).
실험새우 전하체의 muscle composition 에서 조단백질은 0.24, 0.62, 0.78 실험구가 대조구에 비해 유의적으로 높았다. 특히 0.78 실험구가 대조구에 비해 5.4% 증가하여 가장 높은 차이를 나타내었다(P<0.05). 조회분은 0.78 실험구가
대조구에 비해 유의적으로 높았다(P<0.05). 조지질 함량은 모든 실험구 사이에 유의적인 차이를 보이지 않지만 특히 0.62 실험구가 대조구에 비해 26.3% 증가하여 가장 높은 차이를 나타내었다(Table 5 & Figure 5) (P>0.05).
실험새우 간췌장의 proPO 발현량은 0.24, 0.62, 0.78, 0.93 실험구가 대조구에 비해 유의적으로 높았다. 특히 0.93 실험구가 대조구에 비해 95% 증가하여 가장 높은 차이를 나타내었다(P<0.05). Crustin 발현량은 0.4, 0.62, 0.78, 0.93% 실험구가 대조구에 비해 유의적으로 높았다. 특히 0.62 실험구가 대조구에 비해 282% 증가하여 가장 높은 차이를 나타내었다(Figure 6) (P<0.05). 흰다리새우 사료 내 histidine 적정 첨가 함량은 일간성장률 을 고려하였을 때 quadratic regression 분석을 통해 0.79% 인 것으로 판단된다(Figure 7).
Table 3. Growth performance and feed utilization of Pacific white shrimp Litopenaeus
vannamei (initial mean body weight : 0.28 g) fed the experimental diets for 56 days. The
experimental diets were prepared with supplementing different levels of histidine by 0, 0.26,
0.69, 1.11, 1.53, 1.95 and 2.37% (0.05, 0.24, 0.40, 0.62, 0.78, 0.93 and 1.13). Dietary treatment FBW 1 WG2 SGR3 FCR4 PER5 Survival 0.05 1.82±0.15b 551±51.5b 3.34±0.14b 2.60±0.29 0.57±0.08 75.0±8.25 0.24 1.78±0.10b 535±38.5b 3.30±0.11b 2.70±0.24 0.63±0.09 83.0±12.8 0.40 1.95±0.18ab 597±65.3ab 3.46±0.17ab 2.70±0.25 0.64±0.11 84.0±8.64 0.62 1.98±0.08ab 604±31.7ab 3.48±0.08ab 2.83±0.14 0.62±0.07 86.0±6.93 0.78 2.11±0.21a 652±78.4a 3.60±0.18a 2.72±0.34 0.63±0.09 82.0±5.16 0.93 2.09±0.15a 644±50.4a 3.58±0.12a 2.72±0.18 0.64±0.06 85.0±3.83 1.13 1.89±0.12ab 577±44.7ab 3.41±0.12ab 2.71±0.27 0.56±0.08 77.0±7.57 1
FBW: final body weight (g)
2
Weight gain (%) = 100 x (final mean body weight – initial mean body weight)/initial mean body weight
3
Specific growth ratio (% day-1) = [(loge final body weight - loge initial body weight)/days] x 100
4
Feed conversion ratio = dry feed fed (g) / wet weight gain (g), 5Protein efficiency ratio = wet weight gain /total protein given.
Values are mean of triplicate groups and presented as mean ± S.D. Values with different superscripts in the same column are significantly different (P<0.05). The lack of superscript letter indicates no significant differences among treatments.
Figure 2. Growth performance of Pacific white shrimp (Litopenaeus vannamei) fed the
experimental diets with different levels of histidine for 56 days. Values are mean of triplicate
groups and presented as mean ± S.D. Bars with different letters are significantly different
(P<0.05). The experimental diets were prepared with supplementing different levels of
histidine by 0, 0.26, 0.69, 1.11, 1.53, 1.95 and 2.37% (0.05, 0.24, 0.40, 0.62, 0.78, 0.93 and
Table 4. Non specific Immune parameters of Pacific white shrimp Litopenaeus vannamei
(initial mean body weight : 0.28 g) fed the experimental diets for 56 days. The experimental
diets were prepared with supplementing different levels of histidine by 0, 0.26, 0.69, 1.11,
1.53, 1.95 and 2.37% (0.05, 0.24, 0.40, 0.62, 0.78, 0.93 and 1.13).
Dietary treatment PO1 Lysozyme Anti-protease 0.05 0.182±0.02c 4.43±0.44c 25.4±3.89b 0.24 0.211±0.02b 4.79±0.51bc 31.3±5.44a 0.40 0.213±0.02ab 4.74±0.39bc 32.6±4.67a 0.62 0.203±0.02b 4.86±0.42ab 31.0±2.60a 0.78 0.232±0.02a 5.21±0.54a 31.9±4.82a 0.93 0.223±0.02ab 4.75±0.44bc 33.4±3.63a 1.13 0.205±0.02b 4.38±0.63c 29.4±7.39ab 1
PO: Phenoloxidase activity
Values are mean of triplicate groups and presented as mean ± S.D. Bars with different letters are significantly different (P<0.05). The lack of superscript letter indicates no significant differences among treatments.
Figure 3. Non specific Immune parameters of Pacific white shrimp (Litopenaeus vannamei)
fed the experimental diets with different levels of histidine for 56 days. Values are means ±
S.D. (n=3). Bars with different letters are significantly different (P<0.05). The experimental
diets were prepared with supplementing different levels of histidine by 0, 0.26, 0.69, 1.11,
Table 5. Hemolymph analysis parameters of Pacific white shrimp Litopenaeus vannamei
(initial mean body weight : 0.28 g) fed the experimental diets for 56 days. The experimental
diets were prepared with supplementing different levels of histidine by 0, 0.26, 0.69, 1.11,
1.53, 1.95 and 2.37% (0.05, 0.24, 0.40, 0.62, 0.78, 0.93 and 1.13).
Dietary
treatment Total protein
1 Cholesterol2 0.05 1.84±0.42b 2.54±0.62 0.24 2.10±0.37ab 2.54±0.69 0.40 2.35±0.32ab 2.79±0.59 0.62 2.37±0.20ab 2.71±0.72 0.78 2.67±0.29a 2.97±0.86 0.93 2.13±0.40ab 3.13±0.97 1.13 2.40±0.57ab 3.19±0.99 1 Total protein (g/dl) 2 Cholesterol (mg/dl).
Values are mean of triplicate groups and presented as mean ± S.D. Bars with different letters are significantly different (P<0.05). The lack of superscript letter indicates no significant differences among treatments.
Figure 4. Hemolymph analysis parameters of Pacific white shrimp (Litopenaeus vannamei)
fed the experimental diets with different levels of histidine for 56 days. Values are means ±
S.D. (n=3). Bars with different letters are significantly different (P<0.05). The experimental
diets were prepared with supplementing different levels of histidine by 0, 0.26, 0.69, 1.11,
Table 6. Muscle composition of Pacific white shrimp Litopenaeus vannamei (initial mean
body weight : 0.28 g) fed the experimental diets for 56 days (%, wet basis). The
experimental diets were prepared with supplementing different levels of histidine by 0, 0.26,
0.69, 1.11, 1.53, 1.95 and 2.37% (0.05, 0.24, 0.40, 0.62, 0.78, 0.93 and 1.13).
Dietary treatment Crude protein Crude lipid Ash 0.05 18.5±0.08d 0.99±0.03 1.64±0.06a 0.24 19.1±0.01abc 1.14±0.38 1.51±0.11ab 0.40 18.6±0.17cd 1.11±0.13 1.50±0.04ab 0.62 19.1±0.20ab 1.25±0.09 1.57±0.08ab 0.78 19.5±0.03a 1.12±0.06 1.47±0.01b 0.93 18.9±0.24bcd 1.19±0.05 1.54±0.02ab 1.13 18.6±0.38cd 1.12±0.09 1.57±0.07ab
Values are mean of triplicate groups and presented as mean ± S.D. Bars with different letters
are significantly different (P<0.05). The lack of superscript letter indicates no significant
Figure 5. Muscle composition of Pacific white shrimp (Litopenaeus vannamei) fed the
experimental diets with different levels of histidine for 56 days. Values are means ± S.D.
(n=3). Bars with different letters are significantly different (P<0.05). The experimental diets
were prepared with supplementing different levels of histidine by 0, 0.26, 0.69, 1.11, 1.53,
Figure 6. Relative mRNA expression of Pacific white shrimp (Litopenaeus vannamei) fed
the experimental diets with different levels of histidine for 56 days. Values are means ± S.D.
(n=3). Bars with different letters are significantly different (P<0.05). The experimental diets
were prepared with supplementing different levels of histidine by 0, 0.26, 0.69, 1.11, 1.53,
Figure 7. Based on quadratic regression analysis of the specific growth rate against the
dietary histidine level, the optimal dietary histidine requirement for Pacific white shrimp was
4.2. 고 찰
본 연구에서 사료 내 histidine이 결핍(>0.7%)될 경우 새우의 성장이 저하되는 것으로 보아, histidine은 흰다리새우 사료 내 필수아미노산임을 입증하였다. 흰다 리새우 사료 내 histidine 요구량은 quadratic regression 분석을 통해 0.79% (2.19% of dietary protein)인 것으로 나타났다. 홍다리얼룩새우(P. monodon) (0.2 g)를 대상으로
intact protein (casein 10%, gelatin 5% of diet)과 아미노산 혼합물(20% of diet)을 주단백
질원으로 사용한 실험에서 histidine의 요구량은 0.8% (2.2% of dietary protein)라고 보고되었다(Millamena et al., 1999). Teshima et al. (2002)은 kuruma prawn (0.79 g) (M.
japonicas)을 대상으로 CS-diet (casein 50%, squid protein 5% of diet), FM-diet (white fish
meal 53%, squid protein 6% of diet)를 40일간 공급했을때, 최적의 hisitidine 요구량은
0.5-0.7% (1.1-1.4% of dietary protein)로 보고하였다.
홍다리얼룩새우(P. monodon) (0.2 g), kuruma prawn (M. japonicas) (0.79 g) 사료에 hisitidine의 결핍 혹은 과잉 첨가는 아미노산의 불균형을 초래하여 새우의 성장을
감소시킨다고 보고되었다(Millamena et al., 1999; Teshima et al., 2002). 어류 사료 내 histidine의 결핍은 jian carp (C. carpio var. Jian), stinging catfish (Heteropneustes fossilis),
blunt snout bream (M. amblycephala)을 대상으로 한 연구에서 성장의 감소, 백내장
(cataract) 반응을 보인다고 보고되었다(Zhao et al., 2012; Farhat, 2013; Khan and Abidi,
2014; Arop et al., 2018). Maurin et al. (2006)은 사료 내 hisitidine이 결핍될 경우, 어류
의 사료섭이량을 감소시킨다고 보고하였다. Millamena et al. (1999)은 새우 사료 내 특정 아미노산을 과잉으로 첨가 할 경우, 새우의 성장을 저하시킨다고 보고하였 다. 과도한 hisitidine 첨가는, 사료 내 아미노산 pool의 균형을 무너뜨려 조직에 독성을 유발하고, 어류와 새우의 성장을 저하시키며, histamine의 합성을 증가시켜 염증반응을 유발하는 pro-inflammatory cytokines의 발현을 증가시킨다고 보고되었