The Best Obesity Indicators for Metabolic
Syndrome
by
Su Youn Kim
Major in Medicine
Department of Medical Sciences
The Graduate School, Ajou University
The Best Obesity Indicators for Metabolic
Syndrome
:The comparison among Body Mass Index,
Waist circumference, Waist-Height ratio
-The Fourth Korea National Health and
Nutrition Examination Surveys
-by
Su Youn Kim
A Dissertation Submitted to The Graduate School of Ajou
University in Partial Fulfillment of the Requirements
for the Degree of Master of Medicine
Supervised by
Bom Taeck Kim, M.D., Ph.D.
Major in Medicine
Department of Medical Sciences
The Graduate School, Ajou University
This certifies that the dissertation
of Su Youn Kim is approved.
SUPERVISORY COMMITTEE
Bom Taeck Kim
Joon Yuen Park
Il Joong Park
The Graduate School, Ajou University
December, 20th, 2011
감사의 글
처음 써 보는 논문인지라 쉽지 않은 시간이었지만 제가 이 논문을 쓰면서 여러 가지 면에서 성장할 수 있었던 것 같아서 기쁩니다. 많은 분들께서 도움을 주셨기에 이 논문을 완성할 수 있었습니다. 우선 부족한 점이 많은 저를 인내와 열정으로 지도해 주신 가정의학과 김범 택 지도 교수님께 존경과 감사의 마음을 올립니다. 또한 3년 동안 이상적인 가 정의학과 의사의 롤모델이 되어 주시고 따뜻한 관심으로 저를 지도해 주신 이득 주 교수님, 김광민 교수님, 박샛별 교수님, 주남석 교수님, 조두연 교수님께 감사 를 드립니다. 그리고 석사 지도 위원이신 소아청소년과 박준은 교수님과 진단검 사의학과 박일중 교수님께 감사를 전합니다. 또한 통계 분석과 고찰 작성에 많은 도움을 주신 가정의학과 김영상 선생님께 감사 드립니다. 또한 3년 동안 서로 격려 하면서 수련 생활에 큰 힘이 되어준 전공의 동기들-박수정, 이윤경, 이상 훈-에게 모두 고마움을 전하고 싶습니다. 끝으로, 지금의 제가 있기까지 가장 큰 힘이 되어준 가족들- 항상 격려의 말씀으로 든든하게 제 곁에 있어주신 아버지, 따뜻한 사랑으로 저를 응원해주시 는 어머니, 든든한 우리 오빠, 친구 같은 동생 지연이-에게 사랑과 감사를 전하 고 싶습니다.i - ABSTRACTS -–
The Best Obesity Indicators for Metabolic Syndrome
Background: Recent studies have suggested that waist to height ratio (WHtR) is the better
indicator to predict cardiovascular risk than body mass index (BMI) and waist circumference (WC). The aim of the study is to identify the best anthropometric index among obesity indicators that predicts metabolic syndrome (MS) in different gender and age groups.
Methods: This study is a cross-sectional survey of 6,160 subjects aged 19 years (yr) and
over who participated in the Fourth Korea National Health and Nutrition Examination Surveys (KNHANES IV) between January 2008 and December 2008. To compare predictive power of anthropometric indices for MS, the areas under the receiver-operating characteristics curves (AUCs) of BMI, WC and WHtR were calculated.
Results: In entire age population, AUC of WHtR was the largest among obesity indicators to
predict MS in both genders. However after adjustment for age, there was no significant difference among three obesity indicators in both men and women. When compared within three different age groups, there was no significant difference among three obesity indices for men and young aged women (19-39yr). AUC of WHtR and WC were similar with each other, but greater than AUC of BMI for middle-aged (40-60yr) and elderly (> 60yr) women.
Conclusion: There is no superiority among obesity indicators to predict MS in men and
young women. BMI has less predicting power for MS in middle-aged and elderly women than WC and WHtR.
ii
Keywords: Waist to height ratio, Waist circumference, Body mass index, Metabolic
iii
TABLE OF CONTENTS
ABSTRACT ··· ⅰ TABLE OF CONTENTS ··· ⅲ LIST OF FIGURES ··· ⅳ LIST OF TABLES ··· ⅴ . Ⅰ INTRODUCTION ··· 1Ⅱ. STUDY POPULATION AND METHODS ··· 4
A. Study Population ··· 4
B. Method ··· 5
1. Health Examination Survey ··· 5
2. Definition of metabolic syndrome ··· 5
C. Statistical analysis··· 6
. Ⅲ RESULT ··· 7
A. Characteristics of the Study Population ··· 7
B. AUC of Each Obesity Indicators for Metabolic Syndrome ··· 7
. Ⅳ DISCUSSION ··· 12 . Ⅴ CONCLUSION ··· 15 REFERENCE ··· 16 국문요약 ··· 21
iv
LIST OF FIGURES
Fig. 1. Prevalence of metabolic syndrome. ··· 11
v
LIST OF TABLES
Table 1. Characteristics of study population ··· 8
Table 2. Comparison of the AUC for obesity indicators regarding metabolic syndrome for entire age ··· 9
Table 3. Comparison of the AUC for obesity indicators regarding metabolic
syndrome: adjusted for age as continuous variable ··· 9
Table 4. Comparison of the AUC for obesity indicators regarding metabolic syndrome according to age group ··· 10
1
-I. INTRODUCTION
Obesity is a chronic disease characterized by excessive adiposity in body(WHO, 2000) leading to numerous metabolic derangements such as hypertension, type 2 diabetes, dyslipidemia, coronary artery disease, and increased cardiovascular mortality.(Hubert et al., 1983; WHO, 2000; Poirier and Eckel, 2002; Poirier et al., 2006) During the last decade, the prevalence of obesity in Korea has increased in considerable rate and become one of the greatest concerns in public health.(Yoon et al., 2006) According to Korean National Health and Nutrition Examination Surveys (KNHANES), the prevalence of obesity defined as body mass index above 25 kg/m2, increased from 25.1% to 35.3% in men during the last decade.(Welfare, 1999) In 1998, the socioeconomic costs of obesity were about $200 million, which corresponded to 0.05% of GDP and 0.9% of total health care costs in Korea.(Jeong BG, 2002) And in 2005, the socioeconomic costs of obesity were about $1700 million, which corresponded to 0.22% of GDP and 3.8% of total health care costs in Korea. (Kang JH, 2011) Socioeconomic costs of obesity in Korea increased around nine times during seven years.
In order to alleviate fast growing public health burden due to obesity, a reliable indicator for obesity to discriminate obese population who need active interventions from normal weight group who do not, is critical. Traditionally anthropometric indices such as body mass index (BMI), waist circumference (WC), waist to height ratio (WHtR), have been implicated to estimate amount of accumulated fat in body. There is no consensus about the most sensitive and specific obesity indicator associated with metabolic risk factors.(Lee et al., 2008b)
2
-measure to define obesity both in medical research and clinical practice. However, BMI has crucial defects in terms of obesity definition and prediction of metabolic comorbidities because BMI does not distinguish fat mass from lean mass (Lakka, 2002), and represents only overall adiposity rather than abdominal adiposity which is more closely associated with metabolic comorbidities.(Wellens RI, 1996)
Waist circumference (WC) has been employed as a better surrogate for abdominal adiposity than BMI. Abdominal adiposity has been reported to have close relation with a number of atherogenic conditions, such as insulin resistance, glucose intolerance, elevated blood pressure, and abnormal serum lipid levels.(Lakka, 2002),(Fox et al., 2007).(Wajchenberg, 2000),(Carr and Brunzell, 2004) However, WC offer only one criterion in each sex, nevertheless of various body sizes people have, which can ignore relative contribution of fat accumulation in different body size(Hsieh and Muto, 2006), and single measure of waist circumference for all individuals may end up to overestimate the metabolic risk in tall population and underestimate in short population.(Lopez-Alvarenga et al., 2003), (Hsieh, 1999),(Fuchs et al., 2005)
Waist-to-height ratio (WHtR) considers both the amount of abdominal fat and body size. In a meta-analysis and large prospective study, WHtR was better correlated to cardiovascular risk factors (hypertension, diabetes mellitus and dyslipidemia) than other usual anthropometric indicator.(Lee et al., 2008a),(Gruson et al., 2010) However, the differences between waist-to-height ratio and the other anthropometric measurements were minimal and varies depending on risk factors.(Lee et al., 2008a)
The distribution of body composition differs greatly by gender and age. Gender differences become more distinct in puberty due to changes in sex hormone levels. For a given body mass index, adult males have greater total lean and mineral mass, and lower fat
3
-mass, than females. And adult male were also found to have more visceral and hepatic adipose tissue, whereas women had more peripheral or subcutaneous adipose tissue. In both men and women aging cause declines in muscle mass and increase in fat mass, loss of subcutaneous fat(peripherally first and then centrally) and accumulation of visceral fat.(Stevens et al., 2010)
Inaccuracy of obesity indices may be appeared because obesity indices can’t distinguish the age- or gender related changes in body shape and composition exactly. It is important to study the effect of both gender and age on obesity indices. However, in most previous studies about obesity indicator associated with metabolic risk factors, ROC curves (receiver-operating characteristics curves) were analyzed for all ages.
The aim of the study is to compare the magnitudes of predicting power of different obesity indicators for metabolic syndrome (MS) in different gender and age, based on the data from the Fourth Korea National Health and Nutrition Examination Surveys (KNHANES IV) conducted in 2008.
4
-II. STUDY POPULATION AND METHOD
A. Study population
This study was based on data obtained from the second year of the Fourth Korea National Health and Nutrition Examination Surveys (KNHANES IV), conducted by Korea Centers for Disease Control and Prevention, between January 2008 and December 2008. (Choi et al., 2011) KNHANES, which has been repeated since 1998, is a cross-sectional and nationally representative survey on the health and nutritional status of the civilian, noninstitutionalized Korean population. The survey consists of three components: a health interview survey, a nutrition survey and a health examination survey. (Lee et al., 2011)
In the KNHNES IV, a stratified, multistage probability sampling based on geographic area, gender, and age was used. The sampling frame was based on the 2005 National Census Registry. (Kim and Lee, 2011)
The survey sample pool was composed of 264,186 primary sampling units, each consisting of approximately 60 households. Two hundred sampling frames from primary sampling units were randomly sampled, and 23 households from each sampling frame (60 households) were sampled by systemic sampling method. Finally, 12,528 individuals in 4,600 households were sampled and 9,744 of them participated in this survey.(Choi et al., 2011),(Kim and Lee, 2011)
Among the 9,744 participants, 7,178 subjects over 19 years (yr) of age were selected for the analysis. And we excluded individuals with incomplete data for the standardized physical examination, laboratory tests, and anthropometric measures, past history, as well as those who had been diagnosed and treated for cardiovascular disease(CVD) such as known
5
-coronary artery disease, stroke, and peripheral artery occlusive disease.
Thus, 6,160 subjects (2,584 men and 3,576 women) were finally analyzed in this study and the average age was 47.8±16.2.
B. Methods
1. Health Examination Survey
Body weight was measured to the nearest 0.1 kg on a calibrated balance-beam scale while the participants wore a lightweight gown or underwear. Height was measured to the nearest 0.1 cm in the upright position using a stadiometer. WC was measured at the midpoint between the bottom of the rib cage and the top of the lateral border of the iliac crest during minimal respiration.(Khang and Yun, 2010) BMI was calculated as weight in kilograms divided by height in meters squared (kg/m2). WHtR was calculated by dividing the WC (in cm) by height (in m) multiplied by 100.
Blood pressure was measured 3 times with 30s intervals using a in the right arm using a standard mercury sphygmomanometer. The average of the 2nd and 3rd measurements was used in the analysis. After a 12-hour overnight fast, blood samples were obtained from subjects from an antecubital vein. Fasting blood sugar (FBS), total cholesterol, triglyceride (TG) and high density lipoprotein (HDL) cholesterol were measured.(Park et al., 2009)
2. Definition of metabolic syndrome
In the present study, we used the definition of MS proposed by National Cholesterol Education Program-Adult Treatment Panel III (NCEP ATP III) as the presence of three or
6
-more of the following risk factors: waist circumference 102 cm or greater in men, and 88 cm or greater, serum triglycerides 150 mg/dl or greater, HDL less than 40 mg/dl in men and less than 50 mg/dl in women, measured BP 130/85 mm Hg or greater, and fasting blood glucose 110 mg/dl or greater. (Executive Summary, 2001)
C. Statistical analysis
Patients were analyzed separately by gender, for entire age group, young age group (19-39yr), middle age group (40-60yr) and elderly group (> 60yr) to investigate the age-related effect on the relationship of anthropometric obesity indices with MS. Baseline characteristics were reported using means and standard deviations stratified according to age group. ANOVA and post hoc analysis by Scheffe method was used to test the difference in baseline characteristics between groups. χ2 tests were used to evaluate prevalence of MS by gender for each age groups. To compare predictive power of anthropometric indices for MS, the areas under the receiver-operating characteristics curves (AUCs) of BMI, WC and WHtR were used. The AUCs of each anthropometrical parameter (BMI, WC, and WHtR) were calculated regarding to MS. First, the AUC of each anthropometric index was compared with an AUC value of 0.5, the area under the line of no discrimination. Then the AUCs of each anthropometric index for MS were compared using the method of DeLong et al. (DeLong et al., 1988), (Can et al., 2009). Statistical significance was accepted if P < 0.01 for comparison of AUCs and if P< 0.05 for other analyses. Data analyses were performed using MedCalc 11.6 for ROC analyses and SPSS 11.0. (SPSS Inc. Chicago, IL. USA) for other analyses.
7
-III. RESULT
A. Characteristics of the Study population
Height diminished with age in both men and women. Weight declined with age in men but incremented in women until middle age group and then diminished in old age group.
In men, BMI was lowest in old age group than others while BMI was lowest in young age group in women. WC of men stopped to increment with age after middle age group whereas WC of women continued to grow bigger with age. WHtR incremented with age in both genders, more prominently in women than in men (Table 1).
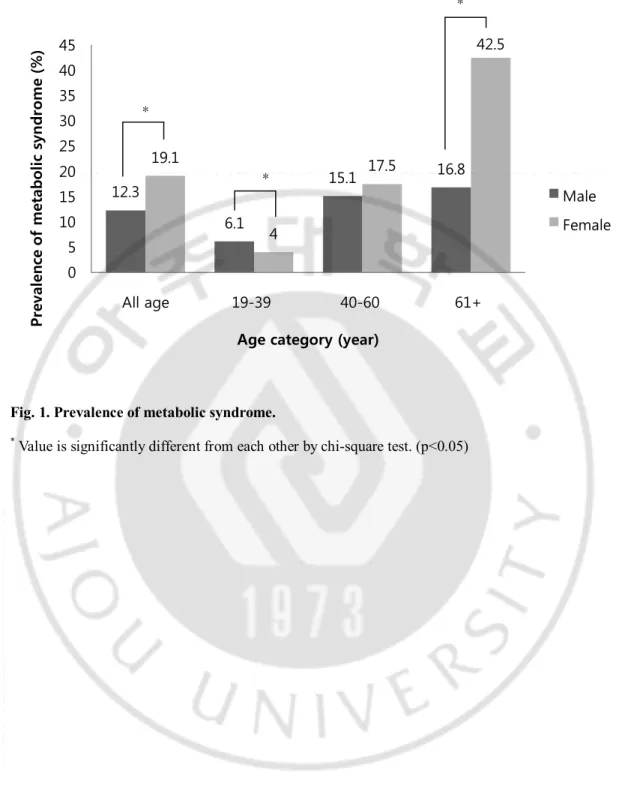
In entire age group, the prevalence of MS was higher in women (19.1%) than in men (12.3%). And the prevalence of MS incremented with advancement in age in both genders, more steeply in women (Figure 1).
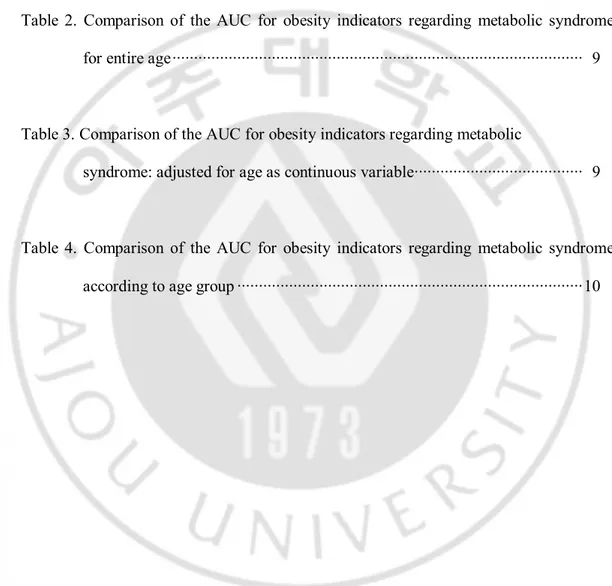
B. AUCs of each obesity indicator for metabolic syndrome
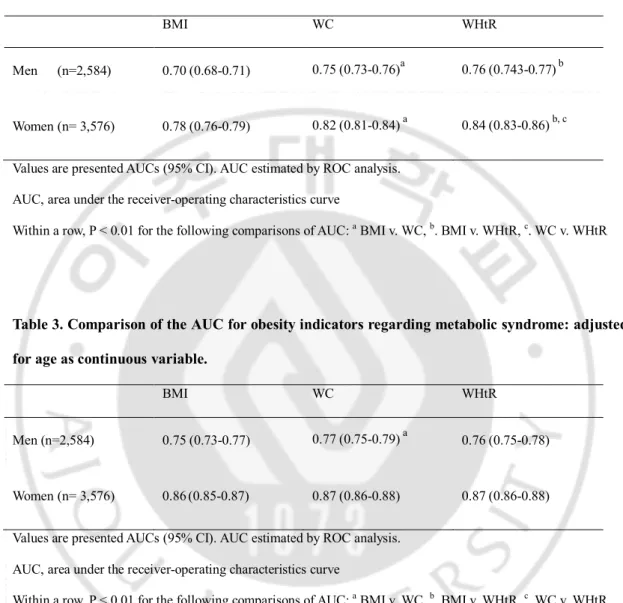
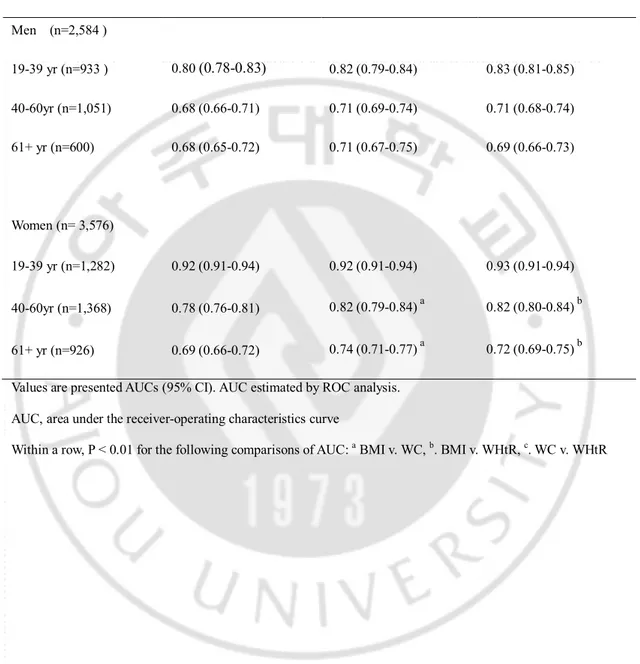
In entire age group, AUC of WHtR was the largest one among 3 obesity indicators for MS in men and women (Table 2). After adjusted for age, no significant difference was found among three obesity indicators for MS in both genders (Table 3). When compared within three different age groups, for young, middle-aged and elderly men and young-aged women, there was no significant difference in AUC among three obesity indicators. For middle-aged and elderly women AUC of WHtR and WC were similar with each other but significantly larger than BMI’s (Table 4).
9
-Table 2. Comparison of the AUC for obesity indicators regarding metabolic syndrome for entire age (n=6,160).
BMI WC WHtR
Men (n=2,584) 0.70 (0.68-0.71) 0.75 (0.73-0.76)a 0.76 (0.743-0.77)b
Women (n= 3,576) 0.78 (0.76-0.79) 0.82 (0.81-0.84) a 0.84 (0.83-0.86) b, c Values are presented AUCs (95% CI). AUC estimated by ROC analysis.
AUC, area under the receiver-operating characteristics curve
Within a row, P < 0.01 for the following comparisons of AUC: a BMI v. WC, b. BMI v. WHtR, c. WC v. WHtR
Table 3. Comparison of the AUC for obesity indicators regarding metabolic syndrome: adjusted for age as continuous variable.
BMI WC WHtR
Men (n=2,584) 0.75 (0.73-0.77) 0.77 (0.75-0.79) a 0.76 (0.75-0.78)
Women (n= 3,576) 0.86(0.85-0.87) 0.87 (0.86-0.88) 0.87 (0.86-0.88)
Values are presented AUCs (95% CI). AUC estimated by ROC analysis. AUC, area under the receiver-operating characteristics curve
- 10 -
Table 4. Comparison of the AUC for obesity indicators regarding metabolic syndrome according to age group (n=6,160). BMI WC WHtR Men (n=2,584 ) 19-39 yr (n=933 ) 0.80 (0.78-0.83) 0.82 (0.79-0.84) 0.83 (0.81-0.85) 40-60yr (n=1,051) 0.68 (0.66-0.71) 0.71 (0.69-0.74) 0.71 (0.68-0.74) 61+ yr (n=600) 0.68 (0.65-0.72) 0.71 (0.67-0.75) 0.69 (0.66-0.73) Women (n= 3,576) 19-39 yr (n=1,282) 0.92 (0.91-0.94) 0.92 (0.91-0.94) 0.93 (0.91-0.94) 40-60yr (n=1,368) 0.78 (0.76-0.81) 0.82 (0.79-0.84) a 0.82 (0.80-0.84) b 61+ yr (n=926) 0.69 (0.66-0.72) 0.74 (0.71-0.77) a 0.72 (0.69-0.75) b Values are presented AUCs (95% CI). AUC estimated by ROC analysis.
AUC, area under the receiver-operating characteristics curve
Within a row, P < 0.01 for the following comparisons of AUC: a BMI v. WC, b. BMI v. WHtR, c. WC v. WHtR
- 11 -
Fig. 1. Prevalence of metabolic syndrome.
* Value is significantly different from each other by chi-square test. (p<0.05)
12.3 6.1 15.1 16.8 19.1 4 17.5 42.5 0 5 10 15 20 25 30 35 40 45 All age 19-39 40-60 61+ Pr ev al en ce o f m et ab ol ic s yn dr om e (% )
Age category (year)
Male Female *
*
- 12 -
III. DISCUSSION
We compared three anthropometric obesity indices in terms of prediction for MS by using data from the Fourth Korea National Health and Nutrition Examination Surveys (KNHANES IV). While WHtR was better predictor for MS than other anthropometric obesity indices in entire age group, there was no difference among three obesity indices after adjusted for age. After stratification of subjects according to age, three obesity indices had similar predictability in men and young women while only BMI showed inferior predictability for MS in middle-aged and elderly women.
MS is considered as stronger risk factor than any individual risk factors for morbidity (Isomaa et al., 2001) and mortality of cardiovascular disease.(Malik et al., 2004) Compared with individuals with no risk factors, those with one to two syndrome factors had higher risk for cardiovascular mortality (Hazard ratio = 1.7) and if they had the full metabolic syndrome – three to five risk factors, Hazard ratio is even higher 2.7. Ho reported that both cardiovascular and all-cause mortality increases as the number of MS risk factors increases. (Ho et al., 2008) This finding is supported by other study.(Ford, 2004) Therefore, to estimate more accurate cardiovascular risk, we investigated ROCs of obesity indices with MS rather than individual risk factor as a surrogate for morbidity and mortality of CVD.
Previous studies (Schneider et al., 2007), (Can et al., 2009), (Hsieh and Muto, 2006) have reported WHtR has the highest level of predictability for MS among obesity indicators in entire age group, which is consistent with findings from our study. Many studies (Ho et al., 2003), (Lee et al., 2008a), (Park et al., 2009),(Hsieh et al., 2003) reported WHtR is superior predictor to WC and BMI for WHtR is more correlated with cardiovascular risk factors such
- 13 -
as hypertension, diabetes, dyslipidemia and proposed that height is so important parameter that height should be taken into consideration in predicting cardiovascular risk more precisely.
Schneider made an intriguing remark in his paper, questioning the superiority of WHtR. When he did compare BMI, WC and WHtR after dividing subjects into 3 separate age groups (20–44yr, 45–65yr, and 66–79yr), comparison among AUCs of 3 obesity indices revealed no differences in each separate age group, even though, the AUC for WHtR for MS was significantly greater than others in entire age group.(Schneider et al., 2007) This observation is also in agreement with results of our research. When compared within 3 different age groups, three obesity indices showed similar predictability in men and young women and even WHtR was not superior to WC in middle aged and elderly women group. Adjusting WC with height does not seem to offer better predictability for cardiovascular risk than WC alone.
Anthropometric indices changes with aging. Height grows smaller due to osteoporotic change in vertebrae constantly with age that is positively correlated with CVD risk factors.(Hsieh et al., 2003),(Hsieh et al., 2000) First National Health and Nutrition Examination Survey Epidemiologic Follow-Up Study tracking 13,031 men and women for 13 years, found no relation between height and CVD when age and years of education were adjusted for(Liao et al., 1996), suggesting age may account for the height-CVD relation as a key confounder. This finding is reinforced by the Framingham Heart Study.(Kannam et al., 1994)
When previous studies calculated AUCs of anthropometric indices, they analyzed entire age group all together without considering age related changes in anthropometric parameters, In systemic review of 78 studies(Browning et al., 2010), most studies showed, age adjusted
- 14 -
odd ratio for diabetes and CVD of 3 obesity indices were similar each other and age adjusted odd ratio for cardiovascular risk factor of WC and WHtR were similar with each other but higher than BMI’s like our studies.
For we calculated AUC of obesity indices for metabolic syndrome by gender and age groups, our result reflected the effects of age-related change in anthropometry on the relationship between obesity indicators and cardiovascular risk.
Previously observed trend of inverse association between height and cardiovascular morbidity might be mostly due to a confounding relation of height with age.(Liao et al., 1996)
In the present study, when compared within three age groups, BMI had lowest predictability for MS in middle-aged and elderly women but BMI had similar predictability with WHtR in the other groups. In women, increasing parity and menopause was associated with increase in fat mass and redistribution of fat to abdominal area and decrease in lean body mass.(Stevens et al., 2010) But BMI reflects only body weight and cannot discriminate between lean body mass and fat mass especially after menopause, so that its validity for CVD risk prediction depreciate in middle-aged and elderly women.
We used data from a cross-sectional survey which only allows showing the association between obesity indices and MS at present and is not good enough to investigate the future CVD risk for clinical implication. To calculate precise future cardiovascular risk with obesity index, longitudinal study should be conduct as a next step of our research.
Subjects of our study were large nationwide samples of Korean population. Most previous investigations were not nationally sampled and less representative for general population for most of them recruited the volunteers from neighborhood groups(Can et al., 2009), primary care setting(Schneider et al., 2007),clinic for regular health checkup.(Hsieh and Muto, 2006)
- 15 -
IV. CONCLUSION
In conclusion, there is no superiority among obesity indicators to predict MS – the best surrogate for CVD risk in men and young women, which is a misunderstanding originated from ignoring the effect of aging on anthropometric parameters. BMI has less predicting power for MS in middle-aged and elderly women than WC and WHtR. In the future, longitudinal studies should be carried out to assess future cardiovascular risk by using anthropometric obesity indices.
- 16 -
REFERENCES
1. Browning LM, Hsieh SD, Ashwell M: A systematic review of waist-to-height ratio as a screening tool for the prediction of cardiovascular disease and diabetes: 0.5 could be a suitable global boundary value. Nutr Res Rev 23: 247-269, 2010
2. Can AS, Bersot TP, Gonen M, Pekcan G, Rakicioglu N, Samur G, Yildiz EA: Anthropometric indices and their relationship with cardiometabolic risk factors in a sample of Turkish adults. Public Health Nutr 12: 538-546, 2009
3. Carr MC, Brunzell JD: Abdominal obesity and dyslipidemia in the metabolic syndrome: importance of type 2 diabetes and familial combined hyperlipidemia in coronary artery disease risk. J Clin Endocrinol Metab 89: 2601-2607, 2004
4. Choi HS, Oh HJ, Choi H, Choi WH, Kim JG, Kim KM, Kim KJ, Rhee Y, Lim SK: Vitamin D insufficiency in Korea--a greater threat to younger generation: the Korea National Health and Nutrition Examination Survey (KNHANES) 2008. J Clin
Endocrinol Metab 96: 643-651, 2011
5. DeLong ER, DeLong DM, Clarke-Pearson DL: Comparing the areas under two or more correlated receiver operating characteristic curves: a nonparametric approach.
Biometrics 44: 837-845, 1988
6. Executive Summary: Executive Summary of The Third Report of The National Cholesterol Education Program (NCEP) Expert Panel on Detection, Evaluation, And Treatment of High Blood Cholesterol In Adults (Adult Treatment Panel III). JAMA 285: 2486-2497, 2001
all-- 17 all--
causes: findings from the National Health and Nutrition Examination Survey II Mortality Study. Atherosclerosis 173: 309-314, 2004
8. Fox CS, Massaro JM, Hoffmann U, Pou KM, Maurovich-Horvat P, Liu CY, Vasan RS, Murabito JM, Meigs JB, Cupples LA, D'Agostino RB, Sr., O'Donnell CJ: Abdominal visceral and subcutaneous adipose tissue compartments: association with metabolic risk factors in the Framingham Heart Study. Circulation 116: 39-48, 2007 9. Fuchs FD, Gus M, Moreira LB, Moraes RS, Wiehe M, Pereira GM, Fuchs SC:
Anthropometric indices and the incidence of hypertension: a comparative analysis.
Obes Res 13: 1515-1517, 2005
10. Gruson E, Montaye M, Kee F, Wagner A, Bingham A, Ruidavets JB, Haas B, Evans A, Ferrieres J, Ducimetiere PP, Amouyel P, Dallongeville J: Anthropometric assessment of abdominal obesity and coronary heart disease risk in men: the PRIME study. Heart 96: 136-140, 2010
11. Ho JS, Cannaday JJ, Barlow CE, Mitchell TL, Cooper KH, FitzGerald SJ: Relation of the number of metabolic syndrome risk factors with all-cause and cardiovascular mortality. Am J Cardiol 102: 689-692, 2008
12. Ho SY, Lam TH, Janus ED: Waist to stature ratio is more strongly associated with cardiovascular risk factors than other simple anthropometric indices. Ann Epidemiol 13: 683-691, 2003
13. Hsieh SD, Muto T: Metabolic syndrome in Japanese men and women with special reference to the anthropometric criteria for the assessment of obesity: Proposal to use the waist-to-height ratio. Prev Med 42: 135-139, 2006
14. Hsieh SD, Yoshinaga H, Muto T: Waist-to-height ratio, a simple and practical index for assessing central fat distribution and metabolic risk in Japanese men and women.
- 18 -
Int J Obes Relat Metab Disord 27: 610-616, 2003
15. Hsieh SD, Yoshinaga H, Muto T, Sakurai Y: Anthropometric obesity indices in relation to age and gender in Japanese adults. Tohoku J Exp Med 191: 79-84, 2000 16. Hsieh YH: Do people with similar waist circumference share similar health risks
irrespective of height? Tohoku J Exp Med 188(1): 55-60, 1999
17. Hubert HB, Feinleib M, McNamara PM, Castelli WP: Obesity as an independent risk factor for cardiovascular disease: a 26-year follow-up of participants in the Framingham Heart Study. Circulation 67: 968-977, 1983
18. Isomaa B, Almgren P, Tuomi T, Forsen B, Lahti K, Nissen M, Taskinen MR, Groop L: Cardiovascular morbidity and mortality associated with the metabolic syndrome.
Diabetes Care 24: 683-689, 2001
19. Jeong BG MO, Kim NS, Kang JH, Yoon TH, Lee SY et al. : Socioeconomic Costs of Obesity for Korean Adults. Korean J Prev Med. 35(1): 1-12, 2002
20. Kang JH JB, Cho YG, Song HR, Kim KA.: Socioeconomic Costs of Overweight and Obesity in Korean Adults. J Korean Med Sci. 26(12): 1533-1540, 2011
21. Kannam JP, Levy D, Larson M, Wilson PW: Short stature and risk for mortality and cardiovascular disease events. The Framingham Heart Study. Circulation 90: 2241-2247, 1994
22. Khang YH, Yun SC: Trends in general and abdominal obesity among Korean adults: findings from 1998, 2001, 2005, and 2007 Korea National Health and Nutrition Examination Surveys. J Korean Med Sci 25: 1582-1588, 2010
23. Kim Y, Lee BK: Iron deficiency increases blood manganese level in the Korean general population according to KNHANES 2008. Neurotoxicology 32: 247-254, 2011
- 19 -
24. Lakka LT, Tuomilehto J, Salonen JT. : Abdominal obesity is associated with increased risk of acute coronary events in men. Eur Heart J 23: 706–713, 2002 25. Lee CM, Huxley RR, Wildman RP, Woodward M: Indices of abdominal obesity are
better discriminators of cardiovascular risk factors than BMI: a meta-analysis. J Clin
Epidemiol 61: 646-653, 2008a
26. Lee K, Song YM, Sung J: Which obesity indicators are better predictors of metabolic risk?: healthy twin study. Obesity (Silver Spring) 16: 834-840, 2008b
27. Lee SW, Kim YC, Oh SW, Koo HS, Na KY, Chae DW, Kim S, Chin HJ: Trends in the prevalence of chronic kidney disease, other chronic diseases and health-related behaviors in an adult Korean population: data from the Korea National Health and Nutrition Examination Survey (KNHANES). Nephrol Dial Transplant, 2011
28. Liao Y, McGee DL, Cao G, Cooper RS: Short stature and risk of mortality and cardiovascular disease: negative findings from the NHANES I epidemiologic follow-up study. J Am Coll Cardiol 27: 678-682, 1996
29. Lopez-Alvarenga JC, Montesinos-Cabrera RA, Velazquez-Alva C, Gonzalez-Barranco J: Short stature is related to high body fat composition despite body mass index in a Mexican population. Arch Med Res 34: 137-140, 2003
30. Malik S, Wong ND, Franklin SS, Kamath TV, L'Italien GJ, Pio JR, Williams GR: Impact of the metabolic syndrome on mortality from coronary heart disease, cardiovascular disease, and all causes in United States adults. Circulation 110: 1245-1250, 2004
31. Park SH, Choi SJ, Lee KS, Park HY: Waist circumference and waist-to-height ratio as predictors of cardiovascular disease risk in Korean adults. Circ J 73: 1643-1650, 2009
- 20 -
32. Poirier P, Eckel RH: Obesity and cardiovascular disease. Curr Atheroscler Rep 4: 448-453, 2002
33. Poirier P, Giles TD, Bray GA, Hong Y, Stern JS, Pi-Sunyer FX, Eckel RH: Obesity and cardiovascular disease: pathophysiology, evaluation, and effect of weight loss: an update of the 1997 American Heart Association Scientific Statement on Obesity and Heart Disease from the Obesity Committee of the Council on Nutrition, Physical Activity, and Metabolism. Circulation 113: 898-918, 2006
34. Schneider HJ, Glaesmer H, Klotsche J, Bohler S, Lehnert H, Zeiher AM, Marz W, Pittrow D, Stalla GK, Wittchen HU: Accuracy of anthropometric indicators of obesity to predict cardiovascular risk. J Clin Endocrinol Metab 92: 589-594, 2007 35. Stevens J, Katz EG, Huxley RR: Associations between gender, age and waist
circumference. Eur J Clin Nutr 64: 6-15, 2010
36. Wajchenberg BL: Subcutaneous and visceral adipose tissue: their relation to the metabolic syndrome. Endocr Rev 21: 697-738, 2000
37. Welfare KMoHa (1999). The Korean National Health Nutrition Examination Survey 1998, Seoul. In Korean Ministry of Health and Welfare.
38. Wellens RI RA, Khamis HJ, Jackson AS, Pollock ML, Siervogel RM. : Relationships between the Body Mass Index and body composition. Obes Res 4: 35– 44, 1996
39. WHO: Obesity: preventing and managing the global epidemic. Report of a WHO consultation. World Health Organ Tech Rep Ser 894: i-xii, 1-253, 2000
40. Yoon KH, Lee JH, Kim JW, Cho JH, Choi YH, Ko SH, Zimmet P, Son HY: Epidemic obesity and type 2 diabetes in Asia. Lancet 368: 1681-1688, 2006
- 21 - - 국문요약 –
대사
증후군을 예측하는 가장 유용한 비만 지표
아주대학교 대학원 의학과 김 수 연 (지도교수: 김 범 택) 연구 배경: 최근에는 허리둘레-신장비가 심혈관계 질환의 위험을 예측하는 데 있어 체질량지수와 허리둘레보다 더 우수한 지표라는 연구결과들이 발표되고 있다. 본 연구는 성별과 연령에 따라 대사 증후군을 가장 잘 예측할 수 있는 비만의 지표를 규명하고자 하였다. 방법: 2008년도 1월부터 12월까지 시행된 제 4기 2차년도 국민건강영양조사에 참여한 19세 이상의 성인 6,610명을 대상으로 단면적 연구를 시행하였다. 비만지표들의 예측력을 비교하기 위해 대사증후군에 대한 각 지표들의 areas under the receiver-operating characteristics curves (AUC)를 분석하였다.결과: 전체 연령에서 볼 때, 남녀 모두 대사증후군에 대한 허리둘레-신장비의 AUC가 가장 높았다. 그러나 연령을 보정한 후에는 세 개의 비만 지표의 예측력 간에 차이가 없었다. 세 개의 다른 연령 군으로 분류하여 비교했을 때 남성과 19-39세 여성에서는 세 개의 비만 지표의 예측력에 차이가 없었다. 40-60세
- 22 - 여성과 61세 이상의 여성 군에서는 허리둘레-신장비와 허리둘레의 AUC는 서로 유사했으며 체질량지수의 AUC는 이보다 낮았다. 결론: 남성과 19-39세 여성 군에서는 대사증후군을 예측하는 데 있어 비만지표들 사이에 우위가 없다. 40-60세와 61세 이상의 여성 군에서는 체질량지수가 허리둘레, 허리둘레-신장비보다 낮은 예측력을 보였다. 핵심어: 허리둘레-신장비, 허리둘레, 체질량지수, 대사증후군