People with People in Mind K O R E A IN S TI TU TE F O R H E ALTH AN D S O C IA L A FFAI R S Policy Report 2020-04
How Happy Are Koreans?
Measuring Happiness and
Quality of Life in Korea
Jung Hae-Sik Kim Seonga
How Happy Are Koreans? Measuring Happiness and Quality of Life in Korea
ⓒ 2020
Korea Institute for Health and Social Affairs All rights reserved. No Part of this book may be reproduced in any form without permission in writing from the publisher
Korea Institute for Health and Social Affairs Building D, 370 Sicheong-daero, Sejong city 30147 KOREA
http://www.kihasa.re.kr
ISBN: 978-89-6827-686-6 93330
【Project Head】
Jung Hae-sik Research Fellow, Korea Institute for Health
and Social Affairs (KIHASA)
【Co-authors】
Kim Seonga Associate Research Fellow, Korea Institute for
Ⅰ. Introduction ···1
Ⅱ. Data for Analysis ···7
Ⅲ. Koreans’ Happiness Perception ···15
1. Koreans’ Happiness, 2019 ···17
2. Conditions of Happiness ···19
3. Happiness of Others ···23
4. Words Associated with Happiness ···24
5. Expectation and Desire for Happiness ···29
Ⅳ. Mapping Koreans’ Happiness ···31
1. Age and Happiness ···33
2. Region and Happiness ···36
3. Day of the Week and Happiness ···38
4. Areas of Life and Happiness ···41
5. Personality and Happiness ···42
Ⅴ. Conclusion ···45
References ···51
KOREA INSTITUTE FOR HEALTH AND SOCIAL AFFAIRS
Contents
<Table 2-1〉 Survey on Koreans’ Happiness and Quality of Life 2019 ···9 〈Table 2-2〉 Structure of the Questionnaire for Survey on Koreans’
Happiness and Quality of Life 2019 ···10 〈Table 2-3〉 Respondent Details ···12 〈Table 3-1〉 Conditions of Happiness ···21 〈Table 3-2〉 Life Satisfaction Grades (LSG) and Subjective
Assessment of Enjoyment of Conditions of Happiness ···22 〈Table 3-3〉 Happiness of Others ···24 〈Table 3-4〉 Centrality of Simultaneously Occurring Words
Associated with Happiness by Sex ···26 〈Table 3-5〉 Centrality of Simultaneously Occurring Words
Associated with Happiness by Age ···28 〈Table 3-6〉 Expectations and Desire for Happiness by
Income Quintile ···30 〈Table 4-1〉 Age and Happiness ···34 〈Table 4-2〉 Effective Sample Sizes and Happiness Scores by
Region ···37 〈Table 4-3〉 Day of the Week and Happiness ···39
KOREA INSTITUTE FOR HEALTH AND SOCIAL AFFAIRS
List of Tables
〔Figure 1-1〕 Objective Living Standard and Subjective Quality of Life (2017) ···4 〔Figure 3-1〕 Koreans’ Happiness ···18 〔Figure 4-1〕 Koreans’ Life Satisfaction by Age ···34 〔Figure 4-2〕 Histograms of Life Satisfaction and Yesterday’s
Happiness by Age ···36 〔Figure 4-3〕 Day of the Week, Happiness, and Employment Status ····40 〔Figure 4-4〕 Sociodemographic Factors, Regions, and Satisfaction
with Areas of Life ···42 〔Figure 4-5〕 Personality Types and Happiness ···43
KOREA INSTITUTE FOR HEALTH AND SOCIAL AFFAIRS
List of Figures
People with People
in Mind
KOREA INSTITUTE FOR HEALTH AND SOCIAL AFFAIRS
Ⅰ
Although the South Korean government has embraced “happiness” as a core value to be pursued in policymaking, Koreans’ sub-jective happiness has not improved over the years. World Happiness Report 2018 ranks Korea in 57th out of 156 coun-tries in terms of happiness, with Koreans scoring 5.875 out of 10.000 on average. The country managed to climb ever so slightly to 54th place (5.895/10.000) on the 2019 report (Helliwell, Layard, and Sachs, 2018 and 2019). Considering that Korea ranks 29th in terms of gross domestic product (GDP) per capita —a typical indicator of social and economic development— (IMF, 2019), Koreans’ reported sense of happiness comes up quite short of what their affluence would have us believe.
Figure 1-1 shows how the member states of the Organisation for Economic Cooperation and Development (OECD) fares in terms of scores based on recalibrating indicators of the OECD Better Life Index, divided roughly between indicators of the ob-jective living standard and those of subob-jective quality of life. Korea is ranked the lowest, along with South Africa, in terms of subjective quality of life, but placed 22nd among 38 countries in terms of the objective living standard (Jung et al., 2018, p. 124). Part of the low subjective quality of life in Korea may
4 How Happy Are Koreans? Measuring Happiness and Quality of Life in Korea
have to do with the particular methods in which these surveys are conducted or Korean culture in general (Jung et al., 2018, pp. 261-263). However, in order to improve Koreans’ well-being, it is also important to address and identify the root caus-es of the consistent dissatisfaction with life they report.
〔Figure 1-1〕 Objective Living Standard and Subjective Quality of Life (2017) (Unit: points)
Note: The x-axis indicates the objective living standard; the y-axis, subjective quality of life.
Source: Jung Hae-sik et al. (2018), Policy Task Development for the Improvement of Quality of Life, National Research Council for Economics, Humanities, and Social Sciences (NRC). p. 124.
To make sense of this obvious gap between the material con-ditions of living and subjective/emotional wellbeing, we need to accumulate empirical evidence on how happy Koreans are,
Ⅰ. Introduction 5
and why they are not as happy as their material conditions would suggest. The purpose of this study is to gather and pres-ent empirical data on Koreans’ happiness and quality of life so as to help researchers find a theoretical model of Koreans’ happiness and aid policy makers in developing specific policy solutions toward improving Koreans’ quality of life. Section II presents the frame of analysis used by this study to gain a com-prehensive picture of Koreans’ experiences with happiness, and introduces the data that have been subjected to statistical analysis. Section III quantifies Koreans’ perceived sense of happiness and deviations thereof. Section IV discusses how Koreans experience and perceive happiness as individuals and groups. And Section V provides a conclusion.
People with People
in Mind
KOREA INSTITUTE FOR HEALTH AND SOCIAL AFFAIRS
Ⅱ
Survey on Koreans’ Happiness and Quality of Life 2019 was conducted to gauge Koreans’ subjective wellbeing, what sig-nificance and conditions they attach to happiness, individual Koreans’ psychological competence and perceptions, and im-portant conditions of living that are known to affect one’s sense of happiness.1) Table 2-1 provides an overview of the survey. 〈Table 2-1〉 Survey on Koreans’ Happiness and Quality of Life 2019
Subject Description
Target population Adult Koreans, male and female, aged 19 to 80, across South Korea
Sampling unit One person per household (households randomly selected by the system) Sample size 5,000 respondents across 502 output areas (questionnaire
completed by 5,020 persons) Sampling Census output area survey
Survey method Face-to-face interview based on a structuralized questionnaire Survey period May 8 to June 13, 2019
Survey agency Metrics Corporation
The survey includes a variety of questions on subjects other than those discussed in this study. The major indicators gauged by the survey, the questions used to gauge them, and other pertinent studies in the literature are summarized in Table 2-2. 1) The questionnaire, survey method, and use of data were approved by the Korea Institute of Health and Social Affairs (KIHASA)’s bioethics committee (No. 2019-17, April 18, 2019).
10 How Happy Are Koreans? Measuring Happiness and Quality of Life in Korea
〈Table 2-2〉 Structure of the Questionnaire for Survey on Koreans’ Happiness and Quality of Life 2019
Type Indicator Question References
Depen dent variabl
es
Eudaimonia Value of life
“Overall, to what extent do you feel the things you do in your life are worthwhile?” Cantril (1965), Gallup (2014), Helliwell, Layard, & Sachs (2019), Kahneman et al., (2004), OECD (2013), Kim et al. (2017) Life satisfaction Overall life satisfaction
“Overall, how satisfied are you with life as a whole these days?”
Cantril Ladder
(life evaluation)
“Please imagine a ladder with steps numbered from zero at the bottom to ten at the top. Suppose we say that the top of the ladder represents the best possible life for you and the bottom of the ladder represents the worst possible life for you. If the top step is 10 and the bottom step is 0, on which step of the ladder do you feel you personally stand at the present time?”
Areas of life
“How satisfied are you with each of the following areas of your life now?: (1) Living standard; (2) health; (3) achievements; (4) personal relationships; (5) safety; (6) future security; (7) leisure; (8) local community; (9) occupation.”
Affective happiness
Positive
feelings “How happy were you yesterday?”
Negative feelings
[Depression] “How depressed were you yesterday?”
[Stress] Stress awareness scale
Cohen, Kamarck, & Mermelstein (1983) Depen dent variabl es
Expectation and desire for happiness
Expected/desired levels of happiness five years in the future
Economic and Social Research Institute (2012) (Japan Quality of Life Survey) Happiness of others Of family, friends, neighbors, fellow
countrypeople, and the world
Conditions of happiness
Whether conditions for happiness are met, and what conditions should be met for more happiness
KRIVET (2016) (Korean Education and Employment Panel Survey) Meaning of happiness [Open-ended question]
Ⅱ. Data for Analysis 11
Type Indicator Question References
Importance of areas of happiness
[Open-ended question] Life values and goals, relationships, housing, quality of living environment, work, quality of living, financial stability, health, security, quality of governance Kim et al. (2017) Param eters Psychological competence/ perception
Personality Five factors of personality KRIVET (2016) Material
values Material values scale
Richins & Dawson (1992)
Relative
concern Ability and opinion
Relative concern scale (Gibbons and Buunk, 1999; quoted in Choi et al. (2019), p. 140) Class perception
Subjective income class, experience with/expectation of interclass mobility, etc.
Yeo and Jung et al. (2015)
Trust
Trust in people in general/society/ government, corruption perception, role of government, trust in taxation system, etc. Inglehart et al. (2014).; KIHASA (2016) (Korean Welfare Panel Survey) Social views
Role of government, perceptions of fairness/class/conflict/society, social anxiety, etc.
Indepe ndent variabl es Living standard Economic and financial
Employment, experience with unemployment, home ownership status, income, assets, debts, spending, deprivations, etc.
Kim and Yeo et al. (2014)
Individual
Yesterday’s experience, freedom of choice, current/desired levels of leisure Gallup (2018); Statistics Korea (2016) (Living Time Survey) Relational
Family, interpersonal relations, social support, social capital, sense of belonging, etc.
Inglehart et al. (2014)
Participatory
Participation in groups, associations, religion, altruistic activities, politics, etc.
Institutional
Governance, union, social security net, experience with receiving government transfers
Control variables Demographic attributes
Sex, age, education, health, household characteristics, siblings, etc.
12 How Happy Are Koreans? Measuring Happiness and Quality of Life in Korea
Weights were assigned to regions, sexes, and ages to ensure the national representativeness of the final sample. All the re-sults of the statistical survey discussed herein reflect these weights. Table 2-3 presents the distribution of numbers of weighted cases and respondent details.
〈Table 2-3〉 Respondent Details
Subject N Percentage Overall 5020 100.00 Sex Male 2538 50.56 Female 2482 49.44 Age 20s or younger 918 18.29 30s 889 17.72 40s 1010 20.13 50s 1043 20.77 60s 738 14.70 70s 421 8.40 Region Seoul-Gyeonggi-Incheon 2505 49.91 Elsewhere 2515 50.09 Metropolitan 429 8.55 Small-to-medium city 2154 42.91 Rural 2437 48.54 Subjective income level Low-income 393 7.82 Lower-middle income 1755 34.96 Middle-income 2539 50.57
Upper-middle and high income 334 6.65
Type Indicator Question References
Cover information
Respondent details, relationship to household head, address (metropolitan/provincial, municipal), date and day of participation, participation in recruitment survey, interview method, housing type, etc.
Ⅱ. Data for Analysis 13
Note: Numerical figures pertain to groups and reflect individual weights. Security of employment has been measured with respect to paid and employed respondents only.
Source: KIHASA (2019, Survey on Koreans’ Happiness and Quality of Life 2019 (data re-analyzed and formatted by the authors).
Subject N Percentage Equivalized monthly household income Less than KRW 2,000,000 1325 26.39 KRW 2,000,000 to 2,999,999 1853 36.91 KRW 3,000,000 to 3,999,999 1061 21.13 KRW 4,000,000 to 4,999,999 438 8.72 KRW 5,000,000 or more 344 6.85 Education
Middle school or less 569 11.34
High school 1924 38.34
College or more 2526 50.32
Employment status
Full-time and paid 2222 44.27
Temporary/day and paid 519 10.33
Employer/self-employed 899 17.90
Unpaid worker in family business 87 1.72
Unemployed 71 1.41
Out of labor force 1223 24.37 Employment Status Regular 1961 75.99 Irregular 620 24.01 Ideological orientation Conservative 1359 27.08 Neutral 2114 42.12 Progressive 1546 30.81
People with People
in Mind
KOREA INSTITUTE FOR HEALTH AND SOCIAL AFFAIRS
Ⅲ
Koreans’ Happiness
Perception
1. Koreans’ Happiness, 2019 2. Conditions of Happiness 3. Happiness of Others4. Words Associated with Happiness 5. Expectation and Desire for Happiness
1. Koreans’ Happiness, 2019
Survey on Koreans’ Happiness and Quality of Life 2019 (KIHASA, 2019a) uses five indicators to gauge Koreans’ happiness.
The five indicators are: life evaluation, life satisfaction, hap-piness experienced yesterday as positive emotional wellbeing, depression experienced yesterday as negative emotional well-being and eudaimonia (or one’s life value affirmed). Respondents were asked to rate their happiness according to each indicator on a Likert scale ranging from zero to 10. The guideline for re-spondents specifically states: “Do not think too hard about the following statements. Answer according to your immediate response.” The five indicators and the injunction against over-thinking are appropriated from the OECD Guidelines on Measuring Subjective Well-being (OECD, 2013).2)
Of the five indicators, four (life evaluation, life satisfaction, yesterday’s happiness, and life value) indicate positive experi-ences, while one (yesterday’s depression) indicates negative experiences. Our analysis of the raw data for the survey shows
2) OECD (2013) specifically told respondents to finish answering all five questions in 90 seconds.
Ⅲ
Koreans’ Happiness
18 How Happy Are Koreans? Measuring Happiness and Quality of Life in Korea
a correlation of 0.6846 (p = 0.000) between life satisfaction and life evaluation; 0.5818 (p = 0.000) between life satisfaction and yesterday’s happiness; 0.4934 (p = 0.000) between life satisfaction and eudaimonia; and 0.0899 (p = 0.000) between life satisfaction and yesterday’s depression.
Our analysis also shows that, as of 2019, Koreans gave rela-tively high ratings to their current life satisfaction (6.95), yes-terday’s happiness (6.94), and eudaimonia (6.91), with standard deviations of 1.2 to 1.3. The average rating of yesterday’s de-pression was relatively low, at 3.35, but the standard deviation amounted to 2.
〔Figure 3-1〕 Koreans’ Happiness
(Unit: points)
Note: As measured using a Likert scale ranging from 0 to 10. Figures in parentheses indicate standard deviations. All values are weighted.
Ⅲ. Koreans’ Happiness Perception 19
2. Conditions of Happiness
Table 3-1 lists the conditions Koreans think of as essential to happiness. The effect of financial conditions was measured by matching the conditions of happiness identified by respondents with their household quintiles based on equivalized total house-hold income. The most popular choice was “raising a happy family with a good spouse,” which garnered 31 percent of the votes. It was followed by “living healthy” (26.3 percent), “gaining wealth and honor” (12.7 percent), “working in a job that suits one’s talents and aptitudes” (10.4 percent), and “enjoying lei-surely activities” (7.6 percent).
However, note that “living healthy” garnered the most votes (40.8 percent) from respondents in the first (lowest) income quintile. The share of votes for “raising a happy family with a good spouse” grows as we move up the quintiles, reaching 42.7 percent among respondents from the fifth (highest) quintile. In Quintiles 2 through 5, however, “living healthy” consistently ranked second, with 20 percent or so of votes. In general, al-truistic behavior, such as “contributing to social progress” and “volunteering for others,” garnered less than one percent of the votes, suggesting that Koreans largely confine happiness to the personal and private domains.
As a second-choice condition of happiness, “enjoying leisurely activities” was the most popular (22.5 percent overall), followed
20 How Happy Are Koreans? Measuring Happiness and Quality of Life in Korea
by “living healthy” (21.2 percent), “gaining wealth and honor” (13.4 percent), “working in a job that suits one’s talents and ap-titudes” (11.9 percent), and “raising a happy family with a good spouse” (10.9 percent). Note the relative variety of the second choices, whereas the first choices tend to be concentrated on only a few options. This shows that Koreans assign importance to their own health, social and economic achievements, rela-tionships with others, and ability to spend time freely as con-ditions of their happiness.
Among first-quintile respondents, “enjoying leisurely activ-ities” (24.3 percent) and “living healthy” (23.9 percent) were the two most popular second choices. The same pattern held in the second quintile (22.0 percent for “living healthy” and 21.3 per-cent for “enjoying leisurely activities”). In both the third and fourth quintiles, these two options also received significant por-tions of the votes, around 20 percent, even though their prior-ities changed somewhat. In the fifth quintile, on the other hand, there was almost no difference in the percentages of the votes given to these options (20.0 percent for “enjoying leisurely activ-ities” and 19.9 percent for “living healthy”). Fifth-quintile re-spondents were significantly more likely than those of other quintiles to choose “working in a job that suits one’s talents and aptitudes” (19.5 percent). Note that the relatively more affluent Koreans value the quality of their work alongside relationships with others, health, and leisure as a key condition of happiness.
Ⅲ. Koreans’ Happiness Perception 21
〈Table 3-1〉 Conditions of Happiness
(Unit: percentage)
Condition Overall Income quintile
1st 2nd 3rd 4th 5th
Raising a happy family with a good
spouse 31.0 25.2 26.9 29.0 31.9 42.7
Living healthy 26.3 40.8 25.7 23.1 20.3 19.5
Gaining wealth and honor 12.7 13.6 15.1 13.3 11.6 9.7 Working in a job that suits one’s
talents and aptitudes 10.4 6.1 11.3 11.0 13.1 11.2 Enjoying leisurely activities 7.6 5.2 8.3 8.3 9.6 7.0 Providing a good education for one’s
children 6.5 5.1 8.3 7.8 4.9 6.2
Learning and self-development 3.7 1.8 2.8 5.6 6.5 1.9 Contributing to social progress 0.9 0.8 1.1 0.8 1.0 1.0 Being active in religion 0.9 1.0 0.5 0.9 1.2 0.8 Volunteering for others 0.1 0.4 0.0 0.1 0.1 0.1
Overall 100 100 100 100 100 100
First-choice answers
Condition Overall Income quintile
1st 2nd 3rd 4th 5th
Enjoying leisurely activities 22.5 24.3 21.3 23.4 22.7 20.0
Living healthy 21.2 23.9 22.0 19.7 20.4 19.9
Gaining wealth and honor 13.4 12.6 13.8 15.3 13.4 12.0 Working in a job that suits one’s
talents and aptitudes 11.9 7.2 9.9 11.3 12.3 19.5 Raising a happy family with a good
spouse 10.9 13.2 12.8 11.0 9.7 7.4
Providing a good education for one’s
children 8.8 9.5 10.6 9.7 8.1 5.9
Learning and self-development 6.0 3.2 4.9 5.4 8.1 8.8 Contributing to social progress 2.0 1.1 2.1 2.2 1.8 2.7 Being active in religion 1.9 2.2 1.8 0.8 2.0 2.7 Volunteering for others 1.5 2.6 0.9 1.3 1.5 1.2
Overall 100 100 100 100 100 100
Second-choice answers
Note: The answers have been listed in descending order according to the overall percentages of the votes garnered. All values are weighted.
22 How Happy Are Koreans? Measuring Happiness and Quality of Life in Korea
Table 3-2 shows the percentages of respondents who an-swered that they were enjoying the conditions of happiness they picked across life satisfaction grades (LSGs). Nearly three- fourths of Koreans appear to be enjoying the conditions of happiness they hold dear, including 70 percent who answered that they enjoy those conditions “well” and another five percent who answered “very well.” Respondents with a low LSG (scoring 4 out of 10 or lower on life satisfaction), unsurprisingly, denied that they enjoyed any conditions of happiness. Those with a high LSG (scoring 8 out of 10 or higher on life satisfaction) were overwhelmingly affirmative of their enjoyment of the con-ditions of happiness.
〈Table 3-2〉 Life Satisfaction Grades (LSG) and Subjective Assessment of Enjoyment of Conditions of Happiness
(Unit: persons, %) LSG (out of 10.0) Effective sample (N, (%)) Not at all Not much Well Very well Overall Low (1.0 to 4.0) 134 (2.7) 27.6 64.9 7.5 0.0 100.0 Middle (5.0 to 7.0) 3110 (62.0) 1.2 30.0 65.6 3.2 100.0 High (8.0 to 10.0) 1776 (35.4) 0.0 10.2 81.4 8.5 100.0 Overall 5020 (100.0) 1.5 23.9 69.6 5.0 100.0
Note: The effective sample sizes are not weighted. Assessments of enjoyment are weighted.
Ⅲ. Koreans’ Happiness Perception 23
3. Happiness of Others
We can also compare how Koreans of different age groups rate their own happiness and the happiness of others around them. Notwithstanding some variations across age, Koreans in general tend to rate the happiness of their families more highly than their own happiness yesterday. The greater the relational distance (from friends to neighbors, fellow Korean and the world), the lower the perceived levels of happiness. Young Koreans tend to rate the happiness of their friends more highly than do other age groups. Their rating of the happiness of their neigh-bors is as low as that rated by seniors.
A similar pattern emerges when we compare Koreans’ ratings of the happiness of others across income quintiles. Koreans rate the happiness of their families more highly than their own happiness yesterday. The greater the relational distance, the lower the perceived levels of happiness. The higher one’s in-come, the higher one’s ratings of the happiness of others com-pared to the ratings given by respondents in lower income quintiles. Respondents in the fifth quintile, for example, rate the happiness of others around them significantly more highly than do respondents in the other four quintiles.
24 How Happy Are Koreans? Measuring Happiness and Quality of Life in Korea
〈Table 3-3〉 Happiness of Others
(Unit: points) Subject of happiness Young (19 to 34) Middle-Aged 1 (35 to 49) Middle-Aged 2 (50 to 64) Elderly (65+) Overall Self (yesterday) 7.07 (1.091) 7.06 (1.176) 6.89 (1.231) 6.49 (1.349) 6.94 (1.212) Family 7.32 (1.085) 7.34 (1.157) 7.13 (1.243) 6.76 (1.403) 7.19 (1.217) Friends 7.22 (1.098) 7.08 (1.251) 6.97 (1.229) 6.60 (1.311) 7.01 (1.230) Neighbors 6.46 (1.336) 6.56 (1.376) 6.57 (1.280) 6.41 (1.304) 6.52 (1.329) Korean 6.18 (1.347) 6.26 (1.498) 6.20 (1.397) 6.16 (1.352) 6.21 (1.412) World 6.09 (1.456) 6.09 (1.591) 6.09 (1.394) 6.00 (1.337) 6.08 (1.466) Age groups Subject of happiness 1st 2nd 3rd 4th 5th Self (yesterday) 6.42 (1.279) 6.83 (1.122) 6.93 (1.123) 7.15 (1.174) 7.43 (1.093) Family 6.69 (1.283) 6.95 (1.119) 7.15 (1.114) 7.40 (1.100) 7.85 (1.104) Friends 6.54 (1.268) 6.79 (1.085) 6.96 (1.094) 7.18 (1.162) 7.67 (1.214) Neighbors 6.22 (1.341) 6.33 (1.243) 6.42 (1.283) 6.53 (1.294) 7.13 (1.279) Korean 5.90 (1.415) 6.10 (1.322) 6.11 (1.380) 6.23 (1.404) 6.76 (1.379) World 5.77 (1.469) 6.02 (1.437) 5.95 (1.461) 6.12 (1.469) 6.60 (1.354) Income quintiles
Note: Figures in parentheses indicate standard deviations and are weighted (means measured using a Likert scale ranging from 0 to 10).
Source: KIHASA (2019)(data re-analyzed and formatted by the authors).
4. Words Associated with Happiness
The 2019 survey asked respondents to give a couple of words that they associate with happiness. With the goal of identifying correlations between the popular words, we used the sns and igraph packages of R to perform a network analysis of simulta-neously occurring words. The simultasimulta-neously occurring words
Ⅲ. Koreans’ Happiness Perception 25
were matched with respondents’ sex and age so as to identify demographic patterns. Words that appeared fewer than 10 times were omitted from analysis as the relations they bore to the concept of happiness appeared to be insufficiently general. Not only the visualization of the correlations between the words but also the degree centrality, closeness centrality, and between-ness centrality of the network analysis were examined. Degree centrality indicates the number of different words that are connected. The higher the number, the stronger the tendency of the given word to occur simultaneously with other words. Closeness centrality expresses the distance of connection between two par-ticular words. The higher the number is, the closer the given words are to the center of diverse words. Betweenness centrality indicates mediation between two different words. The higher the number, the greater the contribution of the given word to the density of the network (Heo, 2012, pp. 13-22).
A total of 92 simultaneously occurring words associated with happiness were given by male respondents. Words such as health, family, children, friends, love and meaningful relationships, money, travel, leisure, and work-life balance figured close to the center of this network. Health, family, children, money, and travel are the five words that frequently appear in different or-ders at the center, as indicated by the indicators of centrality. Health, family, and money, in particular, emerged with the three highest levels of degree centrality, suggesting that these
26 How Happy Are Koreans? Measuring Happiness and Quality of Life in Korea
are the main conditions Korean men most closely associate with happiness. That travel appeared also high on closeness centrality and betweenness centrality suggests that Korean men also seek happiness by engaging in leisurely activities such as travel.
Women gave 104 simultaneously occurring words associated with happiness. Like men, they also placed money, children, family, love, health, friends, and leisure close to the center of the word network. Health, family, and travel, in particular, appeared high on degree centrality. Among women, money ranked fourth in terms of degree centrality, compared to its third position among men. The closeness centrality and betweenness centrality of family were the highest, showing that the words women associate with happiness are slightly different from those of men.
〈Table 3-4〉 Centrality of Simultaneously Occurring Words Associated with Happiness by Sex
Sex Degree centrality Closeness centrality Betweenness centrality
Male
1 Health/healthy (1804) Travel (0.010417) Travel (1353.0) 2 Family (1766) Family (0.010204) Family (1144.5) 3 Money/cash (1670) Health/healthy (0.009615) Health/healthy (947.4) 4 Travel (1646) Children (0.009434) Money/cash (759.1) 5 Children (1132) Money/cash (0.009346) Children (758.5)
Wo men
1 Health/healthy (2472) Family (0.009346) Family (1848.6) 2 Family (2456) Travel (0.008547) Travel (1409.9) 3 Travel (2258) Money/cash (0.008475) Health/healthy (1192.4) 4 Money/cash (2118) Children (0.008475) Money/cash (835.8) 5 Children (1624) Health (0.008333) Health (736.2) Source: KIHASA (2019)(data re-analyzed and formatted by the authors).
Ⅲ. Koreans’ Happiness Perception 27
We can also analyze the network of simultaneously occurring words associated with happiness across age groups (young, Middle-Aged 1 and 2, and elderly). A total of 45 simultaneously occurring words associated with happiness were given by young Koreans. At the center of this network were travel, money, health, family, children, and friends. High on degree centrality were family, health, travel, money, and friends. However, travel appeared with the highest closeness centrality and betweenness centrality, suggesting that young Koreans actualize happiness through travel.
The network of simultaneously occurring words associated with happiness among Koreans in the Middle-Aged 1 group in-cluded 75 words. Children, family, love, friends, travel, money, and health were found at the center. High on degree centrality were family, health, money, travel, and children. “Children” was the word that appeared on this network and not on the network of young Koreans. With family showing the highest closeness centrality and betweenness centrality, we may infer that family holds the central key to the happiness of this age group.
The network of simultaneously occurring words among Koreans in the Middle-Aged 2 group included 90 words, with family, children, friends, travel, health, cash, and parents at the center of the network. Family, health, travel, money, and children were high on degree centrality. Travel emerged as the word with the highest closeness centrality and betweenness centrality in this
28 How Happy Are Koreans? Measuring Happiness and Quality of Life in Korea
group, as it did among young Koreans. Having raised a family and children, Koreans in this age group appear to seek happi-ness through travel and work-life balance.
Seniors’ network of simultaneously occurring words included 49 words. Family, health, children, money, travel, and family emerged close to the center. Health had the highest degree centrality, followed by money, travel, family, and children. That money had the highest closeness centrality and health had the highest betweenness centrality suggests that elderly Koreans focus on health as the fundamental condition of happiness. Whereas money had the third to fifth highest degree centrality, closeness centrality, and betweenness centrality in the preceding groups, it came in second among seniors, suggesting that old-age in-come security is crucial to the happiness of retirees.
〈Table 3-5〉 Centrality of Simultaneously Occurring Words Associated with Happiness by Age
Age group Degree centrality Closeness centrality Betweenness centrality
Young
1 Family (628) Travel (0.021739) Travel (304.5) 2 Health/healthy (566) Health/healthy (0.021277) Health/healthy (256.4) 3 Travel (558) Health/healthy (0.021277) Health/healthy (256.0) 4 Money/cash (544) Money/cash (0.019608) Money/cash (206.0) 5 Friends (326) Children (0.018519) Children (72.0)
Middle -aged
1
1 Family (1376) Family (0.012821) Family (1003.8) 2 Health/healthy (1360) Travel (0.012500) Travel (690.8) 3 Money/cash (1170) Money/cash (0.012048) Health/healthy (622.3) 4 Travel (1162) Children (0.011765) Money/cash (473.6) 5 Children (836) Health/healthy (0.011628) Children (374.3)
Ⅲ. Koreans’ Happiness Perception 29
Source: KIHASA (2019)(data re-analyzed and formatted by the authors).
5. Expectation and Desire for Happiness
Let us compare how Koreans across different income quin-tiles rate their happiness yesterday, expected happiness, and expected/desired happiness five years in the future. There was a correlation of 0.4071 (p = 0.0000) between yesterday’s happi-ness and expected happihappi-ness, 0.5780 (p = 0.0000) between yes-terday’s happiness and happiness five years in the future, and 0.5667 (p = 0.0000) between expected happiness and happiness five years in the future.
Age group Degree centrality Closeness centrality Betweenness centrality
Middle -aged
2
1 Family (1530) Travel (0.010526) Travel (1375.4) 2 Health/healthy (1520) Family (0.010417) Family (1185.9) 3 Travel (1460) Children (0.009901) Health/healthy (831.7) 4 Money/cash (1418) Health/healthy (0.009434) Children (681.2) 5 Children (1148) Money/cash (0.009434) Money/cash (555.3)
Elderly
1 Health/healthy (636) Money/cash (0.019231) Health/healthy (379.2) 2 Money/cash (514) Health/healthy (0.018182) Money/cash (314.7) 3 Travel (490) Family (0.018182) Travel (314.2) 4 Family (474) Travel (0.018182) Family (199.7) 5 Children (358) Children (0.015625) Children (117.2)
30 How Happy Are Koreans? Measuring Happiness and Quality of Life in Korea
〈Table 3-6〉 Expectations and Desire for Happiness by Income Quintile (Unit: points) Subject
Quintile 1 Quintile 2 Quintile 3 Quintile 4 Quintile 5
Overall Differ ence Differ ence Differ ence Differ ence Differ ence Yesterday’s happiness (A) 6.42 6.83 6.93 7.15 7.43 6.94 Expected happiness (B) 7.23 (0.81) 7.59 (0.76) 7.74 (0.81) 7.95 (0.80) 8.02 (0.59) 7.69 (0.75) Happiness 5 years in the future (C) 6.59 (0.16) 7.04 (0.21) 7.28 (0.35) 7.50 (0.35) 7.76 (0.33) 7.22 (0.28) Note: The income quintiles were decided on the basis of levelized household income,
obtained by dividing household income by the root of the number of household members. Figures in parentheses indicate the differences between the three types of happiness and are weighted. The scores are mean scores obtained using a Likert scale ranging from 0 to 10.
Source: KIHASA (2019)(data re-analyzed and formatted by the authors).
Overall, Koreans rated their currently expected happiness at 7.7, or 0.8 points higher than their happiness yesterday (6.9). However, the difference from yesterday’s happiness narrows to 0.3 when it comes to happiness five years in the future. The pattern (future happiness exceeding yesterday’s happiness and currently expected happiness exceeding future happiness) remains con-sistent across all quintiles. The difference between currently expected happiness and yesterday’s happiness is about 0.8 points in all quintiles except in the fifth, where the difference is slightly less (0.6 points). The difference between happiness five years in the future and yesterday’s happiness (i.e., expectation of future happiness) grows as we move up the quintiles, widening to 0.35 or beyond starting with the third quintile.
People with People
in Mind
KOREA INSTITUTE FOR HEALTH AND SOCIAL AFFAIRS
Ⅳ
Mapping Koreans’
Happiness
1. Age and Happiness 2. Region and Happiness
3. Day of the Week and Happiness 4. Areas of Life and Happiness 5. Personality and Happiness
1. Age and Happiness
Koreans can be divided into four groups depending on age: young, for those aged 19 to 34; Middle-Aged 1, aged 35 to 49; Middle-Aged 2, aged 50 to 64; and elderly, aged 65 or older. Life evaluation scores swell among the middle aged, and recede among the elderly. The same pattern emerges for life satisfaction. Young and Middle-Aged 2 Koreans gave their happiness yester-day the highest score (7.1 out of 10.0 each), and the scores were lower among Middle-Aged 1 and the elderly. A similar pattern is observed with respect to eudaimonia as well. However, there is a significant difference in seniors’ ratings of life evaluation, life satisfaction, and eudaimonia, on the one hand, and the rat-ings of other age groups. Seniors are significantly less happy than others. On the other hand, the ratings of yesterday’s hap-piness did not vary so significantly across age groups.
Ⅳ
Mapping Koreans’
34 How Happy Are Koreans? Measuring Happiness and Quality of Life in Korea
〈Table 4-1〉 Age and Happiness Age group Life evaluation Life satisfaction Yesterday’s happiness Yesterday’s depression Eudaimonia Young 6.81 (1.22) 7.03 (1.13) 7.07 (1.09) 3.33 (2.04) 7.06 (1.11) Middle- aged 2 6.94 (1.18) 7.12 (1.10) 7.06 (1.18) 3.32 (2.03) 7.07 (1.13) Middle- aged 1 6.80 (1.27) 6.95 (1.22) 6.89 (1.23) 3.39 (1.95) 6.92 (1.19) Elderly 6.11 (1.64) 6.40 (1.51) 6.49 (1.35) 3.35 (1.93) 6.25 (1.34) Overall 6.76 (1.31) 6.95 (1.23) 6.94 (1.21) 3.35 (1.99) 6.91 (1.20) Note: Young: 19 to 34 years old; Middle-Aged 1: 35 to 49 years old; Middle-Aged 2: 50
to 64 years old; Elderly: 65 years old or older. Figures in the brackets are standard deviations. The mean scores and standard deviations are weighted. The mean scores are based on a Likert scale ranging from 0 to 10.
Source: KIHASA (2019)(data re-analyzed and formatted by the authors).
〔Figure 4-1〕 Koreans’ Life Satisfaction by Age
(Unit: points)
Note: The line graph above the bars represent confidence intervals in light of standard deviations. The mean life satisfaction level and standard deviations are weighted. The mean scores are based on a Likert scale ranging from 0 to 10.
Ⅳ. Mapping Koreans’ Happiness 35
Our analysis shows that Koreans in their 30s are more satisfied with their lives than those in their 20s, and that the life satisfaction scores continue to fall beyond the 30s. As the 2019 survey shows, Koreans in their 70s are significantly less satisfied with their lives than are Koreans in other age groups. The confidence in-tervals based on standard deviations also widen with age, with the standard deviation growing the widest among seniors with-in each given age group. In other words, among seniors, some are very happy, while others are very unhappy.
Figure 4-2 shows histograms of life satisfaction and yester-day’s happiness by age. When asked to rate their life satisfaction out of 10.0, most Koreans gave a rating of 7.0, followed by 8.0, 6.0, and 5.0. This pattern holds constant among young and middle-aged Koreans alike. The percentage of Koreans scoring their life satisfaction at 4.0 or below is not very large. On the other hand, while most seniors, too, gave their life satisfaction a rating of 7.0, the percentage of seniors who did so is consid-erably smaller than is the case with other age groups. A score of 6.0 was the next-most popular, while the difference in the percentages of seniors rating 8.0 and 5.0 is not so significant. Considerably more seniors also rated their life satisfaction at 4.0 or below than did Koreans in other age groups. The differ-ence between the ratings of yesterday’s happiness was not as pronounced as it was for life satisfaction.
36 How Happy Are Koreans? Measuring Happiness and Quality of Life in Korea
〔Figure 4-2〕 Histograms of Life Satisfaction and Yesterday’s Happiness by Age (Unit: points) Life satisfaction Yesterday’s happiness
Source: KIHASA (2019)(data re-analyzed and formatted by the authors).
2. Region and Happiness
We should now look into whether where Koreans live also plays a role in their happiness. We can divide Korea into 17 metropolitan and provincial regions. Table 4-2 shows the ef-fective sample sizes and happiness ratings of Koreans by region. Koreans living in Chungbuk scored the highest (8.2) in terms of life evaluation (based on the Cantril Ladder), followed by those in Sejong (7.5) and Daejeon (7.1). Koreans living in Ulsan had the lowest life evaluation score (6.1), and those in Jeju, the sec-ond-lowest (6.2). Chungbuk again emerged with the highest life satisfaction score (8.2), followed by Sejong (7.5) and Daejeon (7.4). Jeju and Gangwon, by contrast, were the two regions with the lowest life satisfaction scores (6.3 each). Yesterday’s
happi-Ⅳ. Mapping Koreans’ Happiness 37
ness was also rated the highest in Chungbuk (8.0), followed by Daejeon (7.3) and Sejong and Incheon (7.2 each), and the low-est in Jeju (6.3). Ylow-esterday’s depression, a negative indicator, was rated the lowest in Daejeon (2.7) and the next-lowest in Gangwon and Jeju (2.8 each). Gwangju (4.1) and Sejong (3.9) had relatively high scores for yesterday’s depression. As for eu-daimonia, Chungbuk again scored the highest (8.1), followed by Sejong and Daejeon (7.4 each). Jeju and Ulsan had the lowest
eudaimonia scores (6.4 each). In summary, Chungbuk, Sejong, and Daejeon tend to lead other regions in happiness scores, while Jeju and Ulsan tend to tail the other end. However, we should note the shortcomings of the limited effective sample sizes before generalizing these patterns.
〈Table 4-2〉 Effective Sample Sizes and Happiness Scores by Region
Region evaluationLife satisfactionLife Yesterday’s happiness Yesterday’s depression Eudaimonia Seoul 6.96 (1.17) 7.00 (1.17) 6.96 (1.14) 3.68 (1.81) 7.00 (1.09) Busan 6.55 (1.26) 6.91 (1.06) 6.98 (1.10) 3.30 (2.08) 6.76 (1.31) Daegu 6.68 (1.24) 7.10 (1.03) 6.98 (1.18) 2.90 (1.90) 6.96 (1.24) Incheon 6.98 (1.23) 7.09 (0.94) 7.16 (1.02) 3.37 (2.21) 7.07 (1.06) Gwangju 6.88 (1.02) 7.10 (0.94) 7.02 (0.98) 4.05 (2.03) 6.77 (1.02) Daejeon 7.12 (1.16) 7.41 (0.99) 7.28 (1.03) 2.68 (2.09) 7.35 (1.12) Ulsan 6.10 (1.17) 6.37 (1.22) 6.30 (1.19) 3.20 (2.01) 6.38 (1.21) Sejong 7.54 (0.55) 7.51 (0.59) 7.23 (0.51) 3.93 (2.16) 7.43 (0.71) Gyeonggi 6.71 (1.38) 6.92 (1.34) 6.99 (1.25) 3.30 (1.94) 6.93 (1.16) Gangwon 6.25 (1.38) 6.34 (1.45) 6.35 (1.57) 2.77 (2.11) 6.70 (1.37) Chungbuk 8.19 (0.86) 8.20 (0.86) 8.00 (0.83) 3.61 (1.94) 8.07 (0.92)
38 How Happy Are Koreans? Measuring Happiness and Quality of Life in Korea
Note: Figures in the brackets are standard deviations. The mean scores and standard deviations are weighted. The mean scores are based on a Likert scale ranging from 0 to 10.
Source: KIHASA (2019) (data re-analyzed and formatted by the authors).
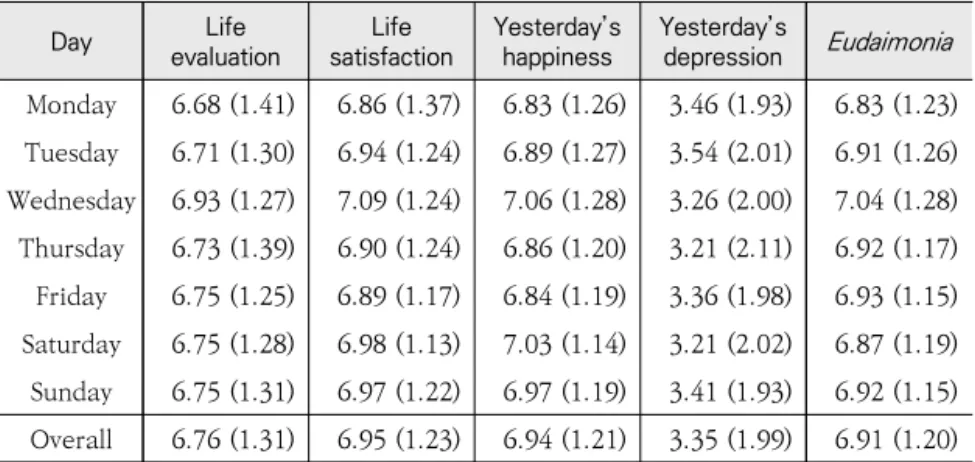
3. Day of the Week and Happiness
Is the day of the week related to Koreans’ happiness? Helliwell and Wang (2013) finds that the days of the week do not have any statistical significance in relation to how respondents rate life evaluation using the Cantril Ladder, but also notes that happiness as an emotional response is significantly higher on the weekends (starting on Fridays) and holidays than on weekdays.
Survey on Koreans’ Happiness and Quality of Life 2019 was conducted from early May to early June in 2019. There was no public holiday during this period except for Memorial Day to-ward the end of the survey period. We may therefore compare whether and how Koreans’ assessment of their own happiness differed across the week. Life evaluation scores based on the
Region evaluationLife satisfactionLife Yesterday’s happiness Yesterday’s depression Eudaimonia Chungnam 6.83 (1.29) 6.99 (1.17) 6.98 (1.18) 3.00 (2.01) 7.26 (1.07) Jeonbuk 6.41 (1.07) 6.94 (0.83) 6.86 (0.93) 3.80 (1.71) 6.57 (0.95) Jeonnam 6.67 (1.34) 6.99 (1.20) 6.92 (1.21) 3.65 (2.14) 6.84 (1.27) Gyeongbuk 6.54 (1.21) 6.60 (1.15) 6.65 (1.12) 3.01 (2.04) 6.59 (1.13) Gyeongnam 6.32 (1.46) 6.61 (1.32) 6.53 (1.38) 3.22 (2.02) 6.49 (1.37) Jeju 6.19 (1.64) 6.28 (1.59) 6.25 (1.66) 2.83 (2.21) 6.37 (1.63) Overall 6.76 (1.31) 6.95 (1.23) 6.94 (1.21) 3.35 (1.99) 6.91 (1.20)
Ⅳ. Mapping Koreans’ Happiness 39
Cantril Ladder were the highest (6.9) on Wednesdays, while there were no significant differences between the scores on the other days of the week. The same pattern emerged with respect to life satisfaction and eudaimonia scores as well. Yesterday’s happiness, on the other hand, tended to be the highest on Wednesdays, Saturdays, and Sundays.
〈Table 4-3〉 Day of the Week and Happiness
Day evaluationLife satisfactionLife Yesterday’s happiness Yesterday’s depression Eudaimonia
Monday 6.68 (1.41) 6.86 (1.37) 6.83 (1.26) 3.46 (1.93) 6.83 (1.23) Tuesday 6.71 (1.30) 6.94 (1.24) 6.89 (1.27) 3.54 (2.01) 6.91 (1.26) Wednesday 6.93 (1.27) 7.09 (1.24) 7.06 (1.28) 3.26 (2.00) 7.04 (1.28) Thursday 6.73 (1.39) 6.90 (1.24) 6.86 (1.20) 3.21 (2.11) 6.92 (1.17) Friday 6.75 (1.25) 6.89 (1.17) 6.84 (1.19) 3.36 (1.98) 6.93 (1.15) Saturday 6.75 (1.28) 6.98 (1.13) 7.03 (1.14) 3.21 (2.02) 6.87 (1.19) Sunday 6.75 (1.31) 6.97 (1.22) 6.97 (1.19) 3.41 (1.93) 6.92 (1.15) Overall 6.76 (1.31) 6.95 (1.23) 6.94 (1.21) 3.35 (1.99) 6.91 (1.20) Note: Figures in the brackets are standard deviations. The mean scores and standard
deviations are weighted. The mean scores are based on a Likert scale ranging from 0 to 10.
Source: KIHASA (2019) (data re-analyzed and formatted by the authors).
Figure 4-3 charts the fluctuations in Koreans’ life satisfaction by day of the week and employment status. The life satisfaction scores given by full-time paid workers, employers and self-em-ployed people, out of labor force, and unpaid workers in family businesses range between 6.5 and 7.5 from Monday to Thursday, but differences begin to emerge across different employment
40 How Happy Are Koreans? Measuring Happiness and Quality of Life in Korea
statuses from Friday through Sunday. Full-time paid workers experience greater life satisfaction on the weekends than dur-ing the week. Employers/self-employed and out of labor force, on the other hand, experience a slight drop (below 7.0) in their life satisfaction on the weekends. Unpaid workers in family businesses see their life satisfaction score drop further to 6.5 or so on the weekends.
Temporary/day paid workers and unemployed people lag significantly behind other groups in terms of life satisfaction. Unemployed people’s life satisfaction score, in particular, falls to 4.5 on Friday.
〔Figure 4-3〕 Day of the Week, Happiness, and Employment Status
(Unit: points)
Note: All scores are weighted means based on a Likert scale ranging from 0 to 10. Source: KIHASA (2019) (data re-analyzed and formatted by the authors).
Ⅳ. Mapping Koreans’ Happiness 41
4. Areas of Life and Happiness
Figure 4-4 shows how satisfied Koreans are with different areas of their life depending on their age, income, and region. Men in general are more satisfied with these areas of life than are women. The gender gap is particularly evident in relation to health, safety, quality of local community and environment, work, and future security. Middle-Aged 1 Koreans are slightly less satisfied than young Koreans; Middle-Aged 2 Koreans are slightly less satisfied than Middle-Aged 1 Koreans; and elderly Koreans are slightly less satisfied than Middle-Aged 2 Koreans. Korean seniors are particularly less satisfied with their financial situation and future security than other age groups. The higher the income quintile, the greater the satisfaction with areas of life in general. Koreans in the first quintile, in particular, are not very satisfied with their financial situation and future security. Koreans living in the Seoul-Gyeonggi-Incheon region are also more satisfied than Koreans living elsewhere, especially in re-lation to freedom from crime and safety. Satisfaction with fu-ture security, work, and financial situation was also higher in the Seoul-Gyeonggi-Incheon region than elsewhere.
42 How Happy Are Koreans? Measuring Happiness and Quality of Life in Korea
〔Figure 4-4〕 Sociodemographic Factors, Regions, and Satisfaction with Areas of Life
(Unit: points)
Note: All scores are weighted means based on a Likert scale ranging from 0 to 10. Source: KIHASA (2019)(data re-analyzed and formatted by the authors).
5. Personality and Happiness
We can also examine the relationship between happiness and Koreans’ personality, identified on the basis of the five main traits of personality (neuroticism, extraversion, openness, agree-ableness, and conscientiousness) and a cluster analysis. The “average” group here is relatively strong in extraversion, agree-ableness, and conscientiousness and weak in neuroticism and openness. The “self-centered” group is relatively strong in
extra-Ⅳ. Mapping Koreans’ Happiness 43
version and weak in neuroticism and openness. The “reserved” are those who are emotionally stable, but not particularly open. The “role model” group are those who are relatively strong in extra-version, openness, agreeableness, and conscientiousness and weak in neuroticism (Gerlach, Farb, Revelle, and Amaral, 2018).
Figure 4-5 shows how Koreans’ life satisfaction and depres-sion yesterday vary depending on their personality types. The role model group had the highest life satisfaction score (7.5), followed by the self-centered (7.1) and reserved (6.8). The aver-age group had the lowest life satisfaction score (6.3). The pat-tern is the reverse in relation to yesterday’s depression. The self-centered had the lowest score in this regard (2.6), followed by the ideal (3.2) and average (3.8). The reserved group had the highest depression score (4.1). Life satisfaction and yesterday’s depression are two opposite indicators of happiness, but the patterns of Koreans’ ratings are not symmetrically opposed.
〔Figure 4-5〕 Personality Types and Happiness
(Unit: points) Life satisfaction Yesterday’s depression
Note: All scores are weighted means based on a Likert scale ranging from 0 to 10. Source: KIHASA (2019)(data re-analyzed and formatted by the authors).
People with People
in Mind
KOREA INSTITUTE FOR HEALTH AND SOCIAL AFFAIRS
Ⅴ
Survey on Koreans’ Happiness and Quality of Life 2019 was designed to shed light, via a quantitative approach, on the comprehensive scope of happiness that Koreans experience. The survey questionnaire included questions and statements regarding diverse dimensions of happiness, including life eval-uation, life satisfaction, emotional experiences with happiness and depression, and eudaimonia. It also contained questions designed to identify respondents’ demographic and psycho-logical characteristics so as to reveal how Koreans’ experiences of happiness vary across groups. Moreover, the questionnaire included questions on the conditions of happiness, how sat-isfied Koreans are with their conditions of happiness, how they rate their own happiness and the happiness of others, what words they associate with happiness, and what their expect-ations are for their future happiness.
Koreans’ average ratings of life evaluation, satisfaction, eu-daimonia, and yesterday’s happiness fell short of 7.0 out of 10.0. Subjective assessments of happiness nonetheless varied by age, with Koreans in their 70s and older being particularly less happy than those in other age groups. Koreans living in Korea’s Midwest (Chungbuk, Sejong, and Daejeon) were generally
48 How Happy Are Koreans? Measuring Happiness and Quality of Life in Korea
more inclined to favorable life evaluation and life satisfaction than Koreans elsewhere. Koreans’ happiness also fluctuated depending on the day of the week, especially in relation to their employment status. Satisfaction with various areas of life also varied significantly depending on sex, age, income, and region. It is important for policy-makers to identify the relationships between these diverse dimensions of satisfaction, on the one hand, and overall happiness, on the other.
For example, much of Korean seniors’ lack of happiness is attributed to the financial insecurity and social isolation these seniors experience. Expanding the old-age income security system and policy programs for elderly care and social partic-ipation may help increase seniors’ happiness. There is also a significant regional variation in happiness, calling on policy- makers to explore what factors make certain regions happier than others. Koreans living in the Seoul-Gyeonggi-Incheon re-gion were generally more satisfied with various areas of their lives than were Koreans elsewhere, particularly in relation to physical safety and freedom from crime. Koreans in that region were also more satisfied with the prospects of their future se-curity, work, and financial situation than were Koreans living elsewhere.
Raising a happy family with a good spouse and living healthy are the two prominent conditions Koreans identify as essential to happiness. To what extent Koreans value these conditions,
Ⅴ. Conclusion 49
however, varies somewhat across income levels. However, money and honor are not the only, or even the foremost, conditions of happiness according to many Koreans. Meaningful relation-ships with others, health, working in a field one likes, and en-joying leisurely activities all emerged as important conditions of happiness on the 2019 survey.
This report analyzes the data for Survey on Koreans’ Happiness and Quality of Life 2019 to explore how Koreans experience happiness and quality of life. The main purpose of an endeavor like this is to provide a basic overview of the survey as the first step toward identifying the particularities of individual Koreans’ experiences of happiness as well as group-by-group commonalities. It is the hope of the authors that their analysis will aid in the identification of diverse applications that can help improve our understanding of Koreans’ happiness.
SOURCES IN KOREAN
Choi, I., Choi. J., Choi, E., Lee, S., Kim, N., Lee, S., ..., & Kwon, Y.. (2019). About H: Korea Happiness Report 2019. Book21.
Kim, M., Yeo, E., Kim, T., Jung, H. Woo, S., & Kim, S. (2014). A Study of Social Cohesion and Happiness in Korea with Policy Recommendations, Korea Institute for Health and Social Affairs Kim, M., Yeo, E., Jung, H., Park, Y., & Kim, S. (2017). Measuring and
Analyzing the Korean Happiness Index, Korea Institute for Health and Social Affairs
Yeo, E., Jung, H., Kim, M., Kim, M., Kang, J., Woo, S., & Kim, S. (2015). A Study of Social Cohesion and Social Mobility in Korea with Policy Recommendations, Korea Institute for Health and Social Affairs
SOURCES IN ENGLISH
Cantril, H. (1965). The Patterns of Human Concerns. NJ: Rutgers University Press.
Cohen, S., Kamarck, T., & Mermelstein, R. (1983). A Global Measure of Perceived Stress. Journal of Health and Social Behavior, 24(4), 385-396.
Economic and Social Research Institute. (2012). Initial investigation on the data from the Quality of Life Survey FY2011. Economic
KOREA INSTITUTE FOR HEALTH AND SOCIAL AFFAIRS
References
52 How Happy Are Koreans? Measuring Happiness and Quality of Life in Korea
and Social Research Institute.
Gallup. (2014). State of Global Well-Being: Results of The Gallup- Healthways Global Well-Being Index. New Mexico: Gallup. Gallup. (2018). Worldwide Research Methodology and Codebook, New
Mexico: Gallup.
Gerlach, M., Farb, B., Revelle, W. et al. (2018). A robust data-driven approach identifies four personality types across four large data sets. Nature Human Behaviour. 2, 735–742. https://doi.org/ 10.1038/s41562-018-0419-z
Helliwell, J., Layard, R., & Sachs, J. (2019). World Happiness Report 2019, New York: Sustainable Development Solutions Network. Inglehart, R., Haerpfer, C., Moreno, A., Welzel, C., Kizilova, K., Diez-
Medrano, J., ... , Puranen, B. (eds.). (2014). World Values Survey: All Rounds – Country- Pooled Datafile Version: http://www. worldvaluessurvey.org/WVSDocumenta tionWVL.jsp. Madrid: JD Systems Institute.[extracted on Feb.25.2019.]
Kahneman, D., Krueger, A. B., Schkade, D., Schwarz, N., & Stone, A. A. (2004). A survey method for characterizing daily life experience: The Day Reconstruction Method(DRM). Science, 306, 1776-1780. OECD. (2013). OECD Guidelines on Measuring Subjective Well-being.
Paris: OECD Publishing.
Richins, M. L., & Dawson, S. (1992). A Consumer Values Orientation for Materialism and Its Measurement: Scale Development and Validation. Journal of Consumer Research, 19(3), 303-316. doi: 10.1086/209304
References 53
Database
KIHASA (2016). Korean Welfare Panel Survey, Korea Institute for Health and Social Affairs
KIHASA (2019). Survey on Koreans’ Happiness and Quality of Life 2019, Korea Institute for Health and Social Affairs
KRIVET (2016). Korean Education and Employment Panel Survey, Korea Research Institute for Vocational Education & Training.