저작자표시-비영리-변경금지 2.0 대한민국 이용자는 아래의 조건을 따르는 경우에 한하여 자유롭게 l 이 저작물을 복제, 배포, 전송, 전시, 공연 및 방송할 수 있습니다. 다음과 같은 조건을 따라야 합니다: l 귀하는, 이 저작물의 재이용이나 배포의 경우, 이 저작물에 적용된 이용허락조건 을 명확하게 나타내어야 합니다. l 저작권자로부터 별도의 허가를 받으면 이러한 조건들은 적용되지 않습니다. 저작권법에 따른 이용자의 권리는 위의 내용에 의하여 영향을 받지 않습니다. 이것은 이용허락규약(Legal Code)을 이해하기 쉽게 요약한 것입니다. Disclaimer 저작자표시. 귀하는 원저작자를 표시하여야 합니다. 비영리. 귀하는 이 저작물을 영리 목적으로 이용할 수 없습니다. 변경금지. 귀하는 이 저작물을 개작, 변형 또는 가공할 수 없습니다.
The Effect of Iron Metabolism on
Palmitate-induced INS-1 Cell Death
by
Ik Rak Jung
Major in Molecular Medicine
Department of Biomedical Sciences
The Graduate School, Ajou University
The Effect of Iron Metabolism on
Palmitate-induced INS-1 Cell Death
by
Ik Rak Jung
A Dissertation Submitted to The Graduate School of
Ajou University in Partial Fulfillment of the Requirements for
The Degree of Ph.D. in Biomedical Sciences
Supervised by
Yup Kang, Ph.D.
Major in Molecular Medicine
Department of Biomedical Sciences
The Graduate School, Ajou University
ABSTRACT
-TheEf
f
ectofI
r
on Met
abol
i
sm on Pal
mi
t
at
e-i
nduced
I
NS-1Cel
lDeat
h
High levelofplasmafreefatty acid (FFA)wasthoughttocontributeto the loss ofpancreatic beta-cells in type 2 diabetes.In particular,saturated FFAssuch aspalmitateorstearatewereabletoinduceapoptosisincultured betacells(lipotoxicity).Endoplasmicreticulum (ER)stresswasreportedtobe a criticalmediator for the FFA-induced lipotoxicity.Recently,disorders in mitochondrialrespiratory metabolism were reported to be involved in the lipotoxicity.Sinceiron wasacriticalcomponentforrespiratory metabolism,I studied to determine whether abnormal iron metabolism is involved in palmitate(PA)-induced beta celldeath.Immunoblotting analysisshowed that treatmentofINS-1cellswith palmitatereduced leveloftransferrin receptor (TfR),butincreased levelofheavy chain ferritin (FTH).In accordancewith TfR down-regulation and FTH up-regulation,palmitate reduced intracellular labileiron pool.Whereasiron depletion through treatmentwith iron-chelators such asdeferoxamine(DFO)ordeferasirox (DS)augmented PA-induced cell death, iron supplementation through treatment with FeCl3, FeSO4, or
holo-transferrin significantly protected PA-induced death. Furthermore, overexpression of TfR1 reduced PA-induced death whereas knockdown of TfR1augmented thedeath.In particular,treatmentwith DFO increased level of ER stress markers such as phospho-PERK, phospho-eIF2α, CCAAT/enhancer binding protein homologous protein (CHOP) and phospho-c-Jun N-terminalkinase (p-JNK),and furthermore,treatmentwith
chemical chaperone significantly protected DFO-induced cell death. Iron supplementation also demonstrated protective effecton PA-induced primary isletcelldeath.Collectively data suggestthatiron depletion plays a rolein PA-inducedbetacelldeaththrough induction ofER stressandthatattempts toblockirondepletionmaybeamaneuvertopreventbetacelllossintype2 diabetes.
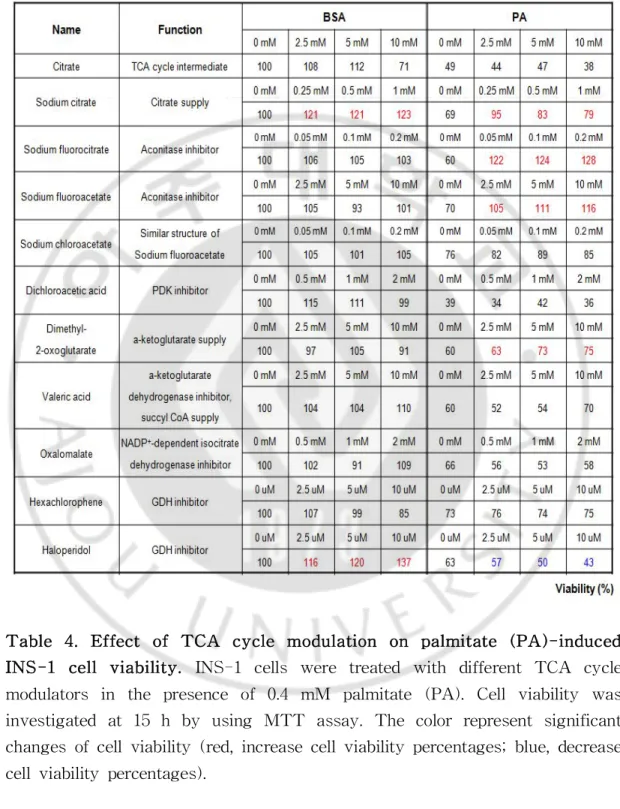
Chronic exposure to palmitate leads to mitochondrial dysfunction. Furthermore,reduced levels oftricarboxylic acid (TCA)cycle intermediates havebeen observedduring PA-inducedlipotoxicity.Ithasbeen demonstrated previously thatartificialinhibition ofTCA cycling,through treatmentwith inhibitorsofpyruvatecarboxylaseand carnitin palmitoyltrasferase1augment PA-induced INS-1 celldeath,whereas activation ofTCA cycling through treatment with glutamate dehydrogenase (GDH) activators reduced PA-induced celldeath.Therefore,the presentstudy aimed to identify new drugsabletocontrolPA-induced INS-1celldeath by regulating TCA cycle intermediates. Sodium fluorocitrate (SFC), a known aconitase inhibitor, completely protected against PA-induced reductions in INS-1 cellviability and increased INS-1 celldeath.Furthermore,SFC ameliorated reductions in insulin signaling and increased ER stress marker expression during PA treatment.However,SFC didnotprotectagainsttheINS-1celldeathinduced by a thapsigargin,streptozotocin,H2O2and cytokinemixture.To understand
how SFC completely protects against PA-induced INS-1 cell death, I investigated the effect of genetic knockdown of aconitase, by small interference RNA (siRNA), on PA-induced cell death. Aconitase siRNA efficiently reduced aconitase mRNA butPA-induced INS-1 celldeath was further increased by aconitase knockdown. Reduced activity of cytosolic aconitaseactsin asimilarway toan iron regulatory protein.Idemonstrated
previously thatan increasein thelabileiron poolreducesPA-inducedINS-1 celldeath;however,in the present study ferritin (a known iron storage protein) levels were decreased,and transferrin receptor 1 (a known iron uptakeprotein)levelsincreased,by SFC treatment,such thattheintracellular iron pool was diminished. On the other hand, PA uptake and oxygen consumption ratewereboth decreased by SFC treatment.Itisassumed that SFC may interrupt the translocation of CD36 into the cell membrane. Collectively,thesedatasuggestthatSFC preventsPA-inducedlipotoxicityby reducing PA uptake,ratherthan by regulating TCA cycle intermediates or ironmetabolism.
Keyword :Apoptosis,Endoplasmic reticulum (ER)stress,Lipotoxicity,Iron, INS-1cell,Palmitate,Transferrinreceptor,Soduim fluorocitrate
TABLE OF CONTENTS
ABSTRACT ···ⅰ TABLE OF CONTENTS ···ⅳ LIST OF FIGURES ···ⅵ LIST OF TABLES ···ⅺ ABBREVIATIONS ···ⅻ
Ⅰ.INTRODUCTION···1
Ⅱ.MATERIALS AND METHODS···24
A.MATERIALS···24
1.Reagents···24
B.METHODS···25
1.CellCulture···25
2.Preparationofpalmitate···25
3.Isolationofislets···25
4.MTT-basesviabilityassay···26
5.Measurementofcelldeath···26
6.Westernblotanalysis···27
7.RNA extractionandmicroarrayanalysis···27
8.Reversetranscriptase-polymerasechainreactionand q
ua
nt
i
t
at
i
vePCR
···289.DNA andRNA Transfection ···28
10.Measurementofintracellularlabileironpool(LIP)···29
11.Aconitaseactivityassay···29
12.Oxygenconsumptionrate(OCR)···30
13.PA uptake···31
15.Immunocytochemistry···32
16.Statistics···32
Ⅲ.RESULTS [PartI] ···36
A.PalmitatetreatmentreducesintracellularironlevelinINS-1 betacell.···36
B.Irondepletionandsupplementationinpalmitate-inducedINS-1 celldeath.···.41
C.Toxicmediatorofirondeficiency.···50
D.Beta-cellfunctionbyironregulation.···60
E.Effectofironregulationonlipotoxicityinothercells.···61
Ⅲ.RESULTS [PartII]···64
A.ControlofPA-inducedINS-1celldeaththroughtheTCA cycleintermediate.···64
B.RoleofSFA andSFC invariousofcelldeathmodels.···71
C.TheeffectofaconitaseinhibitiononPA-inducedlipotoxicity···76
D.SFC alterediron-regulatingproteins.···84
E.ChangesinintracellularsignalingassociatedwithSFC treatment.···88
F.ChangesinoxygenconsumptionrateassociatedwithSFC treatment.···98
G.SFC modulatesCD36translocationandreducesPA uptake.···100
H.SFA andSFC protectagainstPA-inducedisletcelldeath.···103
Ⅳ.DISCUSSION [PartI]···104
Ⅳ.DISCUSSION [PartII] ···110
Ⅴ.CONCLUSION ···117
REFERENCES ···118
LI
ST OF FI
GURES
Fig.1.Pathogenesisoftype2diabetesmellitus.···2
Fig.2.Naturalhistoryoftype2diabetesandbetacellmass.···4
Fig.3.Lipid-inducedinsulinresistance.···6
Fig.4.Endoplasmicreticulum stresssignaling.···8
Fig.5.Cellularmechanism underlyingbeta-celllipotoxicity.···9
Fig.6.Metabolicinflexibility.···14
Fig.7.Inhibitionofglucoseoxidationbyfattyacidutilization.···14
Fig.8.Ironmetabolism.···16
Fig.9.Regulationoftransferrinreceptorandferritinbyiron regulatoryprotein.···17
Fig.10.Synthesisoffluorocitrate.···21
Fig.11.Synthesisof4-hydroxy-trans-aconitatebyaconitase.···21
Fig.13.IntracelluarironlevelsdecreasebyPA.···40
Fig.14.DecreaseofLIP augmentPA-inducedINS-1celldeath.···42
Fig.15.IncreaseofLIP protectagainstPA-inducedINS-1celldeath.·44
Fig.16.ModulationofTfR1altersPA-inducedINS-1celldeath.···46
Fig.17.ModulationofTfR1altersintracellularironpool. ···47
Fig.18.KnockdownofFPN1orFTH dosenotaffectPA-induced
INS-1celldeath.···49
Fig.19.Involvementofendoplasmicreticulum (ER)stressin
deferoxamine(DFO)-inducedINS-1celldeath.···52
Fig.20.ProtectiveeffectofchemicalchaperoneonDFO-induced
INS-1celldeath.···53
Fig.21.ModulationofPA-inducedER stressbyirondepletionor
ironsupplementation.···54
Fig.22.KnockdownofCHOP protectspotentiationeffectofDFO
onPA-inducedINS-1celldeath.···55
Fig.23.Reductionofoxygenconsumptionrate(OCR)byPA or
Fig.24.MetabolicregulatingdrugsdoesnotprotectDFO-induced
INS-1celldeath.···58
Fig.25.DFO augmentsPA-inducedreductionofHIF-1α.···59
Fig.26.DFO decreasesglucose-stimulatedinsulinsecretion(GSIS)
whereasholo-transferrinincreaseGSIS.···60
Fig.27.Potentiationeffectofirondepletionandprotectiveeffectof
ironsupplementationonPA inducedisletcelldeath.···62
Fig.28.DFO augmentsPA-inducedcytotoxicityinHepG2hepatocytes, butreducesthetoxicityinC2C12myoblastsand3T3L1
fibroblasts.···63
Fig.29.Highconcentrationofsodium fluoroacetate(SFA)and
sodium fluorocitrate(SFC)reduceINS-1cellviability.···67
Fig.30.ProtectiveeffectsofSFA andSFC againstPA-induced
reductionsinINS-1cellviability.···69
Fig.31.SFA andSFC completelyreducePA-inducedcelldeath.···70
Fig.32.EffectsofSFA indifferentcelldeathmodels.···72
Fig.33.SFA doesnotprotectagainstthapsigargin(Tg)-,
celldeath.···74
Fig.34.SFC doesnotprotectagainstTg-,STZ-,H2O2-orcytokine
mixture-inducedcelldeath.···75
Fig.35.SFC inhibitsaconitaseactivity.···79
Fig.36.KnockdownofaconitaseaugmentsPA-inducedINS-1cell
death.···80
Fig.37.CitratedisruptstheprotectiveeffectofSFC against
PA-inducedlipotoxicity.···81
Fig.38.Knockdownofcitratesynthaseaugmentscaspase3cleavageby PA.···83
Fig.39.SFC regulatesironmetabolism-relatedproteins.···87
Fig.40.SFC reducesPA-inducedcaspase3cleavage.···90
Fig.41.ProtectiveeffectofSFC againstPA-inducedcellularsignals.··92
Fig.42.SFA reducesPA-inducedcaspase3cleavage.···94
Fig.43.SFA restoresPA-inducedactivationofcellularsignals.···95
Fig.45.SFC reducesthePA-induced,butincreasesglucose-induced, oxygenconsumptionrate.···99
Fig.46.SFC inhibitsPA uptake.···101
Fig.47.SFC modulatesCD36translocation.···102
Fig.48.ProtectiveeffectsofSFA andSFC againstPA-induced
LI
ST OF TABLES
Table1.GenbanknumberandnucleotidesequenceofsiRNAs ···33
Table2.NucleotidesequencesofsetsforqPCR ···34
Table3.NucleotidesequencesofsetsandreactionconditionforPCR··35
Table4.EffectofTCA cyclemodulationonpalmitate(PA)-induced
Aco Aconitase
ACC Acetyl-CoA carboxylase ACL ATP citratelyase
ACSL1 Longchainfattyacyl-CoA synthetase1 ACSL5 Longchainfattyacyl-CoA synthetase5 ATF4 Activatingtranscriptionfactor4
ATF6 ActivatingTranscriptionFactor-6 CHOP C/EBP HomologousProtein CPT1 Carnitinepalmitoyltransferase1 Cs Citratesynthase
DFO Deferoxamine
DMT1 Divalentmetaltransporter-1 DS Deferasirox
ER EndoplasmicReticulum ETC Eletrontransprtchain FASN Fattyacidsynthase FFA FreeFattyAcid FPN1 Ferroportin1
FTH FerritinHeavyChain
GPAM Glycerol-3-phosphateacyltransferase1,mitochondrial GSIS Glucose-stimulatedinsulinsecretion
HIF-1α Hypoxia-induciblefactor1alpha h-Tf holo-Transferrin
IRE Iron-responsiveelement IRE1 Inositol-RequiringEnzyme-1 IRP IronRegulatoryProtein JNK C-JunN-terminalKinase LIP LabileIronPool
OCR OxygenConsumptionRate OXPHOS Oxidativephosphorylation
PA Palmitate
4-PBA 4-Phenylbutyrate PC Pyruvatecarboxylase PDH Pyruvatedehydrogenase
PDK Pyruvatedehydrogenasekinase
PERK ProteinKinaseRNA (PKR)-likeER kinase PFK-1 Phosphofructokinase1
PGC1α Peroxisome proliferator-activated receptor gamma, coactivator1alpha
PKC ProteinkinaseC
ROS ReactiveOxygenSpecies RQ Respiratoryquotient SD SpragueDawley SFA Sodium fluoroacetate SFC Sodium fluorocitrate
SREBP1c SterolRegulatoryElement-BindingProtein1c STZ Streptozotocin
TAA Transaconitate TCA TricarboxylicAcid TfR TransferrinReceptor Tg Thapsigargin
UPR UnfoldedProteinResponse UTR Untranslatedregion
I
.I
NTRODUCTI
ON
A.Di
abet
esandbet
a-cel
lf
ai
l
ur
e
1.Def
i
ni
t
i
on ofdi
abet
es
Diabetes,whichischaracterizedbychronichyperglycemia,representsa progressive metabolic disease accompanied by microvascular complications such asretinopathy,nephropathy and neuropathy and macrovasculardisease, atherosclerosis.Afterameal,gluconeogenesismustbesuppressedintheliver, and glucose uptake increased in peripheraltissues including muscle,adipose tissue,to maintain normalblood glucoselevels.Glucosecontrolin theblood is mainly regulated by insulin and glucagon.In the fed state,when blood glucose concentrations are high,further increases in glucose concentration stimulatepancreaticbeta-cellsto secreteinsulin.Glucoseuptakeisincreased in peripheral tissues (e.g. muscle and adipose) by the secreted insulin. Furthermore,gluconeogenesis is inhibited,there by glucose is stored as glycogenintheliver.Conversely,inthefastedstateglycogenbreakdownand gluconeogenesis are promoted by glucagon secretion from alpha cells in the pancreas,and glucose concentration is regulated normally.However,in the diabetes state,chronically high blood glucose concentrations can be result from astateofimpairmentofdecreasingbloodglucoselevelsafterameal,or excessively increased levelsofgluconeogenesisduring fasting.Thiscondition istermed diabetes.Insulin also inhibitlipolysisin adipocytesbutthisability isdecreasedindiabetesstatethatbloodfattyacidconcentrationsarehigh.In summary,diabetes is caused by decreased insulin secretion from pancreatic beta-cells and abnormal insulin activity in peripheral tissues, ultimately leading to hyperglycemia dueto increased glucoseproduction from theliver,
decreased glucoseuptakein muscleand adiposetissue,and dyslipidemia due to disturbances in the inhibition oflipolysis in adipose tissues (Chang-Chen etal,2008)(Fig1).
2.Bet
a-cel
ldysf
unct
i
on andf
ai
l
ur
edur
i
ng t
ype2di
abet
es.
During the pastseveraldecades,pancreatic beta-celldysfunction has beenthoughttoplay an importantroleinthedevelopmentoftype2diabetes (DeFronzo,2009).Itisnow acceptedthat,wheninsulinresistancedevelopsin accordance with environmentalfactors such as obesity,individuals who are genetically susceptibletodiabetesfailtocompensatefortheincreasedinsulin demand such thatbeta-cellfailure finally occurs (Prentkiand Nolan,2006). Pancreaticbeta-cellsareadaptedtowardinsulinresistanceinaccordancewith increasing cellmass and activity during the early stage ofdiabetes.During early stage of insulin resistance, beta-cells secrete sufficient insulin to maintainnormalbloodglucoselevels.However,longterm insulinresistanceis characterized by insufficientinsulin secretion thatleads to impaired glucose tolerance.Ifthisstatepersists,impairments in thecontrolofglucoselevels, due to beta-cell dysfunction and death, become increasingly severe and eventually lead to diabetes.A quantitative reduction in beta-cellmass was revealedby insulin staining in isolated isletsoftype2diabetespatients,due mostly to increased apoptosis (Fig 2).Therefore,it is also important to elucidate the mechanisms underlying beta-celldysfunction and apoptosis,as wellasinsulinresistance.Fig.2.Naturalhistory oftype2diabetesand beta-cellmass.(Sakuraba H etal,2002)
B.Cel
l
ul
armechani
smsunder
l
yi
ng bet
a-cel
ll
i
pot
oxi
ci
t
y
Ithas been reported previously thathigh levels ofglucose or fatty acidsmay both bedetrimentaltobeta-cellfunction,butin combination these compoundsareeven moreharmful.Toxicity dueto freefatty acids (FFAs), which isknown aslipotoxicity and occursin obesetype2diabetespatients, probablymediatesbeta-cellfailure(Leonardietal,2003).Chronicexposureto high concentrations of fatty acids is related to the inhibition of glucose-stimulated insulin secretion and decreased ofinsulin geneexpression. Furthermore,it has been demonstrated clearly thatlong-term exposure to fatty acids can induce beta-cellapoptosisin cultured cells orisolated islets; palmitic and stearic fatty acids are particularly cytotoxic to beta-cells (Maedler et al, 2001; Maedler et al, 2003). However, the mechanism underlying fatty acid-induced beta-cell toxicity has not yet been clearly defined. Typically, FFAs are non-toxic to beta-cells when they are completely oxidized or synthesized to triglyceride.Incomplete oxidation of fatty acids,oraccumulation oflong-chain acyl-coenzyme A (LC-CoA)and lipid intermediatemolecules (such as lysophosphatidic acid,phosphatidicacid and diacylglycerol; DAG), may play an important role in FFA-induced toxicity (Prentki et al,2002).Ceramide and DAG can activate c-Jun N terminalkinase(JNK)andproteinkinaseC signaling;thesesignalsreportedly induce lipotoxicity by inhibiting insulin signaling (Shimabukuro etal,1998; Eiteletal,2003)(Fig.3).Fig.3.Lipid-induced insulin resistance.(KiensB,2006;EugeneDT and DanielGD,2012)
Endoplasmic reticulum (ER) stress is a critical mediator of FFA-induced beta-celldeath (Cunhaetal,2008;Diakogiannakietal,2008b). Beta-cells are associated with a high degree ofprotein synthesis because they produce and secrete insulin.In particular,continual,excessive nutrient intakecan increaseprotein synthesis;undersuch conditions,unfolded protein responses(UPRs)areinitially adaptiveand resolveexcessivefolding load on the ER. However, if UPRs are insufficient to resolve the folding load, adaptiveUPRscaninsteadbecomedamageresponses,whichultimatelyinduce celldeath by activating death signals.UPRs and ER stress are induced by three ER stress sensors; RNA-dependent protein kinase-like ER kinase (PERK),inositol requirement 1 (IRE1) and activating transcription factor (ATF)-6a (Hetz,2012).PERK phosphorylates eIF2α,which inhibits general translation butincreases the translation ofactivating transcription factor 4 (ATF4) and CCAAT/enhancer binding protein homologous protein (CHOP), both ofwhich induce celldeath.Because IRE1α exhibits both endonuclease andkinaseactivity,itcanspliceXBP1andphosphorylateJNK.SplicedXBP1 (XBP1s) can facilitate protein folding by increasing chaperones and phosphorylated JNK,which is involved in celldeath.ATF6 plays a role in increasing chaperone proteins and inducing the signalfor misfolded protein degradation(Preston etal.,2009).In summary,when anexcessiveamountof unfolded or misfolded proteins accumulate in the ER,UPR/ER genes are activated to attenuate protein synthesis and enhance protein folding by inhibiting translation and inducing chaperones,respectively.Enhancementof thedegradation ofmisfolded proteinscan also decreaseER stress.However, when this capability is exceeded,the cells eventually dieduring ER stress -induced apoptosis (Fig.4).As mentioned above,CHOP induction and JNK activationaretypicaldeathsignalsduringER stress-inducedcelldeath(Hetz,
2012).Furthermore,JNK-dependentserinephosphorylation ofinsulin receptor substrate-1 (IRS-1),an inhibitory form ofIRS-1,links ER stress with the inductionofobesity-inducedinsulinresistance(Hotamisligil,2008).Ithasbeen suggested thatinsufficientactivation ofthe insulin signaling pathway also contributes to beta-celldamage (Heninge,2003).Although itremains to be determined how FFA induces the ER stress responses,FFA surplus may facilitate UPRs through ER Ca2+ depletion (Cunha etal,2008;Hara etal, 2014;Mandlet al,2009).Impaired ER-Golgitrafficking may also explain palmitate(PA)-inducedER stress.
Collectively,lipotoxicity-induced beta-celldeath is mainly caused by apoptotic cell death. Although it is not yet fully understood how high concentrationsoffatty acidsinducemitochondrialdamage,itisbelieved that the activation of various stress signals plays a major role in mitochondria-mediated cell death. The release of cytochrome C from mitochondriaactivatescaspase9/caspase3,which isknown tobeaprimary mechanism underlying mitochondria-mediated cell death.In particular,our group hasdemonstrated thatoxidativeand ER stress,which resultsin JNK activation,plays a key role in lipotoxicity.Furthermore,activation of the NF-kB signaling pathway in turn activates inflammatory signals,which are reportedly involved in beta celldeath;because insulin signaling is reduced during lipotoxicity, decreased activity in the AKT signaling pathway is believedtoplaythemajorroleinfattyacid-inducedtoxicity(Fig.5).
C.Mi
t
ochondr
i
aldysf
unct
i
on dur
i
ng l
i
pot
oxi
ci
t
y
1.Mi
t
ochondr
i
aldysf
unct
i
on
Numerousstudieshavereported toxicsignalsarising from fatty acids; ourpreviousstudy showed thatfatty acid-induced toxicsignalsarerestored commensurate with increased lipid metabolism, including synthesis and oxidation (Choiet al,2011a).Glatz et aldemonstrated that inhibition or deletionoffatty acidtranslocase(FAT)/CD36,whichisinvolvedinfattyacid influx into cells,reduces lipotoxicity (Glatz etal,2013).According to these data, it appears that decreased ability to control metabolic systems, or metabolicimbalanceduetoexcessiveuptakeoffatty acidsintothecell,may in factcontribute to the generation oftoxic signals.Mitochondria play an important role in energy homeostasis due to their involvement in beta-oxidation and fat storage. Reduced mitochondrial energy production representsamajorabnormality characterizing obesity.Inparticular,obeseand type 2 diabetic individuals exhibita lowerbeta-oxidation rate,and reduced oxidative enzyme activity and electron transport chain (ETC) activity comparedwithnon-obeseandnon-diabeticindividuals(Simoneauetal,1999). Microarray analysis also indicates that gene expression related to mitochondrialoxidativemetabolism isreducedininsulinresistantanddiabetic individuals (Mootha et al,2003;Pattiet al,2003).However,the opposite results have also been reported. Mitochondrial oxidative phosphorylation (OXPHOS) activity was normal,or even increased,in HFD-fed mice and humans(Bousheletal,2007;Hancocketal,2008).Furthermore,mitochondrial flavoprotein apoptosis-inducing factor knockout mice exhibit impaired mitochondrialOXPHOS activity butalso demonstrate increased resistance to obesity and diabetes induced by HFD (Pospisilik etal,2007);this suggests thattherelationship between mitochondrialfunction and insulin sensitivity is
complex.
2.TCA cycl
e
Aconitase is well-known for its role in catalyzing the reversible isomerization of citrate, cis-aconitate, and isocitrate. Eukaryotes possess mitochondrialand cytosolic forms of aconitase (Philpott et al,1994).The function ofmitochondrialaconitase (Aco2)is to convertcitrate to isocitrate during theTCA cycle.Cytosolicaconitase(Aco1)isbifunctional;intracellular ironlevelsregulatetheswitchbetweenfunctions,such thatitservesasboth an enzymeandasan iron regulatory protein (IRP).When cellulariron levels are high,Aco1 retains its [4Fe-4S]cluster,and has an aconitaseenzymatic function.However,whenironlevelsarelow,theFe-S clusterisdisassembled and Aco1 loses its enzymatic function and functions instead as an IRP (Philpottetal,1994).Citrate is an importantintermediate ofseveralmajor energyandintermediarymetabolism pathwayssuchasglucoseandfattyacid. Within the mitochondria,citrateacting asan intermediatein the TCA cycle isconverted toisocitrateand furthergeneratesNADH and FADH2with two
molecules ofCO2.Oxidation ofNADH and FADH2 via the ETC produces
ATP.TCA cycle flux is partially controlled by isocitrate dehydrogenase, following allosteric inhibition by ATP and production inhibition by NADH. Therefore,when ATP synthesisrequirementsarelow,citrateaccumulatesin the mitochondria and can be transported to cytosolvia the tricarboxylate carrier.In the cytosol,citrate is converted to acetyl-CoA by ATP-citrate lyaseforcholesterolandfattyacidsynthesis.Citratecanalsobeconvertedto α-ketoglutarate by Aco1 and NADH-dependent isocitrate dehydrogenase. Furthermore,citrate plays a role in the controlof glycolysis,fatty acid synthesis and oxidation. Because citrate is a negative regulator of the glycolytic enzyme phosphofructokinase (PFK),and efflux from mitochondria
occurs when ATP and NADH levels are high,glycolysis is suppressed. Citrate is also an allosteric activator of acetyl-CoA carboxylase which produces a malonyl-CoA.Malonyl-CoA is a potent allosteric inhibitor of CPT1,which controlsthetransferofLC-CoA intomitochondria.An increase in malonyl-CoA inhibits the beta-oxidation of fatty acids and diverts acetyl-CoA into lipogenesis.Conversely,a decrease in malonyl-CoA directs acyl-CoA to enterinto the mitochondria such thatfatty acid beta-oxidation occurs.Therefore,Abnormalregulation ofglucoseand fatty acid metabolism canaffectthepathophygiologyofinsulinresistanceanddiabetes(Belfioreand Iannello,1998; WolfgangandLane,2006).
3.Met
abol
i
ci
nf
l
exi
bi
l
i
t
y
Metabolic flexibility refers to the capacity to switch back and forth between glucose and fatenergy sources based on availability and need.It was proposed recently that incomplete beta-oxidation and accumulation of lipid signaling molecules in tissues inhibits insulin signaling, but other research has focused on the importance of mitochondrialfuelselection,in accordancewithreportsthatdiabeticindividualsfailtoswitchfrom fattyacid to glucose oxidation during the transition from fasting to feeding states. (KelleyandMandarino,2000).Mitochondriaconsumeoxygentoburnnutrients such asfatty acids,glucoseandaminoacids.Thesefuelscan becatabolized toacetyl-CoA,which thenenterstheTCA cycle.CO2isreleasedandNADH
and FADH2 are generated during severalstages ofthe TCA cycle.These
reducing equivalents are used to produce ATP in the ETC and during OXPHOS. Oxygen, as the final electron acceptor, is required in the ETC/OXPHOS system to produce H2O.Cellular rates of CO2 production
between 0.7 and 1.0 undernormalconditions,and providemitochondrialfuel. A highRQ indicatesarelatively highdegreeofglucoseoxidation,whereasa low RQ predominately reflectsfatoxidation (Fig.6).However,fluctuationsin RQ are blunted under insulin resistance conditions. Excess supply and increasedoxidationoffatty acidscanleadtotheaccumulationofacetyl-CoA, which allosterically activates pyruvate dehydrogenase kinase (PDK), and results in the inhibition ofPDH (Sugden and Holness,2006).In a mouse model, genetic inhibition of PDH in muscle and heart led to muscle hypertrophy and heart dysfunction after feeding with a HFD.In contrast, geneticupregulationofPDK orupregulationundercertainconditionsincluding HFD,fasting,oralackofinsulin,maintainsglucoseoxidationatalow level. This circumstance mimics a state of metabolic inflexibility and is characteristic ofinsulin resistance (Kelley and Mandarino,2000).Conversely, thefasting blood glucoselevelofPDK4-deficientmiceissignificantly lower compared with wild-type mice (Jeoung and Harris 2008),probably due to active PDH dividing pyruvate, a substrate of gluconeogenesis, into acetyl-CoA.TheseobservationsemphasizetheimportanceofPDH in glucose and lipid homeostasis.Furthermore,an increase in cellular citrate inhibits PFK-1,leading to reduced glycolysis,pyruvateoxidation and glucoseuptake (Fig.7).Although this metabolic inflexibility is recognized as a hallmark of heartmetabolicdisordersandisapotentialcauseofcellulardysfunction,itis stillnotfullyunderstoodatthemolecularlevel.
Fig.6.Metabolicinflexibility.(MuoioDM,2014)
Fig.7.Inhibition ofglucose oxidation by fatty acid utilization.(An D andRodriguesB,2006)
D.Rel
at
i
onshi
pbet
ween i
r
on anddi
abet
es
1.Regul
at
i
on ofi
r
on
Iron homeostasisiscriticalforthemaintenanceofnormalcellfunction because iron plays a vitalrole in mitochondrialrespiratory metabolism.In fact,iron is an electron transfer componentinvolved in oxidation/reduction reactionswithin cytochrome,severalmitochondrialelectron transportcomplex and TCA cycle enzymes (Leviand Rovida,2009;Ye and Rouault,2010).It has been reported thatiron deficiency causes celldeath,as wellas growth arrest,whereasexcessiron generatesfreeradicalsthatalso structurally and functionally damagecellularbiomoleculessuch asDNA,membranelipidsand proteins,ultimatelyresulting incelldeath(Andersonetal,2012;Muckenthaler et al,2008).Therefore,appropriate levelof cellular iron must be tightly regulated.Theprocessofbeginning theuptakeofiron intothecellfrom the outside is mediated by the binding of diferric transferrin protein to the dimerictransferrin receptor(TfR).Afterbinding,they aretaken up into the cellby receptor-mediated endocytosis,and iron istransported to the cytosol with theaid ofdivalentmetaltransporter-1(DMT1)(Fig.8).In mammalian cells,iron balancein thecellisregulated according tothebinding frequency between iron regulatory protein-1 (IRP1)and [4Fe-4S],and iron dependent degradation ofIRP2.In healthy animaltissues,themajority of IRP1contain [4Fe-4S]clusters and actas cytosolic aconitase.Therefore,IRP2 serves to controlthequantitiesofTfR,iron storageprotein,ferritin,and iron exporter ferroportin,by binding toiron-responsiveelements(IREs)withintheirmRNA (Hentzeetal,2004).In termsofthemechanism underlying IRP intracellular iron control,ithas been reported thatinactive IRP may oppositely regulate TfR andferritinheavy chain(FTH)expressionbyreducing theIRP-mediated stability of TfR mRNA and translational inhibition of FTH,respectively
(Rouault, 2006). Excessive iron separates IRP from IREs on the 3' untranslated region (UTR)oftransferrin mRNA and the 5'UTR offerritin mRNA.Therefore,the stability ofTfR mRNA is decreased,and additional iron uptake reduced,whereas the translation of ferritin is increased and sequestersironinsidethecell.Conversely,in casesofinsufficientiron within the cell,IRPs bind to the IREs ofthe 3'UTR in TfR mRNA,and the 5' UTR in ferritin mRNA,resulting in highly stable TfR mRNA and ferritin translation inhibition,which ultmately increases iron contentwithin the cell (Tong andRouault,2007;Simcox andMcClain,2013;Gabrielsen etal, 2012) (Fig.9).
Fig.9.Regulation oftransferrin receptorand ferritin by iron regulatory protein.(CazzolaM andSkodaRC,2000)
2.Rol
eofi
r
on i
n met
abol
i
sm
Glucosemetabolism,theTCA cycle,and OXPHOS representpathways thatplay acentralroleincellularenergymetabolism.Glucoseisconvertedto pyruvate via glycolysis, and pyruvate is subsequently decarboxylated to acetyl-CoA (catalysed by the enzyme PDH),which then enters the TCA cycle.TheTCA cycleprovidesNADH foroxidativephosphorylation.Notably, severalstudies,assumethat,becauseironperturbationcontrolstheexpression ofAco2according toatranslationalmechanism (Grayetal, 1996;Kim etal, 1996),the TCA cycle and iron homeostasis may be connected through the interactionofIRP withIREs,withinthe5'UTR ofAco2mRNA (Grayetal, 1996;Kim etal,1996; Schalinskeetal,1998).Activation ofIRP binding to thisIRE,underirondeprivationconditions,resultsintranslationalinhibitionof Aco2 expression through disruption ofthe binding ofribosomalsubunits to mRNA (Gray and Hentze,1994).In contrast,when iron issupplemented,the binding affinity between IREs and IRP is reduced.In this situation,IRP-1 serves as a cytosolic aconitase (Beinertand Kennedy,1993;Kaptain etal, 1991; Paraskeva and Hentze, 1996; Rouault et al, 1991), and IRP-2 is degraded (Henderson and Kühn,1995;Guo etal,1995;Iwaietal,1995), which in turn should increase aconitase mRNA expression.Furthermore,it hasbeen postulatedthatanotherTCA cycleenzyme,succinatedehydrogenase mRNA,is also regulated by iron (Gray et al,1996;Kohler et al,1995; Melefors,1996).Although isocitrate dehydrogenase (IDH)expression is not regulatedby theIRE/IRP system,itsactivity isalteredby iron perturbations. (Oexle etal,1999).Furthermore,because iron plays an importantrole as a cofactorfortheoxidation ofmetabolitesandelectron transfer,itmay alsobe atargetforimprovingdecreasedmitochondrialactivity.
3.I
r
on and met
abol
i
csyndr
ome
Ironhomeostasisiscriticalformaintainingnormalcellfunctionbecause iron playsan importantrolein mitochondrialrespiratory metabolism.In fact, iron acts as an electron transfer component during oxidation/reduction reactions thatoccur in cytochrome,severalmitochondrialelectron transport complex (iron-sulfurcluster)and theTCA cycle(Leviand Rovida,2009;Ye and Rouault,2010).Itwasthoughtpreviously thatiron overload may cause insulin resistance. Peripheral insulin resistance is increased, and insulin secretion decreased,when body iron levels rise.Conversely,the removalof ironrestoresinsulinsensitivity andsecretion(Abraham etal,2006).Although excessiveiron,asindicatedbyhyperferritinemiaandliverirondeposition,isa typicalfeatureofmetabolicsyndrome,severeobesity isusually accompanied by a lack ofiron.Theassociation between obesity and low iron levels has been evaluated previously (Ku etal,2009).Ithas been reported thatiron deficiencycausescelldeathandgrowtharrest,whereasexcessirongenerates free radicals that also structurally and functionally damage cellular biomolecules such as DNA,membrane lipids and proteins and,ultimately, inducescelldeath(Andersonetal,2012;Muckenthaleretal,2008).Therefore, cellularironlevelsmustbetightlycontrolled.
D.Sodi
um f
l
uor
oacet
at
e
1.Toxi
cmechani
sm ofSFA
Sodium fluoroacetate(SFA),which hasbeen used in severalcountries to controlthe proliferation ofrodents and vertebrate species,is the most well-known aconitase-inhibiting mechanism (Petersand Wakelin,1953).SFA undergoesseveralmetabolicprocesseswithin organisms.ItinhibitstheTCA cycle by binding with coenzyme A to form fluoroacetyl-CoA,which can replace acetyl-CoA in the TCA cycle and reacts with citrate synthase to producefluorocitrate(Fig.10).A metaboliteoffluorocitratethenbindstightly to aconitase and no longer metabolizes, thereby halting the TCA cycle (Proudfootetal,2006).Initially,itwasthoughtthatSFC wasa competitive inhibitorofaconitase.However,in theearly 1990s,itwas assumed,instead, thatSFC had a high affinity foraconitase,atany concentration ofcitrate (Clarke,1991).By themid-1990s,in vivo and in vitro pharmacologicstudies and X-ray crystallography established aconitase as the main target of fluorocitrate (Goncharov etal,2006).The inhibition ofaconitase occurs in accordancewith theconversion offluorocitrateto 4-hydroxyl-trans-aconitate (Fig.11),which binds tightly to the active site ofaconitase.Furthermore, high concentrationsoffluorocitratemay block citratetransport(Laubleetal, 1996).Aconitase inhibition leads to citrate accumulation,which disturbs the electrolyteand acid-basebalanceandreducesblood pH.(Szerb andRedondo, 1993), leading to violent convulsions and death due to heart failure or respiratory arrest (Gribble,1973).However,Tsujietaldemonstrated that, despite increased serum-lactate,citrate and pyruvate levels following SFA administration, pH was maintained and survival rates did not change. Therefore,survivalrates may be affected by the accumulation of lactate, citrate,andpyruvate(Tsujietal.2009).
Fig.10.Synthesisoffluorocitrate.(LaubleH etal,1996)
Fig.11.Synthesisof4-hydroxy-trans-aconitateby aconitase.(LaubleH etal,1996)
2.Ef
f
ectofSFA on gl
ucosemet
abol
i
sm
Glucose is thought to be among the crucialsubstrates affected by SFA.According to previous studies,SFA causes hyperglycemia,as wellas hypoglycemia, because arrest of the TCA cycle inhibits glycolysis and gluconeogenesis(Zhou etal,1984).SFA induceshyperglycemia by inhibiting PFK,which blocks glycolysis.However,SFA also induces hypoglycemia by glycogen depletion (Boquist et al, 1988) and negatively modulating gluconeogenesis,which is associated with a numberofoutcomes,including reducedTCA cycleactivity,inactivationoflactatedehydrogenase,blockageof themalateshuttle,accumulation ofNADH in thecytosoland areduction of mitochondrialoxaloacetate(DicksonandLangslow,1977;BaunisterandO’Neil, 1981).Therefore,theeffectsofSFA areconsideredsimilartothoseofinsulin (Zieve etal,1983).Serious hyperketonemia was also observed,along with hyperglycemia, following treatment with SFA, which is characteristic of diabetes(Williamson,1967;Taitelmanetal,1983).Thisconditionisassociated withdecreasedofoxalicacidasaresultofTCA blockage(Engeletal,1954; Buffaetal,1973).Furthermore,SFA inhibitshormone-stimulated lipolysisin adipose tissue and reduces cyclic AMP levels due to inhibition ofadenylate cyclase (Tayloretal,1977),which represents evidence thatSFA treatment causes effects similar to diabetes. Moreover, SFA accelerates glucose conversion tofatty acids(Tayloretal,1977);such antilipolyticand lipogenic effectssuggestthatSFA and insulin actaccording toacommon mechanism (Reichelt,1979).Although SFA isthoughttodisturb glucosemetabolism,the mechanism underlying this effect remains unclear. The accumulation of citrate,lactate,and pyruvate is considered the main cause ofdeath during SFA treatment,but no studies have evaluated glucose metabolism during SFA treatment.
E.Obj
ect
i
ve
Chronic exposure to high levels offatty acids can induce beta-cell death.However,the mechanism underlying this celldeath is notcompletely understood.Iron acts as a cofactor in the TCA cycle,and for electron transferchain enzymes.In the presentstudy,Ifound thatsupplementation with iron reduced PA-induced INS-1 celldeath.Therefore,Iattempted to determine the mechanism underlying the protective effects of iron against PA-induced lipotoxicity.Furthermore,Ialso found thatsodium fluorocitrate (SFC),which is a known aconitase inhibitor,completely protected against PA-induced INS-1 celldeath.Ifthe mechanism by which SFC completely protectsagainstPA-induced celldeath could beclarified,itmay bepossible to prevent lipotoxicity. Therefore, I also attempted to determine the mechanism underlying the protective effects of SFC against PA-induced lipotoxicity.Aco1fulfillstwofunctions,actingbothasanenzymeandanIRP. Thus,experimentswerealsoconducted to determinetheassociation between iron metabolism and lipotoxicity,assuming thataconitase inhibited by SFC mayplayaroleasanIRP.
I
I
.MATERI
ALS AND METHODS
A.MATERI
ALS
1.Reagent
s
Most chemicals, including glucose, palmitate, FeCl3, FeSO4,
deferoxamine, 3-[4,5-dimethylthiazol-2-yl]-2,5-diphenyltetrazoilium bromide (MTT), holo-transferrin (h-Tf), 4-phenylbutyrate (4-PBA), bezafibrate, T0901317, 5-aminoimidazole-4-carboxamide-1-β-D-ribofuranoside (AICAR), ketoisocaproate,2-aminobicyclo[2.2.1]heptan-2-carboxylic acid (BCH),sodium fluoroacetate, DL-fluorocitric acid barium salt, sodium citrate, acetate, thapsigargin, streptozocin, hydrogen perxoide, ficoll were purchased from Sigma-Aldrich (St,Louis,MO).Deferasirox and Dp44mT were purchased from Santa CruzBiotechnology (Santa Cruz,CA).Calcein-AM wasobtained from BD bioscience (San Diego, CA). Chemicals were dissolved in the medium orin dimethylsulfoxide (DMSO),and then treated atthe required working dilution. Cytokines such as IL-1β, TNF-α, and IFN-γ were purchased from R&D Systems (Minneapolis, MN). Anti-caspase3, anti-HIF-1a, anti-CHOP, anti-FTH, anti-phospho-PERK, anti-LC3, anti-phospho-eIF2α, anti-eIF2α, anti-phospho-IRS1 anti-phospho-AKT, anti-AKT, anti-phospho-Erk, anti-phospho-AMPK, anti-AMPK and anti-phospho-S6K antibodies were obtained from CellSignaling Technology (Beverly,MA).Anti-Actin,anti-tubulin,anti-XBP1,anti-CD36,anti-GDH and anti-TfR were purchased from Santa Cruz Biotechnology (Santa Cruz,CA). Anti-phospho-JNK antibody was obtained from Invitrogen (Carlsbad,CA). Anti-CTP1 and anti-NDUFA9 antibodies were obtained from Abcam (Cambridge, UK). Anti-BiP antibody was obtained from stressgen (Farmingdale,NY).
B.Met
hods
1.Cel
land cul
t
ur
e
INS-1 rat insulinoma cells were maintained in RPMI 1640 medium (Cellgro,Manassas,VA)supplemented with 10% fetalbovine serum (FBS; Sigma-Aldrich, St. Louis, MO), 100 U/ml penicillin (Duchefa, Haarlem, Netherlands)and100mg/mL streptomycin(Duchefa)at37°C inahumidified atmospherecontaining95% airand5% CO2.
2.Pr
epar
at
i
on ofpal
mi
t
at
e
Palmitate/bovine serum albumin (BSA) conjugates were prepared by soaping palmitatewithsodium hydroxideandmixingwithBSA.Palmitate(20 mM in 0.01 M NaOH)was incubated at70 °C for30 min.The fatty acid soaps were then complexed with 5% fatty acid-free BSA in phosphate-bufferedsaline(PBS)in a1:3volumeratio.Complexedfatty acids consisted of5mM palmitateand 3.75% BSA.Thepalmitate/BSA conjugates weredilutedin10% FBS culturemedium andadministeredtoculturedcells.
3.I
sol
at
i
onofi
sl
et
s
Isletswereisolatedfrom 10week-oldmaleSpragueDawley (SD)rats using a collagenase digestion method. Briefly, after injecting 10 ml of collagenase P (0.75 mg/ml) (Rochediagnostics GmbH,Mannheim,Germeny) intothebileducts,swollen pancreaseswereexcised and then incubated in a waterbath at37°C for7min.Afterstopping thecollagenasedigestion with cold Hanks’balanced saltsolution (HBSS),pancreatictissuesweredisrupted by repetitivepipetting and subsequently by passing them through a 400-µm mesh.Isletswere separated by centrifugation on 25%,23%,21.5% and 11%
Ficollgradients.Isletsattheinterfacebetween the21.5% and 11% fractions were collected and washed with HBSS.Healthy islets were hand-picked underastereomicroscope.Toobtainsinglebetacells,isletsweretreatedwith trypsin-EDTA for 2 min and dissociated by repetitive pipetting. The dissociatedisletcellswerethengrowninRPMI1640medium containing 10% FBS,100U/mlpenicillinand100μg/mlstreptomycin.
4.MTT-basesvi
abi
l
i
t
y assay
The cells were treated with 0.25 mg/mlMTT for1 h.Supernatants were removed and 100 μlisopropanolwas then added to each ofthe well. Afterincubating for30 min,absorbance was measured at570 nm using a microplatereader(Bio-Rad,Hercules,CA).
5.Measur
ementofcel
ldeat
h
Cell death was determined by using the cell death detection enzyme-linked immunosorbantassay (ELISAplus)kit(RocheApplied Science, Mannheim,Germany).Briefly,the cells were lysed by adding lysis buffer (supplied with the kit).Aftercentrifugation (200g,10 min),the supernatant was pipetted onto an anti-streptavidin-coated microplate. Anti-DNA monoclonal antibody conjugated with peroxidase (anti-DNA-POD) and anti-histone-biotinwasadded.Afterincubationfor90minat25°C,thewells were rinsed with incubation buffer(supplied with the kit)three times.The color was developed by adding 2,20-azino-di-[3-ethylbenzthiazoline sulphonate](ABTS)substratesolutionandbyincubating withshaking at250 rpm for10–20 min.The amountofperoxidase retained in the nucleosome complexwasdeterminedbymeasuringtheabsorbencyat405nm.
6.W est
er
n bl
otanal
ysi
s
RIPA buffer (150 mM NaCl,1% NP-40,0.5% deoxycholate,0.1% sodium dodecylsulfate,50mM Tris.HClatpH 7.5,proteaseinhibitorcocktail; Roche Applied Science,Mannheim,Germany) was used for extraction of cellularproteins.Equivalentamountsofprotein(30μg)inSDS samplebuffer (50mM Tris-ClatpH 6.8,2% SDS,100mM DL-dithlothretol,10% glycerol) were separated by 8–12% SDS-polyacrylamide gelelectrophoresis and then transferred to apolyvinylidenedifluoridemembranesheet(Millipore,Bedford, MA).Thetargetantigenswerereactedwithprimaryantibodiesafterblocking the membranes with 5% skimmed milk for 30 min.After binding with secondary antibodies (horseradish peroxidase-conjugated anti-mouse IgG or anti-rabbit IgG antibodies),immunoreactive bands were detected using an enhanced chemiluminescence system (Pierce,Rockford,IL).Band intensity was determined by densitometric analysis using a one-dimensionalQuantity OneⓇ 1D imageanalysissystem (Bio-Rad,Hercules,CA).
7.RNA ext
r
act
i
on andmi
cr
oar
r
ay anal
ysi
s
TotalRNAsformicroarrayanalysiswereisolatedfrom theINS-1cells by using RNA iso Plus(Takara,Kyoto,Japan).Thequantity and quality of RNA were checked using the NanoDrop™ Lite Spectrophotometer (Thermo Scientific,Waltham,MA USA),and RNA integrity of these samples was analysed using the Agilent 2100 Bioanalyzer (Agilent Technologies,Santa Clara,CA,USA).RNA amplification and labelling wereperformed using the Agilent’sLow RNA InputLinearAmplification kitPLUS.Cy3-labeled cRNA washybridized totheWholeRatGenomeOligo Microarray ver.3.0(4× 44 k)(AgilentTechnologies),following themanufacturer'shybridization protocol. Afterthe washing step,Scan and imageanalysis wereperformed using the
Agilent’s DNA microarray scanner and Feature Extraction Software, respectively. Data analysis using an Agilent's GeneSpring Software was performednormalizationandclustering.Geneswithtwofoldup/downregulation wereconsideredasdifferentially expressedataP valueof<0.05,Student’st test.Functionalclassificationofthegeneswasperformedusinggeneontology andpathwayanalysis.
8. Rever
se t
r
anscr
i
pt
ase-pol
ymer
ase
chai
n
r
eact
i
on
and
quant
i
t
at
i
vePCR
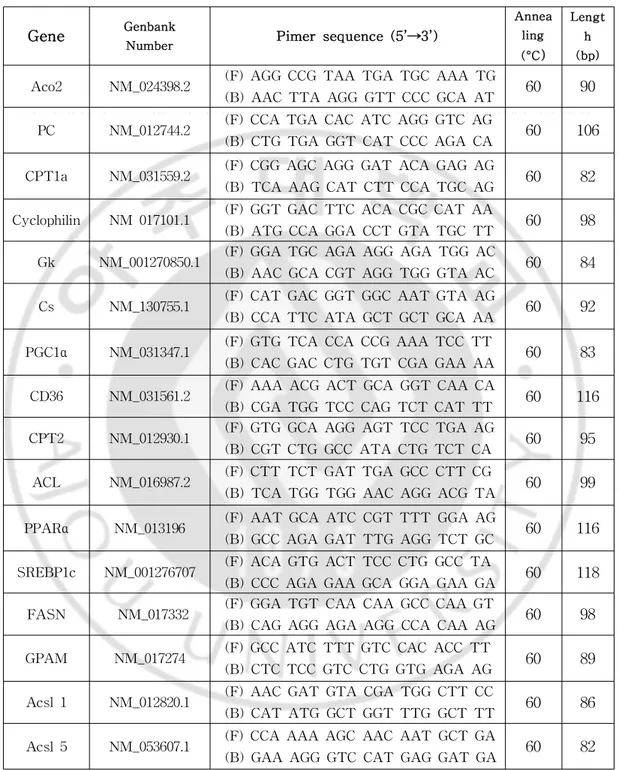
Expression levels ofmRNAs were determined using a RNA PCR kit Version 3.0 (Takara,Shiga,Japan).Briefly,totalRNAs were extracted by using RNAiso Plus (Takara).One microgram oftotalRNA was used for cDNA synthesis.The cDNAs were synthesized with avian myeloblastosis virus(AMV)reversetranscriptaseandrandom 9-merssuppliedfrom kit.and underwentPCR amplification with primersets ofdifferentgenes.Nucleotide sequences,annealing temperatures,length and Genbank numbersarelisted in Table3.AmplifiedDNAswereanalyzedby1% agarosegelelectrophoresisor was analyzed by using a SYBR green Premix (TaKaRa) and a TP 850 ThermalCyclermodel(Takara,Japan).Expression oftargetgenes(Table2) wasnormalizedtocyclophilinandcalculatedusingthe2∆∆Ct.
9.DNA and RNA t
r
ansf
ect
i
on
The siRNA duplexes were designed and synthesized from Genolution Pharmaceuticals, Inc. (Seoul, Korea) or Sigma-Aldrich (St, Louis, MO). Plasmid pBa.TfR.GFP for expression of TfR was obtained from Addgene (Cambridge,MA).The plasmids fortransfection were prepared by using a
Qiagen plasmid Midikit.INS-1cellsweretransfected with siRNA duplex or plasmid DNAs using the NeonTM electro-transfection system (Invitrogen, Carlsbad,CA,USA).ThesiRNA duplex with pcDNA orplasmidDNAsin R buffer (Invitrogen Carlsbad,CA,USA) were transfected into 1×10⁷ INS-1 cellsunderconditionsof1650V and10ms.Aftertransfection,thecellswere seededintoeachwelloftheplateandincubatedfor36h.
10.Measur
ementofi
nt
r
acel
l
ul
arl
abi
l
ei
r
onpool(
LI
P)
The iron sensitive fluorescentdye calcein was used to evaluate the labileiron pool(LIP)in INS-1cells.In brief,INS-1cellswereincubated in KrebsRingerBuffer(10mM HEPES,5mM NaHCO3,1mM MgCl2,129mM
NaCl,4.8mM KCl,1.2 mM KH2PO4,2.5 mM CaCl2,2% BSA)with 0.1 μM
calcein-AM (BD biosciences,San Diego,CA)for1 hr.Free calcein without metal-bound calcein was determined by measurement of fluorescence at excitation at488 nm and emission at517 nm.The addition offree calcein and iron-bound calcein was determined after chelation ofintracellular iron with 4μM intracellulariron chelatorDp44mT for15min.RelativeLIP level was determined by comparing the fluorescence originated from iron-bound calcein.
11.Aconi
t
aseact
i
vi
t
y assay
Aconitase activity assay was determined by using Aconitase Activity Colorimetric Assay Kit(Biovision,Milpitas,CA).INS-1 cells (1× 10⁷)were seeded in 100Φ dish and cultured for 24h.PA-treated cells were scraped, washedwithphosphatebufferedsaline(PBS),andhomogenizedincoldAssay buffer(suppliedfrom thekit).Aftercentrifugeat800xgfor10minat4°C, the supernatant were collected for cytosolic-aconitase assay. For
mitochondrial-aconitaseassay,centrifugethesupernatantat20,000x g for15 minat4°C andcollectthepellet,dissolvedintocoldAssay Buffer,andthen sonicated for20sec.Afteradded activation solutions(supplied from thekit) tosample,then incubatedonicefor1hrtoactivateaconitasein thesample. Activated samples and isocitrate standard solution (supplied from the kit) were added into 96-wellplate and then sample reaction mix (assay buffer, enzymemix,substrate,suppliedfrom thekit)wereaddedtoeachtestsample and isocitratestandards.and incubated at25°C for30-60min,Afteradding developer(suppliedfrom thekit),thereaction wasperformedat25°C for10 min.Absorbance at450 nm was measured and quantity ofisocitrate was then determined on thebasisofisocitratestandard curve.Aconitaseactivity was calculated by B/(TxV) x sample dilution factor.(B is the isocitrate amountfrom Standartd Curve,T is the time incubated,V is the pretreated samplevolumeaddedintothereactionwell.)
12.Oxygen consumpt
i
on r
at
e(
OCR)
Oxygen consumption rate (OCR) was measured by using XF24 extracellularanalyzer(Seahorsebioscience,North Billerica,MA).INS-1 cells wereseeded in XF24 cellculturemicroplateata density of5×104cells/well with normalculture medium and allowed to attach overnight.Prior to the assay,cellsareprewashed3timeswithXF assaymedium supplementedwith 11 mM glucose (forglucose OCR)or2.5 mM glucose/50 mM carnitine/200 uM palmitate(forpalmitateOCR)and then equilibratedin XF assay medium at37°C inanon-CO2incubatorfor1hour.TheaverageOCR wasobtained bythreemeasurement.
13.PA upt
ake
Palmitate uptake was determined by measurement of intracellular [1-14C]palmitate.Briefly,cells(3x10⁵)werewashedby KHB-palmitatebuffer (KHB :NaCl111 mM,KCl4.7 mM,MgSO4 2 mM,Na2HPO4 1.2 mM,
glucose 2.5 mM, carnitine 0.5 mM, PA: 200 uM) and incubated with radio-labeled palmitate(0.1μCi[1-14C]palmitate[50mCi/mmol,PerkinElmar, Covina,CA]at37°C for30min.Afterwashing withKRB,added1% Triton X 100 and incubated at25 °C for 30 min.Lysed cells containing [1-14C] palmitateweretransferredtoanew tubeandmeasuredby liquidscintillation counter (Tri-Carb 2100; Packard Instrument,Meriden,CT).Normalization relativetointracellularproteincontentinlivecellswasperformed.
14.Quant
i
t
at
i
on ofi
nsul
i
n
INS-1(2× 10⁵)cellson 24-wellplateswerewashed twicewith KRB buffer(24 mM NaHCO2,1.2 mM MgCl2,1 mM HEPES,129 mM NaCl,4.8
mM KCl,1.2 mM KH2PO4,2.5 mM CaCl2,0.2% BSA,0.2 mM glucose,pH
7.4)and then incubated in the same bufferfor1 h.Insulin secretion was stimulatedbytreatmentofcellswith0.2mM glucoseor16.7mM glucosefor 2 h.Atthe end ofthe incubation,the amountofinsulin released into the supernatantwas quantified using a ratinsulin RIA kit(Linco Research,St. Charles, MO). Briefly, the diluted medium supernatant was mixed with
125I-insulin and anti-insulin antibody and then incubated overnightat4 °C.
After incorporating the precipitating reagents to the mixtures and further incubatingat4°C for20min,theaggregateswerecollectedbycentrifugation at2000 g for20 min.Radioactivity in the pelletaggregates was quantified using agamma-counter(Perkin-Elmer,Fremont,CA).Theamountofinsulin wasthencalculatedusingastandardcurve.
15.I
mmunocyt
ochemi
st
r
y
Forimmunofluorescencemicroscopy,cells werefixed for30 min with 4% paraformaldehydeatRT followedby apermeabilisation with 0.1% Triton X 100for10min.Andthencellswereincubated1% FBS inPBS for30min to block unspecific binding of the antibodeies.After blocking cells were incubatedfor16hourat4°C temperaturewiththeCD36antibodies(1:500)in 1% FBS in PBS.Three washes with PBS cells were incubated with the respective fluorescently labelled secondary antibodies in PBS containing 1% FBS for 1 hour at room temperature.The anti-FITC-labelled secondary antibodieswerediluted 1:200and DAPIwerediluted 1:1000.Coverslipswere mounted in mounting medium and fluorescent images were acquired on confocalmicroscopearranged with AdobePhotoshop.Allconfocalimagesare representativesinglesections.
16.St
at
i
st
i
cs
Data are represented as means± SE from atleastthreeindependent experiments.Differences between the groups were determined by one way analysis ofvariance (ANOVA)using the SPSS statisticalanalysis program. Turkey’s multiple range test was performed for evaluation of differences between the groups.Statisticalsignificance of the difference between two groups was analyzed by Student's t-testforcomparison oftwo groups.A valueofP < 0.05wasconsideredtoindicateasignificantdifferencebetween groups.
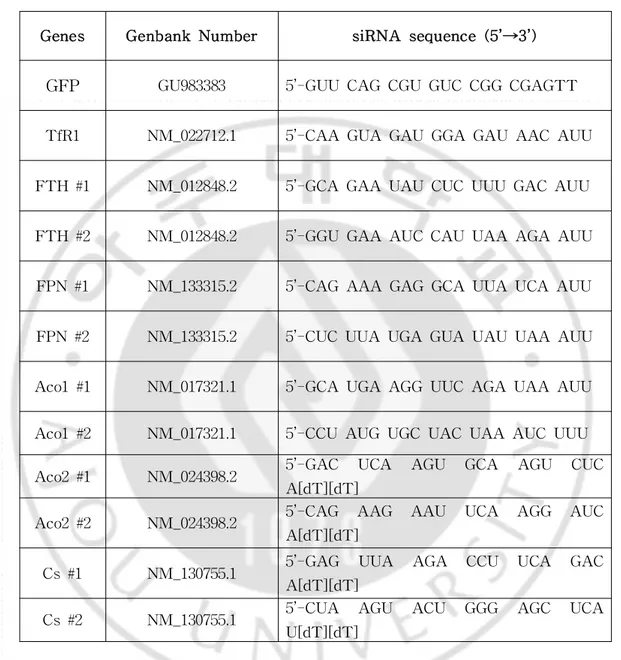
Genes Genbank Number siRNA sequence(5’→3’)
GFP GU983383 5’-GUU CAG CGU GUC CGG CGAGTT
TfR1 NM_022712.1 5’-CAA GUA GAU GGA GAU AAC AUU
FTH #1 NM_012848.2 5’-GCA GAA UAU CUC UUU GAC AUU
FTH #2 NM_012848.2 5’-GGU GAA AUC CAU UAA AGA AUU
FPN #1 NM_133315.2 5’-CAG AAA GAG GCA UUA UCA AUU
FPN #2 NM_133315.2 5’-CUC UUA UGA GUA UAU UAA AUU
Aco1#1 NM_017321.1 5’-GCA UGA AGG UUC AGA UAA AUU
Aco1#2 NM_017321.1 5’-CCU AUG UGC UAC UAA AUC UUU Aco2#1 NM_024398.2 5’-GAC UCA AGU GCA AGU CUC
A[dT][dT]
Aco2#2 NM_024398.2 5’-CAG AAG AAU UCA AGG AUC A[dT][dT]
Cs#1 NM_130755.1 5’-GAG UUA AGA CCU UCA GAC A[dT][dT]
Cs#2 NM_130755.1 5’-CUA AGU ACU GGG AGC UCA U[dT][dT]
Gene Genbank Number Pimersequence(5’→3’) Annea ling (°C) Lengt h (bp) Aco2 NM_024398.2 (F)AGG CCG TAA TGA TGC AAA TG
(B)AAC TTA AGG GTT CCC GCA AT 60 90 PC NM_012744.2 (F)CCA TGA CAC ATC AGG GTC AG
(B)CTG TGA GGT CAT CCC AGA CA 60 106 CPT1a NM_031559.2 (F)CGG AGC AGG GAT ACA GAG AG
(B)TCA AAG CAT CTT CCA TGC AG 60 82 Cyclophilin NM 017101.1 (F)GGT GAC TTC ACA CGC CAT AA
(B)ATG CCA GGA CCT GTA TGC TT 60 98 Gk NM_001270850.1 (F)GGA TGC AGA AGG AGA TGG AC
(B)AAC GCA CGT AGG TGG GTA AC 60 84 Cs NM_130755.1 (F)CAT GAC GGT GGC AAT GTA AG
(B)CCA TTC ATA GCT GCT GCA AA 60 92 PGC1α NM_031347.1 (F)GTG TCA CCA CCG AAA TCC TT
(B)CAC GAC CTG TGT CGA GAA AA 60 83 CD36 NM_031561.2 (F)AAA ACG ACT GCA GGT CAA CA
(B)CGA TGG TCC CAG TCT CAT TT 60 116 CPT2 NM_012930.1 (F)GTG GCA AGG AGT TCC TGA AG
(B)CGT CTG GCC ATA CTG TCT CA 60 95 ACL NM_016987.2 (F)CTT TCT GAT TGA GCC CTT CG
(B)TCA TGG TGG AAC AGG ACG TA 60 99 PPARα NM_013196 (F)AAT GCA ATC CGT TTT GGA AG
(B)GCC AGA GAT TTG AGG TCT GC 60 116 SREBP1c NM_001276707 (F)ACA GTG ACT TCC CTG GCC TA
(B)CCC AGA GAA GCA GGA GAA GA 60 118 FASN NM_017332 (F)GGA TGT CAA CAA GCC CAA GT
(B)CAG AGG AGA AGG CCA CAA AG 60 98 GPAM NM_017274 (F)GCC ATC TTT GTC CAC ACC TT
(B)CTC TCC GTC CTG GTG AGA AG 60 89 Acsl1 NM_012820.1 (F)AAC GAT GTA CGA TGG CTT CC
(B)CAT ATG GCT GGT TTG GCT TT 60 86 Acsl5 NM_053607.1 (F)CCA AAA AGC AAC AAT GCT GA
(B)GAA AGG GTC CAT GAG GAT GA 60 82
Gene Genbank Number Pimersequence(5’→3’) Annea ling (°C) Lengt h (bp)
Cyclophilin NM_017101.1 (F)CCA AAG ACA GCA GAA AAC TT
(R)GAA ATT AGA GTT GTC CAC AG 60 403
Aco1 NM_017321.1 (F)AAT CCG TCC GTG ATG TTA GG
(B)TGC TAA GGC ATT CCA GCT TT 60 558
Aco2 NM_024398.2 (F)GCC GTA ATG ATG CAA ATC CT
(B)AGG TAC AGG GCC AAA CTC CT 60 500
Cs NM_130755.1 (F)TAC CTA AGG AGC AGG CCA GA
(B)CCG GTA CAG ATT CCG GTA GA 60 545
Table 3. Nucleotide sequences of sets and reaction condition for semi-quantitativePCR
I
I
I
.RESULTS [
PART I
]
A.Pal
mi
t
at
et
r
eat
mentr
educesi
nt
r
acel
l
ul
ari
r
on l
eveli
n
I
NS-1bet
acel
l
.
1.I
r
on-r
egul
at
ed geneexpr
essi
onby pami
t
at
et
r
eat
ment
Palmitate(PA)asasaturated fatty acid wascytotoxicto INS-1beta cells.PA treatmentinducedapoptoticdeathinINS-1cells(Choietal,2011a). ExposureofPA/BSA conjugatetoINS-1cellsinducedcaspase3cleavagein a concentration- and time-dependent manner (Fig. 12).To elucidate the mechanism of PA-induced INS-1 cell death, I investigated expressional modulation ofdifferentgenes in PA-treated INS-1 cells through microarray technique.Many genes were up and down-regulated by PA.Through the studiesforseveralyears,weconcludedthatmetabolicdisorderisinvolvedin PA-induced lipotoxicity and this metabolic disorder may be due to mitochondrialdysfunction.I confirmed that the expression of many genes related to metabolism was reduced.Moreover,some enzymes involved in metabolism requires iron fortheirenzymatic activity.Thus,the activity of theseenzymesmaybeaffectedbyintracellularironlevels(Oexleetal,1999). Ialsoobserved thattheexpression ofiron–metabolism related genesaltered by PA treatmentin my microarray data.Todeterminethealteredexpression ofiron-metabolism relatedgenesaffectslipotoxicity induced by PA in INS-1 cells,Ifocused on thesegenes.In particularly,mRNA levelofTfR foriron uptakewasreducedinPA-treatedcellsat13hafterPA treatment(Fig.12C). In accordance with mRNA down-regulation in PA-treated cells,TfR protein levelalso significantly reduced at6 h afterPA treatment(Fig.12B).The reduction wasgreaterat9and 12h than 6h.Sincelevelofferritin asiron
storage protein can be reversely regulated compared with TfR,Isupposed thatferritin levelin INS-1 cellswasincreased by PA treatment.Asshown in Fig.12B,ferritin heavy chain (FTH)was significantly increased at6,9 and 12 h afterPA treatment.These data suggested thatPA mightreduce intracellular labile iron level in INS-1 cells by reduced iron uptake and increasedironbindingtoferritin.
2.I
nt
r
acel
l
uarl
abi
l
ei
onpool
To determine whether PA affects intracellular labile iron levelin INS-1 cell, I investigated cytosolic labile iron pool (LIP) by measuring differenceoffluorescencein calcein/acetoxymethylester(Calcein/AM)-treated cells between before and afteriron chelation by treatmentwith intracellular iron chelatorDp44mT.Beforemeasuring effectofPA on LIP,effectofiron chelators and iron ions was firstinvestigated.As shown in Fig.13A,iron ionsthemselvessuchash-Tf,FeCl3andFeSO4increasedLIP in INS-1cells
while iron chelators such as DFO and DS significantly reduced intracellular LIP.Treatmentwith0.4mM PA alsosignificantlyreducedintracellularLIP at 9 and 12 h aftertreatmentand the levelofLIP at9 h was around 24% lowerthanthatinPA-untreated(Tenopoulouetal,2007)(Fig.13B).
Fig.12.PA reducesiron metabolism relatedgeneexpression.(A).INS-1 cells were treated with different concentration of PA with bovine serum albumin (BSA) conjugate for 12h.Pro- and cleaved form of caspase 3 (P-Cas3 and C-Cas3)were detected by immunoblotting.Maximum levelof C-Cas 3 at0.4 mM PA was considered as 100% and relative levels were counted.Data representmean ± SE from three independentexperiments.* P<0.05;** P<0.01 vs C-Cad 3 from PA-untreated INS-1 cells.(B).INS-1 cells were treated with 0.4 mM PA and then,levelofC-Cas 3,transferrin receptor (TfR), and ferritin heavy chain (FTH) was measured by immunoblotting atdifferentincubation times.Maximum levelofC-Cas 3 or FTH at12 h and TfR at0 h was considered as 100% and relative levels were counted.*P<0.05;** P<0.01 vs.C-Cas 3 from PA-untreated INS-1 cells.#P<0.05;##P<0.01vs.TfR from PA-untreated INS-1cells.$P<0.05;
$$ P<0.01 vs.FTH from PA-untreated INS-1 cells.(C).INS-1 cells were
treated with 0.4 mM PA forindicated times.Expression ofiron metabolism related genes were determined using a microarray analysis. The color represents relative gene expression differences (red,large gene expression values;blue,smallgeneexpressionvalues).
Fig.13.Intracelluar iron levels decrease by PA.(A).INS-1 cells were treatedwithdifferentironions(10μg/mlholo-form transferrin,h-Tf;0.1mM FeCl3,FC;0.1 mM FeSO4,FS),iron chelators (0.4 mM deferoxamine,DFO;
25 μM deferasirox, DS) or 0.4 mM palmitate (PA) for 9 h. Relative intracellulariron poolwas determined by comparing ofcalcein fluorescence afteriron chelation with Dp44mT * P<0.05 vs.intracellulariron poolfrom BSA-treated INS-1 cells.(B).INS-1 cells wereincubated with 0.4 mM PA for different times. Relative intracellular iron pool was determined by comparing ofcalcein fluorescence.* P<0.05 vs.intracellulariron poolfrom PA-untreatedINS-1cells.
B. I
r
on depl
et
i
on and suppl
ement
at
i
on i
n PA-i
nduced
I
NS-1cel
ldeat
h
1.I
r
on depl
et
i
on augment
spal
mi
t
at
e-i
nducedI
NS-1cel
ldeat
h.
Since PA reduced intracellularLIP,Iinvestigated the involvementof iron in PA-induced INS-1 celldeath.Iron levelwas reduced by treatment with two iron chelators such asDFO orDS.Treatmentwith 0.2 mM DFO itselffor12hdidnotinducedcaspase3cleavage(Fig.14A),suggesting that the 0.2 mM DFO was nottoxic to INS-1 beta cells.However,the same concentration ofDFO significantly increased PA-induced caspase3 cleavage. Treatmentof0.2 mM DFO increased levelofcleaved caspase 3 3.2- and 1.7-fold,compared with thatinduced by PA only at9and12h,respectively (Fig. 14A). Similar to DFO, DS did not affect cell fate, and further potentiated caspase 3 activation induced by PA at12h (Fig.14B).Ialso checked INS-1 celldeath by measuring cytoplasmicDNA fragmentation.As shown in Fig. 14, treatment with DFO or DS in the presence of PA significantly increased DNA fragmentation of INS-1 cells,suggesting that DFO orDS amplifiedPA-inducedlipotoxicity.Thedatademonstratedthatall attempts to reduce intracellular LIP potentiated PA-induced lipotoxicity to INS-1betacells.Fig.14.Decrease of LIP agumentPA-induced INS-1 celldeath.(A), (B).INS-1 cells were treated with 0.4 mM PA in the presence of0.2 mM DFO or25μM DS.Cleaved caspase3(C-Cas3)wereinvestigated at3,6,9 and 12 h by immunoblottiing with anti-caspase 3 antibodies.Data represent mean ± SE from three independentexperiments.* P<0.05;** P<0.01 vs. cleavedcaspase-3from PA-treatedINS-1cells.FragmentedDNAswerealso measured by using CellDeath Detection ELISA kitin INS-1 cells treated with PA and DFO (PA/DFO) or PA and DS (PA/DS) for 12 h.Data represented mean ± SE from three independent experiments.# P<0.05;## P<0.01vs.fragmentedDNA from PA-treatedINS-1cells.
2.I
r
on suppl
ement
at
i
on pr
event
sPA-i
nducedI
NS-1cel
ldeat
h
Since iron depletion potentiated PA-induced INS-1 celldeath,itwas investigated whether iron supplementation protected PA-induced celldeath. Increase ofintracellulariron levelwas carried outby addition offerric or ferrous ions such as FeCl3 (FC) and FeSO4 (FS),respectively.Treatmentwith 0.1mM ofFC orFS didnotaffectcaspase3activation in INS-1cells. Ontheotherhand,thesameconcentrationofFC andFS reducedPA-induced caspase 3 activation. Both FC and FS significantly reduced PA-induced cleavedcaspase3levelaround40-50% at12hafterPA treatment(Fig.15A and 15B). In addition, treatment with hole-transferrin (10 μg/ml) as a transferrin/iron conjugate,which is used forincrease ofLIP in cellculture, showed significantprotective effecton PA-induced caspase 3 cleavage (Fig. 15C).I also confirmed INS-1 celldeath by measuring cytoplasmic DNA fragmentation.FC orFS treatmentsignificantlydecreasedDNA fragmentation ofINS-1cellsin thepresenceofPA.Moreover,h-Tftreatmentalsoreduced DNA fragmentationofINS-1cellsinthepresenceofPA,suggestingthatFC, FS orh-Tfprevented PA-induced lipotoxicity (Fig.15).These experiments demonstrated that all attempts to increase intracellular LIP reduced PA-inducedtoxicitytoINS-1cells.
Fig.15.Increase ofLIP protectagainstPA-induced INS-1 celldeath. (A),(B),(C).INS-1 cellsweretreated with 0.4 mM PA in thepresenceof 0.1 mM FeCl3,(FC)0.1mM FeSO4,(FS)orholo-transferrin (10μg/ml,h-Tf).
Cleaved caspase3wereinvestigated at3,6,9and 12h by immunoblottiing with anti-caspase 3 antibodies. Data represent mean ± SE from three independent experiments.* P<0.05 vs.cleaved caspase-3 from PA-treated INS-1 cells.DNA fragmentation was also measured by using CellDeath Detection ELISA kitin INS-1 cells treated with PA and FC (PA/FC),FS (PA/FS),orh-Tf(PA/h-Tf)for12 h.Data represented mean± SE from threeindependentexperiments.#P<0.05;##P<0.01vs.fragmentedDNA from PA-treatedINS-1cells.
3.Modul
at
i
on ofi
r
on r
egul
at
i
ongenes.
Toclarify theeffectofintracellulariron levelon PA-inducedbetacell death,theeffectofmolecularreductionorincreaseofTfR onPA-inducedcell death was also investigate Molecular reduction was carried out by transfection ofTfR siRNA andmolecularincreaseofTfR wascarriedoutby transfection of human transferrin receptor-green fluorescence protein (hTfR-GFP).Iconfirmed thelevelofTfR by immunoblotting with anti-TfR antibodies at36 h aftertransfection (Fig.16).Knockdown ofTfR reduced TfR protein levels and significantly decreased LIP compared with that of control whereas overexpression of hTfR increased level of TfR and significantly increasedLIP comparedwiththatofcontrol(Fig.17).Andthen, Icheckedwhethermodulation ofTfR moleculesaffectPA-inducedINS-1cell death.Knockdown ofTfR significantly increased levelofcleaved caspase 3 around 2.5- and 1.8- fold,compared with thatinduced by PA only at9and 12 h,respectively.Similarresults were obtained in the DNA fragmentation assay.KnockdownofTfR augmentsDNA fragmentationinPA treatedINS-1 cells (Fig.16A).Conversely,as shown in Fig.16B,levelof PA-induced cleavedcaspase3wassignificantlyreducedat12hinhTfR-transfectedcells, and levelofPA-induced DNA fragmentation in hTfR-transfected cells also significantly decreased at 12h suggesting that increased uptake of iron throughTfR over-expressionrenderedINS-1cellstoresistanttoPA-induced death.In addition,Ialsocheckedknockdowneffectofanotherironregulatory protein such as ferritin heavy chain (FTH) and ferroportin 1 (FPN1) on PA-induced caspase 3 cleavage in INS-1 cells. As shown in Fig. 18, PA-induced increase ofcaspase 3 cleavage did notaltered although FPN1 mRNA andFTH proteinwerereducedbysiRNA transfection(Fig.18).
Fig.16.Modulation ofTfR1 alters PA-induced INS-1 celldeath.(A), (B).INS-1 cells were transfected with siRNA ofgreen fluorescence protein (GFP)orrattransferrin receptor(TfR1)forknockdown ofTfR and pcDNA or pBa-hTfR1-GFP (hTfR1) for overexpression of TfR by using Neon microporatorand furthercultured for36 h.Knockdown oroverexpression of transferrin receptor was confirmed by immunoblotting with anti-TfR1 antibodies.TransfectedINS-1cellswerefurthertreatedwith 0.4mM PA for 3,6,9and12h.Levelofcleavedcaspase3wasanalyzedbyimmunoblotting with anti-caspase 3 antibodies. Data represent mean ± SE from three independentexperiments.* P<0.05;** P<0.01 vs.C-Cas3 from PA-treated INS-1 cells.DNA fragmentation was also measured by using CellDeath Detection ELISA kit in TfR1 siRNA- or hTfR1-transfected INS-1 cells treated with 0.4mM PA for12 h.Data represented mean± SE from three independentexperiments.#P<0.05vs.fragmentedDNA from GFP siRNA-or pcDNA-tansfectedINS-1cellstreatedwithPA.
Fig. 17. Modulation of TfR1 alters intracellular iron pool. (A),(B). INS-1 cells were transfected with pcDNA or pBa-human transferrin receptor-greenfluorescenceprotein(hTfR1)forTfR1overexpressionandwith siRNA ofgreen fluorescenceprotein (GFP)orrattransferrin receptor(TfR1) forTfR1knockdownby using Neon microporatorandfurther,culturedfor36 h.Relative LIP was determined by comparing ofcalcein fluorescence.Data representmean± SE from threeindependentexperiments.*P<0.05vs.LIP from pcDNA3-transfected INS-1 cells. # P<0.05 vs. LIP from GFP siRNA-transfectedINS-1cells.