EXPERIMENTAL and MOLECULAR MEDICINE, Vol. 44, No. 8, 492-502, August 2012
Copyright ⓒ 2012 by the Korean Society for Biochemistry and Molecular Biology
This is an open-access article distributed under the terms of the Creative Commons Attribution Non-Commercial License (http://creativecommons.org/licenses/ by-nc/3.0) which permits unrestricted non-commercial use, distribution, and reproduction in any medium, provided the original work is properly cited.
Analysis of differential plaque depositions in the brains of
Tg2576 and Tg-APPswe/PS1dE9 transgenic mouse models of
Alzheimer disease
Tae-Kyung Kim
1,2*, Jung-Eun Lee
1*,
Sun-Kyu Park
3*, Kang-Woo Lee
1,2,
Ji-Seon Seo
1, Joo-Young Im
1,2, Sang-Tae Kim
4,
Joo-Yong Lee
5, Yang-Hee Kim
6,
Ja-Kyeong Lee
7and Pyung-Lim Han
1,2,3,81
Department of Brain and Cognitive Sciences
2
Brain Disease Research Institute
3
Department of Chemistry and Nano Science
4
Division of Life and Pharmaceutical Sciences Ewha Womans University
Seoul 120-750, Korea
5
Asan Institute for Life Sciences
Asan Medical Center and University of Ulsan College of Medicine Seoul 138-736, Korea
6
Department of Molecular Biology College of Natural Science Sejong University Seoul 143-747, Korea
7
Department of Anatomy Inha University School of Medicine Inchon 402-751, Korea
8
Corresponding author: Tel, 82-2-3277-4130; Fax, 82-2-3277-3419; E-mail, plhan@ewha.ac.kr *These authors contributed equally to this work. http://dx.doi.org/10.3858/emm.2012.44.8.056 Accepted 25 May 2012
Available Online 29 May 2012
Abbreviations: Aβ, amyloid β peptides; AD, alzheimer disease; APP, amyloid precursor protein; DAB, 3,3'-diaminobenzidine tetrahydro-chloride; HRP, horseradish peroxidase; PS1, presenilin 1
Abstract
Adequate assessment of plaque deposition levels in the brain of mouse models of Alzheimer disease (AD) is required in many core issues of studies on AD, in-cluding studies on the mechanisms underlying plaque pathogenesis, identification of cellular factors modify-ing plaque pathology, and developments of anti-AD
drugs. The present study was undertaken to quantita-tively evaluate plaque deposition patterns in the brains of the two popular AD models, Tg2576 and Tg-APPswe/ PS1dE9 mice. Coronally-cut brain sections of Tg2576 and Tg-APPswe/PS1dE9 mice were prepared and pla-que depositions were visualized by staining with an-ti-amyloid β peptides antibody. Microscopic images of plaque depositions in the prefrontal cortex, parietal cortex, piriform cortex and hippocampus were ob-tained and the number of plaques in each region was determined by a computer-aided image analysis method. A series of optical images representing a grad-ual increase of plaque deposition levels were selected in the four different brain regions and were assigned in each with a numerical grade of 1-6, where +1 was low-est and +6, highlow-est, so that plaques per unit in mm2 in-creased “sigmoidally” over the grading scales. Analyzing plaque depositions using the photographic plaque reference panels and a computer-aid image analysis method, it was demonstrated that the brains of Tg2576 mice started to accumulate predominantly small plaques, while the brains of Tg-APPswe/PS1dE9 mice deposited relatively large plaques.
Keywords: Alzheimer disease; disease models,
ani-mal; image processing, computer assisted; plaque, amyloid
Introduction
Transgenic Tg2576 mice of AD express human APP695 with double mutations (K670N-M671L), which results in amyloid plaque depositions in the brain starting from 9 months of age (Hsiao et al., 1996; Benzing et al., 1999; Kawarabayashi et al., 2001). Since its first introduction, Tg2576 mice have been widely used as a popular model of AD in numerous laboratories. Tg-APPswe/PS1dE9 (Tg-APP/PS1 for short) mice represent another animal model of AD that expresses mutant forms of human APP and presenilin 1, which result in amyloid plaque deposition in the brain starting from
6.5 months of age (Jankowsky et al., 2001, 2003). Thus, Tg-APP/PS1 mice exhibit early onset of plaque deposition in the brain, though plaque pathology in this model has not been characterized in detail. Regardless of the types of AD models, adequate assessment of plaque deposition levels in the brain is routine regarding many core issues of studies on AD, including unraveling the mechanisms of plaque pathogenesis, identification of cellular factors modifying plaque pathogenesis, and developments of anti-AD drugs.
The levels of plaque deposition in the brains are evaluated by measuring the number of plaques, plaque sizes, or total area covered by plaques, usually by using a computer-aid image analysis program (Lim et al., 2000; Bacher et al., 2008; Ho et
al., 2008). The number of plaques in a given area
can also be obtained by counting manually (Lee et
al., 2009; Seo et al., 2009). However, any of the
counting methods, including a computer-aid image analysis system, is painstaking and is using a tedious and time-consuming process. Moreover, microscopic systems equipped with a high-quality image analysis device are usually expensive and therefore are not easily available on demand to many researchers in the world. Concerning the details about the quantification of plaques, plaque sizes are heterogeneous and plaque deposition patterns vary in different areas of the brain. Accordingly, some easy methods are needed to complement the limited features of computer-aid image analysis methods or a simple manual counting method, provided that unbiased, quantitative and quantitative features are hold.
The present study was undertaken to quantitatively assess plaque deposition levels in the brains of the two mouse models of AD, Tg2576 andTg-APP/PS1 mice. To compare plaque deposition levels in the brains of Tg2576 and Tg-APP/PS1 mice, which exhibit, respectively, late and early onsets of plaque deposition and show potentially differential plaque deposition patterns, first we developed the 6-grade photographic plaque reference panels, which were then used as a basis of comparison. Next, using the 6-grade photographic plaque reference and a computer program-aid image analysis method, we demonstrated that the brains of Tg2576 mice started to accumulate predominantly small plaques, while the brains of Tg-APP/PS1 mice deposited relatively large plaques.
Results
Tg2576 mice (9-24 months old) were used to prepare coronally-cut brain sections, which were
stained with anti-Aβ (Bam-10) antibody and a HRP/DAB color reaction system to visualize plaque depositions. As reported previously, plaque deposition started from the age of approximately 9 months and was progressively enhanced with aging, as reported previously (Hsiao et al., 1996; Lee et al., 2009). To obtain quantitative data on plaque deposition levels, microscopic images of anti-Aβ antibody-stained 4 brain areas (prefrontal cortex, parietal cortex, piriform cortex and hippocampus) were captured using a microscope equipped with a digital camera. After labeling the captured plaques with a digitalized pseudo-color using a computer-aid program, the numbers of plaques in a defined rectangular area were automatically counted using an image analysis program. The counting areas in the prefrontal, parietal, and piriform cortices were 0.65, 0.33, and 0.37 mm2, respectively (Supplemental Data Figures
S1A-S1C). A “digital plaque” presented with 3, 6, 10, or 25 pixels in size was equivalent to a real “optical plaque” with the size of, respectively, 5.17, 7.31, 9.44, and 14.93 μm in diameter (Supplemental Data Figure S1G).
As demonstrated with digitalized plaques in the piriform cortex (Supplemental Data Figures S1H and S1J), the number of plaques assessed using an image analysis method in a given brain region varied depending upon the cut-off value of pixel size and staining intensity of plaques. Detailed analysis of optical images indicated that plaque-like images digitalized with 1-2 pixels by a computer-aid program often turned out to be plaque-like artifacts (Supple-mental Data Figure S2). Therefore, plaques labeled by 3 pixels and higher (> 5.17 μm) were considered as reliable “digital plaques”. Because of the irregularity in plaque shapes or the distribution, certain digitalized plaques appeared to vary in numbers depending upon image adjustment valuables (Supplemental Data Figures S1K-S1S; Supplemental Data Figure S2). It was noted that the cut-off value of staining intensity markedly influenced on the number of plaques. Because of the thickness of brain sections together with limited penetration of antibody to plaques embedded underneath the sectioned face, lightly stained plaques may or may not be detected depending upon image adjustment valuables (Supplemental Data Figures S1K-S1S; Supplemental Data Figure S2).
Previous studies have reported that Aβ levels and plaque deposition in the brain of Tg2576 mice accumulate exponentially after visible plaques appear (Kawarabayashi et al., 2001; Flood et al., 2002; Lee et al., 2009), but the increase in Aβ levels follows a sigmoid growth path with a sub-saturation phase after 15-16 months of age (Flood et al.,
494 Exp. Mol. Med. Vol. 44(8), 492-502, 2012
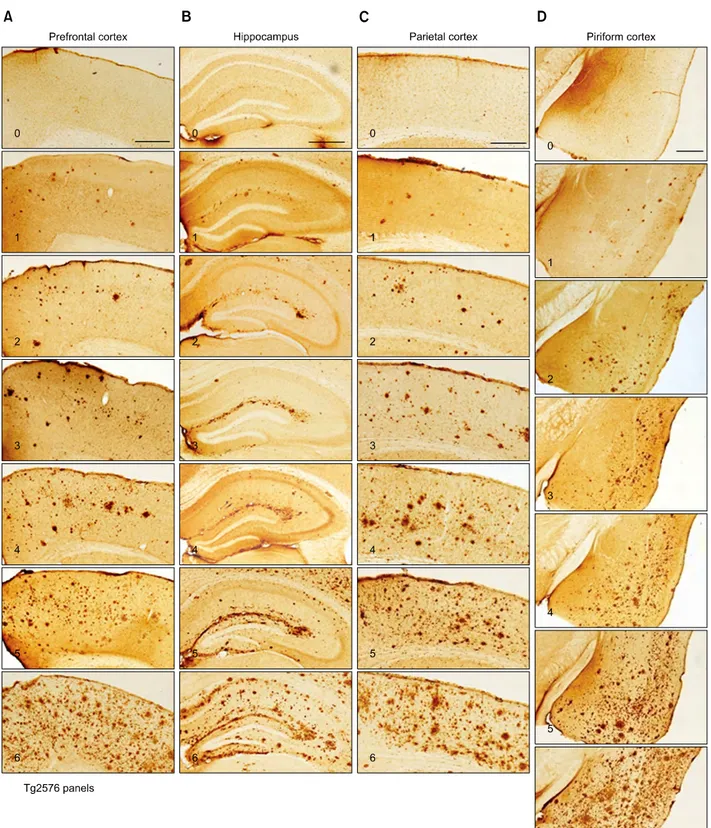
Figure 1. Photomicrographs showing the 6-grade photographic plaque reference panels for four selected regions in the brains of Tg2576 mice (plate A or
Tg2576 panels). (A-D) The 6-grade photographic plaque reference panels named “plate A or Tg2576 panels” showing plaque depositions in the prefrontal cortex (A, 0-6), hippocampus (B, 0-6), parietal cortex (C, 0-6), and piriform cortex (D, 0-6) of Tg2576 mice. Photomicrographs for each region were chos-en to represchos-ent an increasing number of plaques over the grading scales. In practice, a 0.5-interval grade at any level may be used. For example, whchos-en the level of plaque deposition is higher than +2, but lower than +3, a +2.5 grade may be given. Scale bar in A-D; 500 μm.
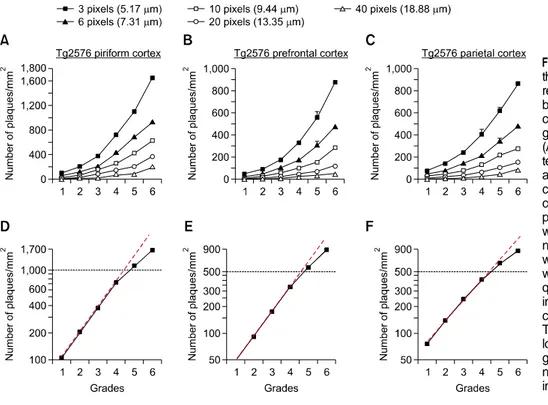
Figure 2. The relationship between the 6-grade photographic plaque reference panels (plate A) and num-ber of plaques determined by a computer-aid image analysis pro-gram in the brains of Tg2576 mice. (A-C) The numbers of plaques de-termined by a computer-aid image analysis method with an indicated cut-off pixel size in the prefrontal cortex (A), parietal cortex (B) and piriform cortex (C) of Tg2576 mice were plotted over the 6 grades. The numbers of animals for each grade were 4-6, except the grade 6, which was 3. (D-F) The numbers of pla-ques assessed by a computer-aid image analysis method with the cut-off value of 3 pixels (5.17 μm) in Tg2576 mice were plotted over the log scale (y axis). The red line is a genuine exponential increase. The numbers of plaques exponentially increased over the 0-4 grades.
2002). Considering these results, a series of optical images representing gradually increasing plaque levels in 4 different brain regions were selected, then assigned with a numerical grade of 1-6 grades, where +1 was lowest, and +6, highest, plaque deposition (Figure 1) on the basis of the following criteria.
After analyzing the numbers of plaque levels with a cut-off value of 3 pixels (corresponding to 5.17 μm in diameter) using a computer-aid image analysis method, the brain sections that were scored with numerical grades of +1, +2, +3, +4, +5, and +6 were found to have plaque numbers of 104, 202, 377, 723, 1,098, and 1,649 per mm2, respectively, in the
piriform cortex. This projection broadly met with the relationship as the plaque number per unit in mm2 in
the piriform cortex increased exponentially over the interval between grades 1-4, then in a slightly reduced rate over grades 5 and 6 (Figures 2A and 2D). This pattern of the plaque deposition curve is referred to being “sigmoidal”, although the term “exponential” may be interchangeably used in this case. Similar analyses on the plaque deposition in the prefrontal and parietal cortices led us to choose plaque numbers that increased sigmoidally over the plaque grades (Figures 2B, 2C, 2E and 2F). Thus, the plaque deposition curves had been subjectively chosen, but they were selected to fit to a sigmoidal curve to mimic a natural biological growth.
Some features of the sigmoidal plaque deposition curves may be worthy of noting. As predicted,
counting plaques with a cut-off value with higher pixel sizes for any of the six grades yielded a lower plaque number because of elimination of the number of plaques smaller than cut-off values in size. Brain sections determined by higher plaque grades contained proportionally larger plaques in size (Figures 2A-2C). The plaque density in the prefrontal and parietal cortices in Tg2576 mice was lower than the piriform cortex in Tg2576 mice (Figures 2A-2C). Precise assessment of the plaque numbers in the hippocampus by the computer-aid image analysis method was often hampered due to histologic configuration; for examples, the area near the vestigial hippocampal sulcus was often darkly stained, or the contour of the pyramidal cell layers often hindered computer-aid image analysis particularly for small-size plaques. Therefore, representative plaque images for each grade of the hippocampus were selected in consideration of the animal groups that were marked with the corresponding plaque grades in the other brain regions (Figure 1B). For examples, the image for plaque grade +3 in the hippocampus was chosen from the animal group that was marked with grade +3 in the other brain regions examined.
To understand the usefulness of the 6-grade photographic plaque reference panels, a group of available Tg2576 mice at various ages were prepared and plaque deposition levels were assessed in a blind manner using the photographic reference method and a computer-aid image
496 Exp. Mol. Med. Vol. 44(8), 492-502, 2012
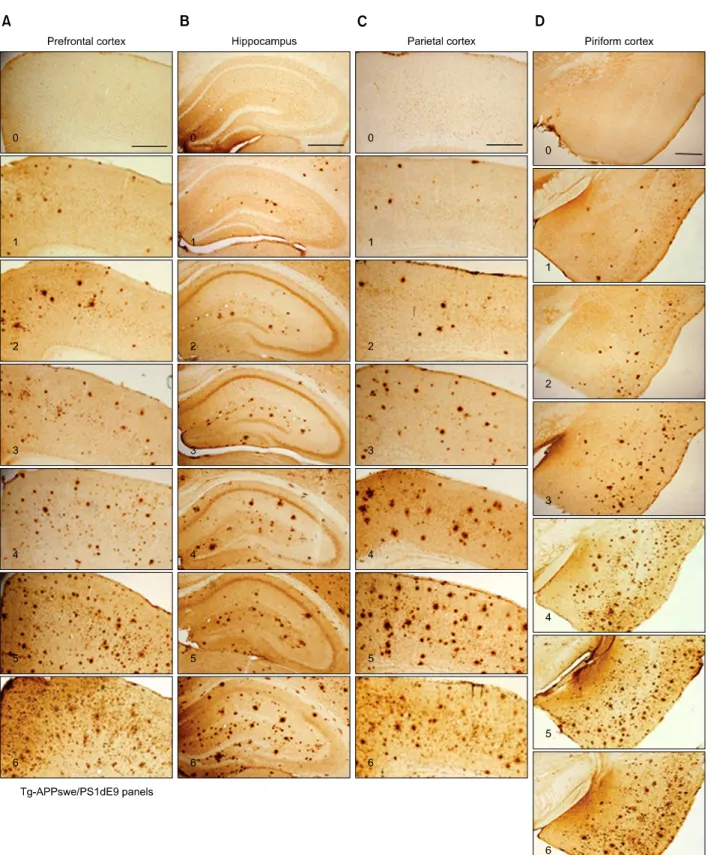
Figure 3. Photomicrographs showing the 6-grade plaque reference panels for four selected regions in the brains of Tg-APPswe/PS1dE9 mice (plate B or
Tg-APP/PS1 panels). (A-D) The 6-grade photographic plaque reference panels, named “plate B or Tg-APP/PS1 panels”, showing plaque deposition in the prefrontal cortex (A; 0-6), hippocampus (B; 0-6), parietal cortex (C; 0-6), and piriform cortex (D; 0-6) of Tg-APP/PS1 mice. Photomicrographs for each re-gion were chosen to represent an increasing number of plaques over the grading scales. In practice, a 0.5-interval grade at any level may be chosen. For example, when the level of plaque deposition is higher than +2, but lower than +3, a +2.5 grade may be given. Scale bar in A-D; 500 μm.
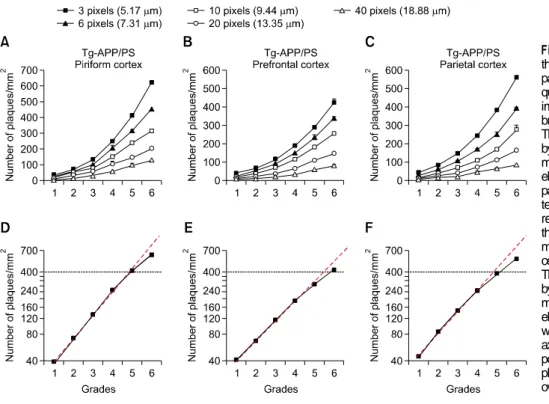
Figure 4. The relationship between the photographic plaque reference panels (plate B) and number of pla-ques determined by a computer-aid image analysis program in the brains of Tg-APP/PS1 mice. (A-C) The numbers of plaques determined by a computer-aid image analysis method with an indicated cut-off pix-el size in the prefrontal cortex (A), parietal cortex (B) and piriform cor-tex (C) marked with each of the rep-resentative grades were plotted over the 6 grades. The numbers of ani-mals for each grade were 4-6, ex-cept the grade 6, which was 3. (D-F) The numbers of plaques assessed by a computer-aid image analysis method with acut-off value of 3 pix-els (5.17 μm) in Tg-APP/PS1 mice were plotted over the log scale (y axis). The red line is a genuine ex-ponential increase. The number of plaques exponentially increased over the 0-4 grades.
analysis method. The levels of plaque depositions quantified by the photographic reference panels in the prefrontal cortex and in the piriform cortex in mice at various ages were matched with the logarithmic values of the plaque number assessed by a computer-aid image analysis method (Supplemental Data Figures S3A-S3F). To further revaluate the correlation between the photographic reference system and Aβ levels, Aβ(1-42) and Aβ(1-40) levels determined by ELISA in each mouse were plotted over the 6-grades. The levels of plaque deposition in the piriform cortex of Tg2576 mice scored by the 6-grade photographic reference panels showed a strong correlation with the Aβ(1-42) and Aβ(1-40) levels assessed by ELISA (Supplemental Data Figure S4: for Aβ(1-42), r2= 0.7105 and P < 0.001;
Aβ(1-40), r2= 0.6326 and P < 0.001). We call this
6-grade photographic plaque reference panels “Tg2576 panels” or “plate A”.
Plaque grades scored by the photographic plaque reference panels (plate A) in the second AD mouse model, Tg-APP/PS1mice, were found to have always lower plaque numbers determined by a computer-aid image analysis method than those observed with respective grades in Tg2576 mice. This was in part due to the fact that plaque deposition patterns in the brains of Tg-APP/PS1mice were considerably different from Tg2576 mice: The brains of Tg-APP/PS1 mice were occupied with relatively large plaques, which was contrast to many small plaque deposition patterns in Tg2576 mice. Because
of this difference, measuring plaque levels more accurately in Tg-APP/PS1 mice may require Tg-APP/PS1 mouse type of photographic plaque reference panels. To address this, we prepared another 6-grade photographic plaque reference panels for Tg-APP/PS1 mice by choosing representative plaque reference images for each brain region as did so in Tg2576 mice (Figure 3). For the piriform cortex, the numerical grades of +1, +2, +3, +4, +5, and +6 were chosen to have the plaque number of 36, 72, 132, 251, 414, and 624 per mm2, respectively, so that
the plaque numbers increased sigmoidally over the 6 plaque grades (Figures 4A and 4D), as was so in constructing the Tg2576 panels. Plaque deposition in the prefrontal and parietal cortices of Tg-APP/PS1mice was similarly chosen as the number of plaques increased sigmoidally over the 6 plaque grades (Figures 4B, 4C, 4E and 4F). We now call this new 6-grade photographic plaque reference panels “Tg-APP/PS1 panels” or “plate B”.
To be convinced with the usefulnessof the plate B photographic plaque reference panels, a group of available brain sections of Tg-APP/PS1 mice at various ages were prepared and plaque deposition levels were assessed in a blind manner using the photographic reference method and a computer-aid image analysis method. The levels of plaque deposition quantified by the 6-grade plaque reference in the prefrontal and piriform cortices of Tg-APP/PS1 mice were matched with the logarithmic values of the plaque number assessed by the
498 Exp. Mol. Med. Vol. 44(8), 492-502, 2012
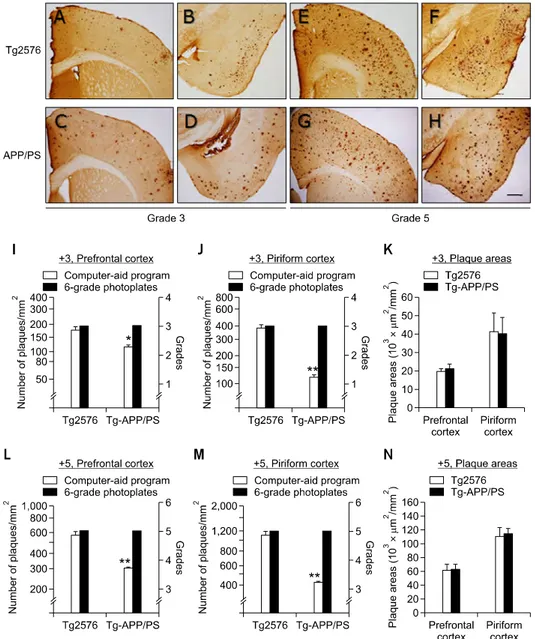
Figure 5. Differential plaque deposition patterns in the brains of Tg2576 and Tg-APP/PS1 mice were analyzed by combined application of the photo-graphic plaque reference panels and a computer-aid image analysis method. (A-H) Photomicrographs showing +3 (A-D) or +5 (E-H) levels of plaque dep-ositions in the prefrontal (A, C, E, G) and piriform (B, D, F, H) cortices of Tg2576 mice (A, B, E, F) and Tg-APP/PS1 mice (C, D, G, H). Tg2576 all were males aged 14.5 months (A, B) or 16 months (E, F). Tg-APP/PS1 mice all were males aged 7.5 months (C, D) or 12 months (G, H). The prefrontal cortex of the panel G is the same as the +5-prefrontal cortex in Figure 3. Scale bar; 500 μm. (I-K) The levels of plaque deposition assessed to be +3 grade (right y-axis) in the prefrontal (I) and piriform (J) cortices of Tg2576 (2576) and Tg-APP/PS1(APP/PS) mice were compared with the numbers of plaques meas-ured by a computer-aid image analysis method (left y-axis). The total plaque areas for the prefrontal and piriform cortices of Tg2576 and Tg-APP/PS1 mice were assessed by a computer-aid method (K). Data are presented as the mean ± SEM. The numbers of animals for each group were 4-5. *P < 0.05; **P < 0.01 (Student’s t-test). (L-N) The levels of plaque deposition assessed as +5 grade (right y-axis) in the prefrontal (L) and piriform (M) cortices of Tg2576 (2576) and Tg-APP/PS1 (APP/PS) mice were compared with the numbers of plaques measured by a computer-aid image analysis method (left y-axis). The total plaque areas for the prefrontal and piriform cortices of Tg2576 and Tg-APP/PS1 mice were assessed by a computer-aid method (N). Data are presented as the mean ± SEM. The numbers of animals for each group were 4-6. **P < 0.01 (Student’s t-test).
computer-aid image analysis method (Supplemental Data Figure S5).
Despite the fact that the photographic plaque reference plates for each grade of Tg2576 (Figure 1) and of Tg-APP/PS1 mice (Figure 3) appeared alike, as described, the plaque number for each
plaque grade assessed by the computer-aid image analysis method in Tg-APP/PS1 mice (Supplemental Data Figures S5A-S5C) was always lower than the same plaque grade in Tg2576 mice (Supplemental Data Figures S3A-S3C). This finding led us to examine the extent of differential plaque deposition
between the two models of AD in detail. The prefrontal and piriform cortices scored with grades of +3.0 were chosen in the two AD models (Figures 5A-5D). The computer-aid image analysis method showed that the average numbers of plaques in Tg2576 mice and Tg-APP/PS1 mice were, respectively, 174.9 and 115.4 per mm2 in the
prefrontal cortex (Figure 5I; P = 0.027), and 376.6 and 132.4 per mm2 in the piriform cortex (Figure 5J; P < 0.01). The area covered by total plaques in
Tg2576 and Tg-APP/PS1 mice were, respectively, 20,207 μm2/mm2 (2.0%) and 21,238 μm2/mm2
(2.1%) in the prefrontal cortex, and 41,823 μm2/mm2
(4.2%) and 40,867 μm2/mm2 (4.1%) in the piriform
cortex (Figure 5K). Thus, the number of plaques in each brain region was different between the two cases, but the areas covered by total plaques between the two models were similar, presumably because fewer but larger plaques were deposited in Tg-APP/PS1 mice, while many small plaques dominated in Tg2576 mice. We performed a similar analysis on the +5.0-grade brain sections of the two AD mouse models (Figures 5E-5H). The average number of plaques in Tg2576 and Tg-APP/PS1 mice was 560 and 291.5 per mm2 in the prefrontal
cortex (Figure 5L; P < 0.01) and 1,098 and 413.5 per mm2 in the piriform cortex, respectively (Figure
5M; P < 0.01). The area covered by total plaques in Tg2576 and Tg-APP/PS1 mice was, respectively, 62,457 μm2/mm2 (6.2%) and 63,094 μm2/mm2 (6.3%)
for the prefrontal cortex, and 111,503 μm2/mm2
(11.2%) and 114,854 μm2/mm2 (11.5%) for the
piriform cortex (Figure 5N). The results of these analyses suggest that the brains of Tg2576 mice were dominated by numerous small plaques, while the brains of Tg-APP/PS1 mice had accumulated relatively large plaques. We speculate that new aggregation of insoluble Aβ is actively formed independent from the existing plaques in the brains of Tg2576 mice, whereas new Aβ aggregation in Tg-APP/PS1 mice preferably occurs on existing plaques.
Discussion
Analytical power and limitations of the photographic plaque-scoring panels in plaque counting
The 6-grade photographic plaque-scoring panels for the plate A (Tg2576 panels) and the plate B (Tg-APP/PS1 panels) were developed to use in assessment of plaque deposition levels in the brains of, respectively, Tg2576 and Tg-APP/PS1 mice. Because of the long history (Hsiao et al., 1996) and easy availability (through Taconic Inc. USA), Tg2576
mice have been one of most popular AD models in the world. Although Tg-APP/PS1 mice were introduced more recently (Jankowsky et al., 2001), this AD model gains another popularity because this model is also easily available (through JAX lab) and amyloid plaque deposition starts as early as 6.5 months of age (Jankowsky et al., 2001, 2003). Therefore, provision of the 6-grade photographic plaque-scoring panels may help people who are working with these AD models.
Using the 6-grade photographic plaque-scoring panels, together with a computer-aid image analysis method, we demonstrated that the brains of Tg2576 mice started to accumulate predominantly small plaques, while the brains of Tg-APP/PS1 mice deposited relatively large plaques. The differential plaque deposition patterns might reflect different Aβ accumulation and/or Aβ clearance rates between the two AD models. Plaque deposition in the brain of Tg2576 mice appears to proceed more slowly than that in Tg-APP/PS1 mice, although direct evidence was not explored in the present study and was not available from the literatures. As demonstrated in the present study, the differential plaque deposition patterns leads us to predict the possibility that anti-plaque effects of any potential drugs or of altered gene activity proven in Tg2576 mice may or may not be reproduced in Tg-APP/PS1 mice depending upon the potency of candidate drugs or on the biological context of altered gene action. Probably the analytical power and the usefulness of the plate A or plate B might not be limited to Tg2576 and Tg-APP/PS1mice. When examined plaque grades of Tg2576 mice and Tg-APP/PS1mice using opposite panels with each other, Tg2576 mice which were scored to +3 and +5 by the plate A in the piriform cortex were graded to, respectively, +3.33 and +5.27 by the plate B, while Tg-APP/PS1 mice which were scored to +3 and +5 were graded to, respectively, +2.73 and +4.83 by the plate A. Similarly, in the prefrontal cortex, Tg2576 mice scored to +3 and +5 were graded to, respectively, +3.38 and +5.23 by the plate B, while Tg-APP/PS1 mice scored to +3 and +5 were graded to, respectively, +2.83 and +4.90 by the plate A. Thus, the plate A (Tg2576 panels) has a property that slightly lowers plaque grades when applied to plaque patterns in Tg-APP/PS1mice, while the plate B (Tg-APP/PS1 panels) has a property that slightly raises plaque grades when applied to plaque patterns in Tg2576 mice.
We speculate that this upward- or downward- grading property of the plate A and plate B is in part due to that the reference panels were chosen to reflect the nature of differential plaque depositions in each mouse model. In fact, in the piriform cortex of
500 Exp. Mol. Med. Vol. 44(8), 492-502, 2012
Tg2576 mice that were scored to +5 by the plate A, 37% of the total plaques were within 5.17-7.31 μm in size (Figures 1 and 2). Similarly, in the piriform cortex of Tg-APP/PS1 mice scored to +5 by the plate B, 22% of the total plaques were within the range of 5.17-7.31 μm in size (Figures 3 and 4). The plaques with 5.17-7.31 μm in size were not usually visible as dots on low-powered photomicrographs generated by a normal light microscope or on the photographic reference panels, although they made the stained sections slightly darker in a gross image level. We do not exclude the possibility that certain AD mouse models may require to develop third type panels for better estimation, particularly when precise plaque number transformation is required. Nonetheless, this analysis suggests also that the analytical power and the usefulness of the plate A or plate B might not be limited to Tg2576 and Tg-APP/ PS1 mice, when plaque number transformation is not essential. It may be worthy of noting that computer-aid image analysis methods are more versatile than the photographic reference panel, but it does not mean that computer-aid image analysis methods are superior to the photographic reference panels in all aspects. As demonstrated with digitalized plaques in the piriform cortex (Supplemental Data Figures S2H-S2J), the number of plaques assessed in a given brain region using a computer-aid image analysis method varied depending upon the cut-off value of pixel size and staining intensity of plaques in brain sections.
Features of the 6-grade photographic plaque reference method
In the present study, we came to present two sets of the 6-grade photographic plaque-scoring panels, which allowed us to compare plaque deposition levels in the brains of Tg2576 mice to those in Tg-APP/PS1 mice. The 6-grade photographic plaque reference method is a semi-quantitative rating system that was based on the transformation of logarithmic values of the number of plaques within mm2 into simple numerical figures, with an
emphasis to inspect the levels with low numbers in more detail than those with high numbers. This 6-grade photographic reference method has the following valuable features.
First, this method is easy to use. It is good for all levels of users who may or may not be experts in plaque pathology. Second, this method is fast and helps users determine plaque levels almost instantly. Using this method in a blind manner by more than two experimenters, one can expect unbiased quantitative data, which may be used as a complementary method to, or an independent
method from, a typical computer-aid method or others. Regarding that plaque counting methods, including a computer-aid image analysis system, are mostly painstaking and are using a tedious and time-consuming process, the 6-grade photographic reference method has a considerable merit in its simplicity. Third, this method will be good for users who are not able to access to sophisticated image analysis equipment on a daily basis. Fourth, this method can be used to generate both quantitative and qualitative data. As indicated in the Introduction section, certain brain sections may have a physical damage in the tissue preparation process in the regions of interest, but stained brain sections may retain sufficient information, or contain abnormally dense histologically stained spots interfering with automatic image quantification. In such cases, use of the 6-grade photographic reference method may be free of this type of conflicts.
In conclusion, the significance of the present study is twofold. First, we systematically compared differential plaque depositions in the brains of two different AD models and demonstrated that the brains of Tg2576 mice started to accumulate predominantly small plaques, while Tg-APPswe/ PS1dE9 mice deposited relatively large plaques. Second, we provided two 6-grade photographic plaque reference panels; the plate A can be used for Tg2576 mice or transgenic mice showing Tg2576-like plaque deposition patterns (high numbers with small plaques), while the plate B can be used for Tg-APP/ PS1mice or transgenic mice showing Tg-APP/PS1-like plaque deposition patterns (low numbers with large plaques). The 6-grade photographic plaque reference method may serve as a supplementary, or an alternative method, to existing plaque-scoring methods. Because the photographic plaque scoring panels can serve as a transformed reference in plaque quantification, this method may provide quantitative and qualitative data in the brains of Tg2576 and Tg-APP/PS1 mice. We speculate that this method will be proven powerful, particularly when a large scale analysis of plaque deposition needs to be analyzed.
Methods
Animals
Tg2576 mice carrying human mutated APP (K670M/N671L) and Tg-APPswe/PS1dE9 transgenic mice were maintained in C57BL6 × SJL F1 hybrid and C57BL6 × C3H F1 hy-brids, respectively, as described previously (Hsiaoet al., 1996; Jankowsky et al., 2001; Lee et al., 2009; Seo et al., 2011). Female transgenic mice were housed 2-3 animals per cage, while male transgenic mice were housed in pairs with a non-transgenic female in normal plastic cages with
free access to food and water in a temperature- and hu-midity-controlled specific pathogen-free environment under a 12 h light/dark cycle (lights on at 7 a.m.). All animals were handled in accordance with the animal care guide-lines of Ewha Womans University School of Medicine.
ELISA of Aβ levels
ELISA for Aβ(1-42) and Aβ(1-40) levels was described in previous studies (Lee et al., 2009; Seo et al., 2011). Briefly, the piriform cortex was homogenized in Tris-buffered saline [20 mM Tris and 137 mM NaCl (pH 7.6)] in the presence of protease inhibitor mixtures (Complete Mini; Roche, IN). Homogenates were centrifuged at 100,000 × g for 1 h at 4oC, and the supernatant was used to measure the levels
of Tris buffer-soluble forms of Aβ(1-40) and Aβ(1-42). The pellet was sonicated in 70% formic acid and centrifuged as above, and the supernatant was collected. The formic acid extract was collected, and neutralized with 1 M Tris-Cl buf-fer (pH 11) at 1:20 dilution. The final assays were per-formed using Human β-Amyloid Aβ(1-40) or Aβ(1-42) Colorimetric Sandwich ELISA kits (BioSource, Camarillo, CA), according to the manufacturer's instructions.
Immunohistochemical works
Transgenic mice were sacrificed and perfused with 0.9% saline. The brains were removed and post-fixed with 4% paraformaldehyde in 0.1 M phosphate buffer (pH 7.4) at 4°C overnight. The brains were coronally-cut into 40 μm-thick sections with a vibratome (Leica VT 1000S; Leica Instruments, Nussloch, Germany). Free-floating sections were incubated with 4% bovine serum albumin in PBS for 1 h, then reacted with monoclonal anti-β-amyloid protein antibody (Bam10) at 4°C overnight. The monoclonal anti-body Bam-10 recognizes the epitope for the N-terminus (1-12 amino acid residues) of Aβ(1-42) and Aβ(1-40), and specifically stains amyloid plaques within the cortex of hu-man AD brains (Sigma Aldrich, A5213;St. Louis, MO), and amyloid plaques in the brains of AD mouse models (Lee et
al., 2009; Seo et al., 2011). The sections were washed with
PBS and reacted with biotinylated secondary antibodies di-luted 1:200 in PBS and visualized using ABC Elite kit (Vector Laboratories, Burlingame, CA).
Microscopic works and image analyses
Microscopic observations were carried out using an Oympus BX 51 microscope mounted with a DP71 camera and DP-B software (Olympus Co., Tokyo, Japan). Anti-Aβ antibody (Bam-10)-stained prefrontal, parietal, and piriform cortices were captured and analyzed. The smallest plaque size that was countable with certainty on light microscopic images was ~5 μm, thus plaques with a size less than 5 μm and diffusible plaques were not considered. For quanti-fication of plaque levels using a computer-aid automatic plaque counting method, the captured optical images of plaques were labeled with a digitalized pseudo-color and the number of plaques or the total area of plaques was measured by the TOMORO ScopeEye 3.6 program (Techsan Community, Seoul, Korea). The plaque number
per unit in mm2 or total plaque surface areas on brain
sec-tions is presented. For quantification of plaque levels using the 6-grade plaque reference method, plaque deposition levels were assigned with a numerical grade of 1-6 scales, where +1 was lowest and +6, highest. After counting pla-que numbers using a computer-aid image analysis meth-od, several dozens of brain sections were grouped in 6 dif-ferential plaque levels. The representative plaque deposi-tion levels for the numerical grades of +1, +2, +3, +4, +5, and +6 in each brain region were chosen that the plaque number per unit in mm2 increased “exponentially” over the
interval between grades 1-4, then in a slightly reduced rate over grades 5 and 6. Such “sigmoidal” increase allows that the referenced plaque grades carry quantitative information on plaque levels and plaque grades can be expressed by an average. Because each grade represents a discrete level of plaque deposition, when necessary, intermediate grade, such as 0.5-increment between each grade interval, was applied.
Statistical analysis
Data were analyzed using GraphPad Prism 4 (GraphPad Software, San Diego, CA). All data are presented as mean ±SEM and statistical difference was accepted at the 5% level.
Supplemental data
Supplemental data include five figures and can be found with this article online at http://e-emm.or.kr/article/article_files/ SP-44-8-04.pdf.
Acknowledgements
This work was supported by a grant (B070030) from the Korean Health R&D project from the Ministry of Health and Welfare, a grant (RO1-2006-000-10771-0) from Basic Research Program of the Korea Science and Engineering Foundation of the Ministry of Science and Technology, and a grant (2012R1A2A1A03010177) by National Research Foundation, the Ministry of Education, Science and Technology, Republic of Korea.
References
Bacher M, Dodel R, Aljabari B, Keyvani K, Marambaud P, Kayed R, Glabe C, Goertz N, Hoppmann A, Sachser N, Klotsche J, Schnell S, Lewejohann L, Al-Abed Y. CNI-1493 inhibits Abeta production, plaque formation, and cognitive deterioration in an animal model of Alzheimer's disease. J Exp Med 2008;205:1593-9
Benzing WC, Wujek JR, Ward EK, Shaffer D, Ashe KH, Younkin SG, Brunden KR. Evidence for glial mediated inflammation in aged APPsw transgenic mice. Neurobiol Aging 1999;20:581-9
Flood DG, Reaume AG, Dorfman KS, Lin YG, Lang DM, Trusko SP, Savage MJ, Annaert WG, De Strooper B, Siman R, Scott RW. FAD mutant PS-1 gene-targeted mice:
502 Exp. Mol. Med. Vol. 44(8), 492-502, 2012
increased Abeta 42 and Abeta deposition without APP overproduction. Neurobiol Aging 2002;23:335-48
Ho A, Liu X, Südhof TC. Deletion of Mint proteins decreases amyloid production in transgenic mouse models of Alzheimer's disease. J Neurosci 2008;28:14392-400 Hsiao K, Chapman P, Nilsen S, Eckman C, Harigaya Y, YounkinS, Yang F, Cole G. Correlative memory deficits, Abeta elevation, and amyloid plaques in transgenic mice. Science 1996;274:99-102
Jankowsky JL, Slunt HH, Ratovitski T, Jenkins NA, Copeland NG, Borchelt DR. Co-expression of multiple transgenes in mouse CNS: a comparison of strategies. Biomol Eng 2001; 17:157-65
Jankowsky JL, Xu G, Fromholt D, Gonzales V, Borchelt DR. Environmental enrichment exacerbates amyloid plaque formation in a transgenic mouse model of Alzheimer disease. J Neuropathol Exp Neurol 2003;62:1220-7
Kawarabayashi T, Younkin LH, Saido TC, Shoji M, Ashe KH, Younkin SG. Age-dependent changes in brain, CSF, and plasma amyloid (beta) protein in the Tg2576 transgenic
mouse model of Alzheimer’s disease. J Neurosci 2001;21: 372-81
Lee KW, Kim JB, Seo JS, Kim TK, Im JY, Baek IS, Kim KS, Lee JK, Han PL. Behavioral stress accelerates plaque pathogenesis in the brain of Tg2576 mice via generation of metabolic oxidative stress. J Neurochem 2009;108:165-75 Lim GP, Yang F, Chu T, Chen P, Beech W, Teter B, Tran T, Ubeda O, Ashe KH, Frautschy SA, Cole GM. Ibuprofen suppresses plaque pathology and inflammation in a mouse model for Alzheimer's disease. J Neurosci 2000;20:5709-14 Seo JS, Kim TK, Leem YH, Lee KW, Park SK, Baek IS, Kim KS, Im GJ, Lee SM, Park YH, Han PL. SK-PC-B70M confers anti-oxidant activity and reduces Abeta levels in the brain of Tg2576 mice. Brain Res 2009;1261:100-8
Seo JS, Lee KW, Kim TK, Baek IS, Im JY, Han PL. Behavioral stress causes mitochondrial dysfunction via ABAD up- regulation and aggravates plaque pathology in the brain of a mouse model of Alzheimer disease. Free Radic Biol Med 2011;50:1526-35