EVALUATION OF SHEAR BEHAVIOR OF LARGE GRANULAR MATERIALS WITH
DIFFERENT PARTICLE SIZES BY TRIAXIAL TEST AND NUMERICAL SIMULATION
BUMJOO KIMi) and MYUNG SAGONGii)
ABSTRACT
Rockfill zones in CFRD consist typically of large granular materials, usually the maximum particle size up to several meters, which makes laboratory testing to determine the mechanical properties of rockfill difficult. Commonly, the design strength of the rockfills is obtained by scaling down the original rockfill materials and performing laboratory strength tests for the reduced size materials. The objective of the present study is to investigate the effect of particle size on the shear behavior and the strength for granular materials. A series of large-scale triaxial tests was conducted on large granular materials with the maximum particle size varying from 20 to 50mm. The test results showed that overall shear behaviors were similar between the samples with different particle sizes while there were slight differences in the magnitudes of the peak shear stress between the samples. In addition, a simulation of the granular material with the max. particle size of 20mm was performed using DEM code, PFC2D, and compared with the test results. The deviatoric stress versus strain behaviors of experimental and numerical tests were found to be matched well up to the peak stress state.
Key Words : CFRD, Granular material, Particle size, Large-scale triaxial test, PFC 1 INTRODUCTION
1.1 Background
The concrete-faced rockfill dam (CFRD) has been used in many parts of the world with increasing frequency in recent years. In addition to being a natural choice where suitable clayey core material is not available in the vicinity of the project, the CFRD has in many cases been found to be the least-cost alternative. At present, CFRD is often the preferred choice for dam engineers in Korea.
The typical zoning of a CFRD is shown in Figure 1.
Figure 1. Zone designations for CFRD of sound rockfill (Cooke and Sherard 1987).
Zone 1 is impervious zone. Zone 2 is the filter or transition zone directly under the concrete slab. Zone 3A, 3B, and 3C are the rockfill zones, and are distinguished by the maximum layer thickness and maximum particle size allowed.
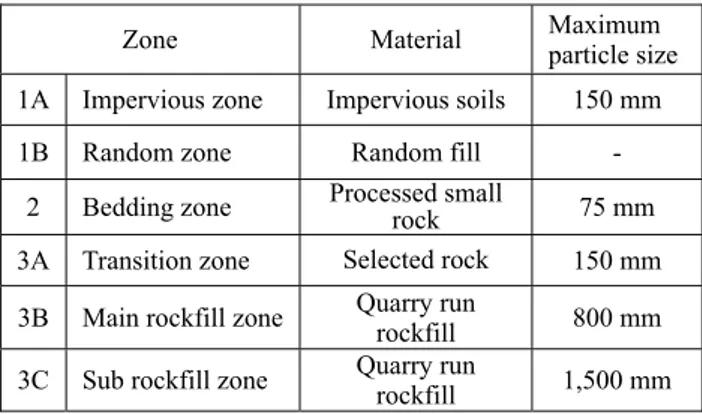
As shown in Table 1, the large particles within the rockfill (usually up to 800mm for Zone 3B, 1,500mm up to Zone 3C), make laboratory testing to determine the mechanical properties of rockfill difficult. Therefore, it is usual to determine the design strength of the rockfill zones by scaling down the original rockfill materials and performing laboratory strength tests for the reduced size materials.
Table 1. Typical zone materials for CFRD in Korea
Zone Material Maximum particle size
1A Impervious zone Impervious soils 150 mm
1B Random zone Random fill -
2 Bedding zone Processed small rock 75 mm
3A Transition zone Selected rock 150 mm
3B Main rockfill zone Quarry run rockfill 800 mm
3C Sub rockfill zone Quarry run rockfill 1,500 mm
Currently in Korea, the parallel grading method is the most commonly used to make the reduced samples
i) Assist. Prof., Dept. of Civil and Environ. Sys. Engrg., Dongguk University, Seoul, Korea.
for laboratory tests. For granular materials, however, different particle sizes may lead to different mechanical behaviors. Although several studies have reported the effects of the particle size on the mechanical behavior of rockfill material, the results tend to be inconsistent from study to study(Marachi et al. 1972; Marsal 1967), and still need further investigations.
1.2 Methodology
In this study, a series of large-scale triaxial tests was conducted on large granular materials to investigate the effect of particle size on the shear behavior. The granular materials used for the tests were obtained from a CFRD construction site in Korea. A comparison was made on three different particle sizes - 20, 30, and 50mm in the maximum size. In order to examine the particle size effect only, the specimens were all prepared to be the same conditions except the particle sizes (i.e., the same parent rock type, the same density, and the same gradation curve shape). In addition, a numerical analysis using PFC2D code was performed to simulate the stress-stain behavior of a granular material and compared with the test results.
2 LARGE-SCALE TRIAXIAL TEST 2.1 Testing material and method
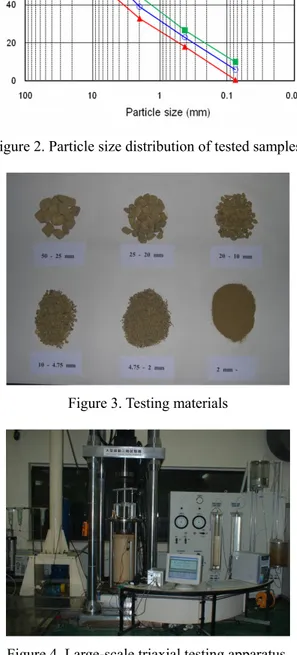
The granular material samples for the large-scale triaxial tests were obtained from OO CFR dam construction site in Gyungsangbukdo, Korea. Table 2 shows the basic properties of the samples. The particle size distributions of the triaxial test samples were pre-determined to have the same uniformity coefficient (i.e., Uc=60) and the coefficient of gradation (i.e., Ug =
1.0) but different particle sizes, as shown in Figure 2. Figure 3 displays the granular particles classified by the size to prepare a test specimen.
Table 2. Basic properties of testing material Parent rock type Granite Specific gravity 2.49 Water absorption ratio 2.86% Resistance to abrasion 23%
The isotropically consolidated-drained(CD) triaxial tests were performed on the granular materials with different particle sizes to investigate the stress-strain and volumetric behaviors under shearing and to determine the shear strength. The equipment used in the test was the large-scale triaxial testing system, owned by Korea Water Resources Corporation (Figure. 4). It was designed to test a sample as large as 300mm in diameter and 620mm in height. The testing apparatus uses an electro-hydraulic servo control system. The test
is computer-controlled, and digital data of stress-strain and volume change are recorded automatically by a digital data acquisition system.
Figure 2. Particle size distribution of tested samples.
Figure 3. Testing materials
Figure 4. Large-scale triaxial testing apparatus. The sample made to have a desired particle size distribution was then compacted in five layers in the split mold, designed to compact a large sample for the large scale triaxial test, using the compaction rammer of the automatic compaction apparatus. To achieve a desired density of the specimen, blows per layer were determined by several trials. Following the compaction, the specimen was set up in the triaxial apparatus. Upon completion of the saturation, the specimen was
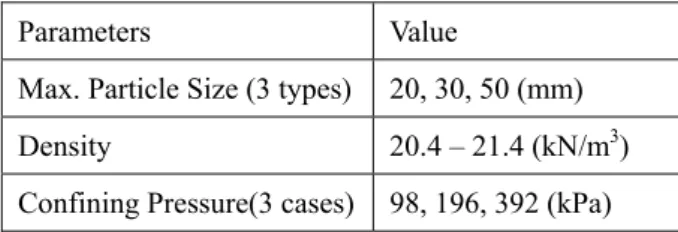
isotropically consolidated by applying a desired effective confining stress. Triaxial compression (shearing) was performed on the saturated specimen previously consolidated to a given effective confining stress under a strain-controlled condition in the strain rate of 3 mm/min. Three levels of confining pressure were employed for the evaluation of the triaxial behavior of the specimen with the specific particle size distribution. Table 3 shows the triaxial test conditions. Table 3. Triaxial test conditions
Parameters Value Max. Particle Size (3 types) 20, 30, 50 (mm)
Density 20.4 – 21.4 (kN/m3)
Confining Pressure(3 cases) 98, 196, 392 (kPa)
2.2 Test results
Figure 5 shows the stress-strain and volume change behaviors of the granular samples with the max. particle size of 20mm, sheared in triaxial compression at three different confining stresses (i.e., σ´3 = 98, 196, and 392
kPa) under drained conditions. The shear behavior typically resembled that of sandy soils in medium to dense conditions. Increases in the deviatoric stress (σ´d) were associated with a slight initial volumetric
contraction, followed by a gradually increasing rate of volume expansion (dilation). The peak strength occurred when the rate of change of the volumetric strain with respect to the axial strain (dεv/dεa) reached
its maximum value. The post-peak reduction in σ´d is
associated with a decreased rate of dilation until the stress state reaches the critical state with constant stress and volume. Dilation decreased gradually with increasing σ´3.
Figure 6 displays the stress-strain and volume change behaviors of the granular samples with different particle sizes (i.e., the max. particle size of 20, 30, and 50mm, respectively) sheared at the confining stress of 196 kPa.
(a) Deviatoric stress vs. axial strain
(b) Volumetric strain vs. axial strain
Figure 5. Shear behavior of the specimens with the max. particle size of 20mm under three levels of confining
pressure
(a) Deviatoric stress vs. axial strain
(b) Volumetric strain vs. axial strain
Figure 6. Shear behavior of the specimens with different particle sizes under the confining pressure of 196 kPa
The overall shear behaviors were similar between the samples with different particle sizes. However, there were slight differences in the magnitudes of the peak shear stress between the samples. The highest peak shear stress was found for the sample with the max. particle size of 20mm, and the lowest for the max.
particle size of 50mm. The tendency for dilation decreased slightly with the increased particle sizes.
The peak friction angle can be expressed in terms of the principal effective stresses at peak state based on the Mohr-Coulomb failure criterion with zero cohesion intercept as follows: peak p ⎟⎟ ⎟ ⎟ ⎟ ⎠ ⎞ ⎜⎜ ⎜ ⎜ ⎜ ⎝ ⎛ + ′ ′ − ′ ′ = ′ 1 1 sin 3 1 3 1 σ σ σ σ φ (1)
Figure 7 represents the peak friction angles obtained from Equation (1) for all the tested samples. The values of the peak friction angle averaged over the three confining pressure levels were found to be decreased by about 1° as the max. particle size in the samples increased from 20 to 30, and 50mm, respectively.
Figure 7. Peak friction angle vs. particle size
3. NUMERICAL ANALYSIS OF A LARGE GRANULAR MATERIAL
Under the certain level of deviatoric stress, granular materials like sand or gravel materials can exhibit individual displacement, rotation, and deformation of the particles. Among other methods of computation, discrete element modeling (DEM) would be one of a method to simulate the behaviors of the individual particles. Especially the DEM based program, Particle Flow Code (PFC), can simulate displacement and rotation of discrete bodies and generation of new contacts with detachment of the particles. Several studies has been conducted to investigate the mechanical behaviors of granular materials under static and cyclic loads (Yan, et al. 2009, Ravichandran, et al. , 2010). In this paper, simulation of large size granular was conducted using PFC2D. The following is the detailed results of model generation and simulation results.
3.1 Generation of numerical model
In section 2, three types of granular material have been tested: specimens with different particle size distributions and maximum particle sizes of 20, 30, and 50 mm. Due to the limitation of the paper length, numerical results of the specimen with maximum particle of 20 mm will be presented in this section.
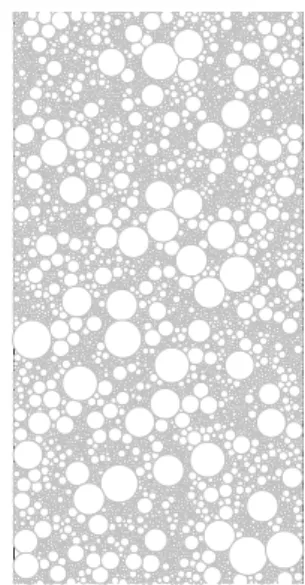
Initially, generation of the specimen was carried out following the given particle size distribution tested. A specially coded FISH function generates the given particle size distribution. Figure 8 displays the numerical model following the particle size distribution of maximum particle size of 20 mm. Figure 9 shows a comparison between the particle size distribution of the experimental and numerical analyses.
Figure 8. Generated numerical model employing the particle size distribution with maximum particle size of 20
mm
Figure 9. A comparison between the particle size distribution of experimental and numerical analyses Generation of specimen undergoes initial isotropic packing process of frictionless assembly of the particles. Next, density scaling follows to control the computation time steps. The density scaling process is required when the variation of particle size is large. After isotropic packing, the same magnitude of confining stress is applied and then quasi-static axial
load is applied following servo controlled numerical scheme.
3.2 Calibration of micro-parameters
The constitutive behaviors of the specimen are controlled by contact model in PFC. Several contact models are provided in the code. In this study, simulation of the large granular material employs the contact bond. A contact bond can be envisioned as a pair of elastic springs with specified normal and shear strength acting at various contact points. Hence the behaviors of contact bond are controlled by two parameters: normal and shear strength. The feature of contact model is that the both the normal and shear contact forces are set to zero when the tensile normal contact force equals or exceeds the normal contact bond strength.
Following the trial-and-error method, calibration of micro-parameters, normal and shear contact strength, are tuned to simulate the experimental results as shown in Figure. 5. From the trial-and error process, the particle parameters and micro-parameters applied for the simulation are shown in Table 4.
Table 4. Ball and micro-parameters used.
Micro-parameter Value Maximum particle size (mm) 20. 30. 50
Density (kg/m3) 2140
Contact modulus (Pa) 6.0×10⁷ Normal and shear strength (N)
(confining stress = 98 kPa) 0.07×10
6
Normal and shear strength (N)
(confining stress = 196 kPa) 0.25×10
6
Normal and shear strength (N)
(confining stress = 392 kPa) 0.34×10
6
The stress- strain behaviors of the numerical model with the micro-parameter in Table 4 are shown in Figure 10.
Figure 10. A comparison between experimental and numerical analyses for the large granular material with maximum particle size of 20 mm under different confining
stress conditions (98, 196, 392 kPa)
Up to the peak state of the material, a comparison between the numerical and experimental test is shown in Figure 12. Overall behaviors of deviatoric stress versus axial strain match well with each others. However, the global behaviors of the granular material compared in Figure 10 are derived from varying micro-parameters with confining stresses, which means that the built-in contact bond model in PFC does not proper simulate the confining stress dependent behaviors of granular materials. Since the normal and shear strength defined in Table 4 are not confining stress dependent parameters and the model does not reflect the confining stress effect, a user defined contact model has to be developed. The variation of micro-parameter and confining stress is linear.
-0.1 -0.05 0 0.05 0.1 0.1 -0.25 -0.2 -0.15 -0.1 -0.05 0 0.05 0.1 0.15 0.2 0.25 X-axis [m] Y -axi s [ m ] -0.1 -0.05 0 0.05 0.1 0.1 -0.25 -0.2 -0.15 -0.1 -0.05 0 0.05 0.1 0.15 0.2 0.25 X-axis [m] Y -axi s [ m ] (a) (b)
Figure 11. Ball displacement vectors at the peak state with confining stress of 98 (a), and 392 kPa(b) Figure 11 shows displacement vectors at the peak deviatoric stress state under confining stress of 98 and 196kPa. The ball displacements greater than 6 mm (1% of specimen height) are plotted in the figure. It can be tell from the figure that major ball displacement occurs at the lateral side due to the boundary effect. In addition from the figure bulging is the major type of failure under the tested confining stress condition.
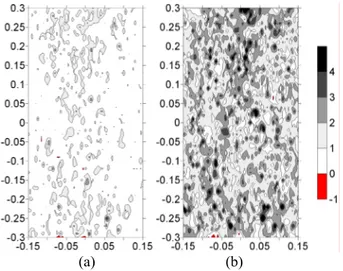
(a) (b)
Figure 12. Major principal stress (σ1) at the peak state
Figure 12 demonstrates the major principal stress (σ1) at the peak state with confining stress of 98 and
392 KPa. Due to the confinement, overall distribution of σ1 increases with confining stress. In addition at low
confining stress, σ1 concentrates at the upper and lower
ends and the central part of the specimen. Even with increase of confinement, the zone of increased σ1 is
enlarged but the major stress difference at the central and lateral sides are still visible.
4 CONCLUSION
The large-scale triaxial test results showed that the overall shear behaviors were similar between the granular samples with different the max. particle sizes while there were slight differences in the magnitudes of the peak shear stress between the samples. The highest peak shear stress was found for the sample with the max. particle size of 20mm, and the lowest for the max. particle size of 50mm. The tendency for dilation decreased slightly with the increased particle sizes. The values of the peak friction angle averaged over the three confining pressure levels were found to be decreased by about 1° as the max. particle size in the samples increased from 20 to 30, and 50mm, respectively.
Experimental results have been simulated by using DEM code, PFC2D. Deviatoric stress versus strain behaviors of experimental and numerical tests matched well up to the peak stress state. However, since the micro-parameters have been increased with confinement, a user defined contact bond model has to be developed to explain the confinement effects of granular materials. From the ball displacement vector analysis, bulging type failure occurred from the three different confining stress level tested. Major principal stress distribution supported the bulging failure.
The analysis made in the paper has some limitations such as mismatch of dimension, particle breakage phenomenon, contact features between 2D and 3D, and out-of-plane stresses. Nevertheless, the micro scale behaviors of particle can be interpreted from the interpretation.
ACKNOWLEDGEMENT
The authors would like to acknowledge the Korea Water Resources Corporation for financial support.
REFERENCES
1) Strength and Compressibility of Gravelfill Material, (2005):
Korea Water Resources Corporation, KIWE-DRC-05-3, Final
Report, 142p. (in Korean).
2) Marachi, N.D., Seed, H.B. and Chan, C.K. (1972): “Evaluation of properties of rockfill materials”, J. Soil Mech.
Found. Div., ASCE, Vol. 98, No. SM1, pp. 95-114.
3) Marsal, RJ. (1967): “Large scale testing of rockfill materials,”
J. of Soil Mech. And Found. Div., ASCE, Vol. 93, No. SM2,
pp. 27-43.
4) Cooke, J. B. and Sherard, J.L. (1987): ‘‘Concrete-Face Rockfill Dam: II. Design.’’ Journal of Geotechnical
Engineering, ASCE, Vol.113, No.10, pp. 1113-1132
5) Ravichandran, N., Machmer, B., Krishnapillai, H., and Meguro, K. (2010): “Micor-scale modeling of saturated sandy soil behavior subjected to cyclic loading” Soil Dynamics and Earthquake Engineering Vol. 30, No, 11, pp.1212-1225.
6) Yan, G., Hai-sui, Y., and Glenn, M. (2009): “Simulation of granular material behavior using DEM” Procedia Earth and Planetary Science 1 Vol 1, No 1, pp. 598-605.