Genetic expressions alteration affect on
lateral neck node metastasis of thyroid
papillary microcarcinoma
Sohee Lee
Department of Medicine
Genetic expressions alteration affect on
lateral neck node metastasis of thyroid
papillary microcarcinoma
Directed by Professor Woong Youn Chung
The Doctoral Dissertation
Submitted to the Department of Medicine,
the Graduate School of Yonsei University
in partial fulfillment of the requirements for the degree
of
Doctor of Philosophy
Sohee Lee
ACKNOWLEDGEMENTS
The writing of this dissertation has been one of the most
significant challenges I have ever had to face. Without the
support, patience and guidance of the following people, this
study would not have been completed.
Foremost, I would like to express my sincere gratitude to Prof.
Woong Youn Chung for the continuous support of my career
and research. His guidance helped me throughout time spent in
research and writing of this thesis. I could not have imagined
having a better advisor and mentor for my career and Ph.D
study. Also I would like to thank the rest of my thesis
committee: Profs. Eun Jig Lee, Namhoon Cho, Jae Bok Lee,
and Youn Woo Koh, for their insightful comments and
encouragement.
I appreciate the advice and insightful encouragement of my
colleagues and friends, especially Sang-Wook Kang and Cho
Rok Lee. I am grateful to Su-Jin Park, Yoo Min Kim, and
Youngju Hong, who squeezed time from their busy schedules
to cheer me up.
I would like to thank my family for supporting me spiritually
throughout my life, especially my older sister, who is my best
friend, advisor, guide, and mentor. I hope my beloved mother
in heaven will be proud of this work. I am thankful to my
mother- and father-in-law for their support, patience, and
helping to take care of my family. I also thank to the nanny
who has cared for my daughter with heart.
Finally, and most importantly, I would like to thank my
husband and daughter. My husband gave me enormous
emotional support and love inspite of his own heavy work
pressures, and he has given me the freedom to pursue various
projects without objection. Without his support and patience,
this study would not have been completed. My beloved
daughter spent many days with her nanny to allow me to focus
on my work, I am deeply sorry for the time we spent apart, and
I will always be thankful to her just for being who she is.
June, 2014
Sohee Lee
<TABLE OF CONTENTS>
ABSTRACT ··· 1
I. INTRODUCTION ··· 4
II. MATERIALS AND METHODS ··· 5
1. Micaroarray analysis ··· 5
A. Tissue samples ··· 6
B. Extraction of RNA from tissue samples ··· 6
C. Oligonucleotide Microarray ··· 7
2.
BRAFV600E mutation Analysis by PNA Clamp Real-time PCR ··· 93. Real-time quantitative PCR ··· 10
4. Western blotting ··· 11
5. Immunohistochemistry ··· 12
III. RESULTS ··· 13
IV. DISCUSSION ··· 38
V. CONCLUSION ··· 43
REFERENCES ··· 44
ABSTRACT(IN KOREAN) ··· 53
LIST OF FIGURES
Figure 1. Hierarchial cluster analysis of DEGs between papillary
thyroid microcarcinoma and normal thyroid tissues ··· 14
Figure 2. Molecular characteristics of differentially expressed
genes between normal thyroid and papillary thyroid
microcarcinoma(PTMC) tissues ··· 17
Figure 3. Hierarchial cluster analysis of DEGs between N0 and
N1b PTMC ··· 22
Figure 4. Molecular characteristics of differentially expressed
genes between PTMC with lateral neck node metastasis and
PTMC without node metastasis ··· 24
Figure 5. Validation of microarray-based gene expression by
quantitative real time PCR ··· 33
Figure 6. Validation of microarray-based gene expression by
Western blotting ··· 35
LIST OF TABLES
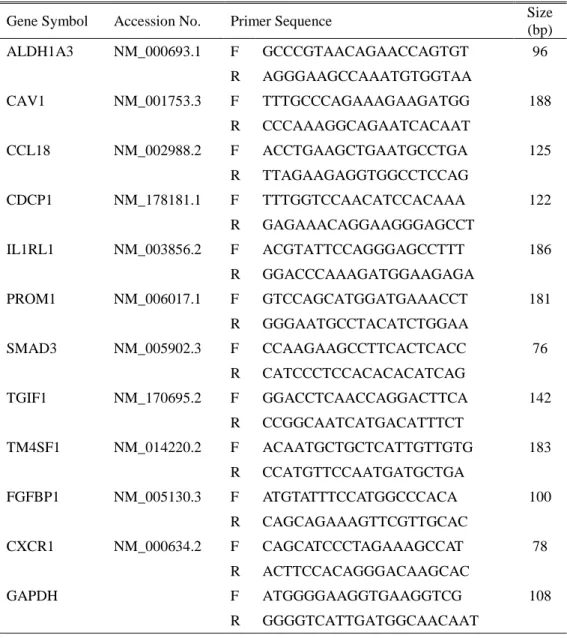
Table 1. The gene specific primer of interest genes ··· 10
Table 2. Clinicopathologic characteristics of 8 papillary
thyroid microcarcinoma patients ··· 15
Table 3. Analysis of Differentially expressed genes between
tissues according to gene ontology ··· 19
Table 4. Analysis of Differentially expressed genes between
PTMC with lateral neck node metastasis and PTMC without
node metastasis according to gene ontology ··· 26
Table 5. EMT and stem cell marker-related gene expression in
PTMC with lateral neck node metastasis versus without node
metastasis ··· 34
Table 6. Clinicopathologic charateristics and IHC results of 44
1
ABSTRACT
Genetic expressions alteration affect on lateral neck node metastasis of
thyroid papillary microcarcinoma
Sohee Lee
Department of Medicine
The Graduate School, Yonsei University
(Directed by Professor Woong Youn Chung)
BackgroundPapillary thyroid cancer has a mild biological behavior, and especially the papillary thyroid microcarcinoma(PTMC) shows a very favorable prognosis. Cervical lymph node metastasis of PTMC is the most significant prognostic factor for locoregional recurrences. In this study, we compared gene expression patterns of PTMC associated with lateral neck-node metastasis versus PTMC lacking such metastasis, and we validated the functional evidences of over- or under-expressed genes sets that correlated with early extensive lymph-node metastasis.
Methods and materials
We performed oligonucleotide microarray analysis using Illumina HumanHT-12 v4.0 Expression Beadchip in eight PTMCs and paired normal thyroid tissues. Of these, three were PTMC without cervical lymph-node metastases (N0), and the others were PTMC with lateral neck-node metastasis (N1b) at initial diagnosis. Statistical significance of the differentially expressed genes was determined using independent T-test with two-sided p<0.05 and median-fold
2
change cut-off of >1.5. Quantitative real-time PCR, Western blot analysis, and immunohistochemistry were used to confirm the microarray data.
Results
Microarray analyses identified 146 probes corresponding to 131 genes whose expression differed significantly between the two PTMC groups. Significant upregulation was seen in 107 genes, and 24 genes showed downregulation in N1b PTMC when compared with N0. Differential gene expression analyzed by gene ontology profile implicated biological processes of signaling, multicellular organism processes, responses to stimuli, developmental processes, cell proliferation, death, locomotion, and biological regulation. Genes that are related to epithelial-to-mesenchymal transition (EMT) and stem-cell markers were significantly upregulated in N1b PTMCs. Quantitative real-time PCR of expression of genes including IL1RL1, ALDH1A3, FGFBP1, TM4SF1, PROM1, CAV1, CCL18, TGIF1, SMAD3, and CDCP1 confirmed the data from microarray hybridization. Results of Western blot analysis confirmed that expression of CAV1, TM4SF1, and IL1RL1 was increased in N1b relative to N0 PTMCs. Immunohistochemical studies indicated that ALDH1A3 and CAV1 were more frequently expressed in N1b than N0 PTMCs.
Conclusions
Genes that play a role in EMT and thyroid cancer stem-cell-like properties are upregulated in early extensive lymphatic spread of PTMC.
3
---
Key words: thyroid papillary microcarcinoma, lateral neck-node
metastasis, genetic expression, microarray
4
Genetic expressions alteration affect on lateral neck node metastasis of
thyroid papillary microcarcinoma
Sohee Lee
Department of Medicine
The Graduate School, Yonsei University
(Directed by Professor Woong Youn Chung)
I. INTRODUCTION
Papillary thyroid cancer (PTC) is the most common malignant thyroid tumor, representing 8590% of thyroid malignancy.1 Papillary thyroid cancer has a mild biological behavior, and especially the papillary thyroid microcarcinoma (PTMC) which is defined as PTC with a size of ≤1.0 cm, shows a very favorable prognosis.2,3
However, PTC and even PTMC show a high incidence of cervical lymph-node metastasis, and these nodal metastases are one of the most significant prognostic factors for locoregional recurrences and distant metastasis.2,4-6 The known predictive factors of lymph-node metastasis in PTC mainly involve clinicopathologic issues including tumor size, extrathyroidal extension, multifocality, and lymphovascular invasion.5-7 However, these predictors do not clearly explain the reasons for early lateral lymphatic metastasis in a subcentimeter PTC.
5
draining lymph nodes.8 The initial step of cancer dissemination is thought to be the loss of the epithelial phenotype, gain of mesenchymal morphology and extravasation to lymphatic and blood vessels.8-10 This epithelial-to-mesenchymal transition (EMT) is proposed to be the critical process in cancer aggressiveness and invasiveness, and it is related to the current concept of stem-cell-like properties of cancer cells.10 Cancer stem cells are a small population within a tumor, and they have the ability to self-renew and to differentiate into heterogeneous lineages of cancer cells.11 These cells are thought to play a role in tumor initiation, metastasis, and recurrence after therapy.10
The studies presented here concern differential gene expression with respect to EMT and cancer stem-cell markers determined by oligonucleotide microarray analysis, comparing expression in PTMC specimens with lateral neck-node metastasis versus those without such metastasis. Furthermore, over- or underexpression of genes that correlated with early lymph-node metastasis of PTMC were validated by providing functional evidence.
II. MATERIALS AND METHODS
This study was approved by the institutional review board of the Yonsei University Health System (YUHS), Severance Hospital, and the Catholic University of Korea, St. Mary’s Hospital, both in Seoul, South Korea.
6 A. Tissue samples
The thyroid tissues were obtained from eight PTMC patients who underwent thyroidectomy between May, 2011 and August, 2012 after being diagnosed with PTMC at the Department of Surgery of YUHS. Eight normal thyroid tissue specimens were also obtained from the ipsilateral or contralateral thyroid lobes of the same patients for pairwise analysis. Of eight PTMC, three were PTMC without nodal involvement and extrathyroidal extension (T1aN0). The rest were PTMC with lateral neck-node metastasis at initial diagnosis (T1aN1b or T3N1b) and underwent modified radical neck dissection combined with thyroidectomy. The three pairs of 0.2x0.2x0.2cm size cubes of both cancer and normal thyroid tissue were immediately obtained from the surgeon after thyroidectomy; the samples were snap-frozen in liquid nitrogen at the operation theater and then stored at –80°C. All PTMC were histologically diagnosed as classic papillary carcinoma, and atypical variants such as follicular variant, tall-cell variant, or diffuse sclerosing variant were all excluded from this study.
B. Extraction of RNA from tissue samples
Extraction of RNA was done after final histologic diagnosis of tumor and nodal stage. Total RNA was extracted using Trizol (Invitrogen Life Technologies; Carlsbad, CA, USA) and purified using RNeasy columns
7
(Qiagen; Valencia, CA, USA) according to the manufacturers’ protocols. The RNA samples were quantified, aliquoted, and stored at -80°C until use. Purity and integrity of RNA was evaluated by denaturing gel electrophoresis and absorbance. Absorbance measurements at 260 nm were used to quantify RNA (ND-1000 Spectrophotometer) (NanoDrop; Wilmington, DE, USA). The ratio of absorbance at 260 nm to that at 280 and 230 nm was used as an indication of sample purity, and values of 1.72.0 were considered to indicate relatively pure RNA. Total-RNA integrity was checked using an Agilent Technologies 2100 Bioanalyzer (Agilent Technologies; Palo Alto, CA, USA) with an RNA Integrity Number value.
C. Oligonucleotide Microarrays
Labeling and purification
Total RNA was amplified and purified using the TargetAmpTM-Nano Labeling Kit for Illumina® Expression BeadChip® (EPICENTRE; Madison, WI, USA) to yield biotinylated cRNA, according to the manufacturer’s instructions. Briefly, in the range of 200500 ng of total RNA was reverse-transcribed to cDNA using a T7 oligo (dT) primer. Second-strand cDNA was synthesized, in-vitro transcribed, and labeled with biotin-NTP. After purification, the cRNA was quantified spectrophotometrically.
Hybridization and data export
8
assay and targets more than 47000 human probes. After fragmentation, 750 ng of labeled cRNA samples were hybridized to each HumanHT-12 v4.0 Expression Beadchip for 1618 h at 58°C, according to the manufacturer's instructions (Illumina, Inc.; San Diego, CA, USA). Detection of array signal was carried out using Amersham fluorolink streptavidin-Cy3 (GE Healthcare Bio-Sciences; Little Chalfont, UK) following the bead-array manual. Arrays were scanned with an Illumina bead array Reader confocal scanner according to the manufacturer's instructions
Raw data preparation and statistical analysis
The quality of hybridization and overall chip performance were monitored by visual inspection of both internal quality control checks and the raw scanned data. Raw data were extracted using the software provided by the manufacturer (Illumina GenomeStudio v2011.1 and Gene Expression Module v1.9.0).
We applied a filtering criterion for data analysis, as a higher signal value was required for detection of p-values of < 0.05. Array probes that have detection p≥0.05 (similar to signal-to-noise ratio) in over 50% of the samples were filtered out (25,391 probes). Selected gene signal values (for 21,927 probes) were transformed by logarithm and normalized by the quantile method.
To identify genes whose expression was up- or downregulated, statistical significance of the differentially expressed genes (DEGs) was determined
9
using paired t-test, independent T-test, and fold-change filtration. Comparison between results from normal and PTMC specimens were performed using paired t-test with two-sided p<0.05 in the paired normal-cancer groups and median fold-change cut-off of 2.0. False discovery rate (FDR) was controlled by adjusting the p-value using the Benjamini-Hochberg algorithm (p<0.001) in a comparison of normal versus PTMC samples. Gene expression differences between PTMC samples with metastasis versus those without metastasis were smaller than normal and PTMC samples, and independent t-test with two-sided p<0.05 and median fold-change cut-off of >1.5 were performed. Hierarchical cluster analysis was used to cluster DEG groups that behaved similarly across experiments using complete linkage and Euclidean distance. Gene-Enrichment and Functional Annotation analysis for significant probe lists was performed using DAVID (http://david.abcc.ncifcrf.gov/home.jsp). All data analysis and visualization of DEGs was conducted using R 2.15.1 (www.r-project.org). Statistical analysis of functional profiles was performed using goProfiles of an R package.
2. BRAFV600E mutation analysis by peptide-nucleic-acid-clamp real-time PCR
Genomic DNAs were extracted from the eight above-mentioned PTMC formalin-fixed, paraffin-embedded tissue sections with the QIAmp DNA FFPE tissue kit (Qiagen; Valencia, CA, USA) as per instructions provided.
10
The BRAFV600E mutation was tested with the Peptide Nucleic Acid (PNA) ClampTM BRAF Mutation Detection Kit (Panagene; Daejeon, Korea) according to the manufacturer’s instructions.
3. Real-time quantitative PCR
Quantitative real-time PCR of DEGs was performed to confirm the microarray data. The expression levels of IL1RL1, ALDH1A3, FGFBP1, TM4SF1, PROM1, CAV1, CCL18, TGIF1, SMAD3, CDCP1, and CXCR1 were determined using isolated total RNA for microarrays hybridizations. Primers were designed with Primer Express ver 3.0 (Applied Biosystems; Burlingame, CA, USA) (Table 1). Real-time PCR analysis was performed on an Applied Biosystems Prism 7900 Sequence Detection System (PE Applied Biosystems, www.appliedbiosciences.com) with SYBR Green. Amplification conditions were the same for all primers: 50C for 2 min and 95C for 10 min followed by 40 cycles of 95C for 30 s and 60C for 30 s, followed by 72C for 30 s. Glyceraldehyde-3-phosphate dehydrogenase (GAPDH) was used as an internal control standard. The experiments were independently performed in triplicate and the real-time PCR cycle numbers were then converted to gene amounts (ng) using an accepted formula.
11
Table 1. The gene specific primer of interest genes
Gene Symbol Accession No. Primer Sequence Size
(bp) ALDH1A3 NM_000693.1 F GCCCGTAACAGAACCAGTGT 96 R AGGGAAGCCAAATGTGGTAA CAV1 NM_001753.3 F TTTGCCCAGAAAGAAGATGG 188 R CCCAAAGGCAGAATCACAAT CCL18 NM_002988.2 F ACCTGAAGCTGAATGCCTGA 125 R TTAGAAGAGGTGGCCTCCAG CDCP1 NM_178181.1 F TTTGGTCCAACATCCACAAA 122 R GAGAAACAGGAAGGGAGCCT IL1RL1 NM_003856.2 F ACGTATTCCAGGGAGCCTTT 186 R GGACCCAAAGATGGAAGAGA PROM1 NM_006017.1 F GTCCAGCATGGATGAAACCT 181 R GGGAATGCCTACATCTGGAA SMAD3 NM_005902.3 F CCAAGAAGCCTTCACTCACC 76 R CATCCCTCCACACACATCAG TGIF1 NM_170695.2 F GGACCTCAACCAGGACTTCA 142 R CCGGCAATCATGACATTTCT TM4SF1 NM_014220.2 F ACAATGCTGCTCATTGTTGTG 183 R CCATGTTCCAATGATGCTGA FGFBP1 NM_005130.3 F ATGTATTTCCATGGCCCACA 100 R CAGCAGAAAGTTCGTTGCAC CXCR1 NM_000634.2 F CAGCATCCCTAGAAAGCCAT 78 R ACTTCCACAGGGACAAGCAC GAPDH F ATGGGGAAGGTGAAGGTCG 108 R GGGGTCATTGATGGCAACAAT
4. Western blot analysis
Western blot preparation and analysis was performed to confirm the protein overexpression of genes of interest in thyroid cancer tissues. Three PTMC
12
tissues used for microarray analysis (one was N0 and two were N1b) and one additional N0 tissue were used for Western blot analysis. To prepare protein samples from tissue specimens, homogenization was performed in protein lysis buffer (150 mM sodium chloride, 1% v/v Triton X-100, 1% w/v sodium deoxycholate, 0.1% w/v SDS, 50 mM Tris-HCl at pH 7.5, and 2 mM EDTA). Protein concentrations were determined by the Bradford assay, with bovine serum albumin as standard. Equal aliquots of total protein (50 µg) were solubilized in sample buffer and separated by electrophoresis on denaturing SDS-polyacrylamide gels (5% w/v stacking gel and 12% separating gel). The proteins were then transferred to polyvinylidene difluoride membranes. The membranes were blocked with 5% (w/v) nonfat dry milk in Tris-buffered saline (TBS) containing 0.05% (v/v) Tween 20 and then incubated with primary antibodies overnight at 4C, followed by incubation with horseradish peroxidase-conjugated secondary antibodies for 2 h at room temperature. Antigen-antibody complexes were detected with WEST-SAVE UpTM luminol-based ECL reagent (ABfrontier; Seoul, South Korea). Primary antibodies for immunohistochemistry (IHC) were IL1RL1 (Fitzgerald; Acton, MA, USA), ALDH1A3 (Abcam; Cambridge, UK), PROM1 (Fitzgerald), and CAV1 (Abcam).
5. Immunohistochemistry
13
overexpression of genes of interest in thyroid cancer tissues. The 44 PTMC patients who underwent thyroidectomy from January, 2011 to February, 2014 at the Department of Surgery, St. Mary’s Hospital in Seoul were enrolled. Of these, 24 cases were PTMC with lateral neck-node metastasis at initial operation, and the others were PTMC without node metastasis. The IHC staining was confirmed by a single pathologist, Jung CK, who specialized in thyroid pathology. The 4-μm-thick sections of FFPE tissue blocks were dewaxed in xylene and then rehydrated through graded ethanol to water. After microwave treatment in antigen-unmasking solution for 15 min, the sections were incubated in 3% (v/v) hydrogen peroxide for 10 min to inactivate endogenous peroxidase activity. Then sections were incubated at 4°C overnight with antibodies. Immunostaining was performed using the Vectastain Universal Quick kit according to the manufacturer’s instructions. Peroxidase staining was revealed with 3, 3-diaminobenzidine. Antiserum was omitted in the negative control. The IHC score was determined based on the staining intensity and percentage of positive cells.Primary antibodies used were against IL1RL1 (Fitzgerald), ALDH1A3 (Abcam), PROM1 (Fitzgerald), and CAV1 (Abcam).
III. RESULTS
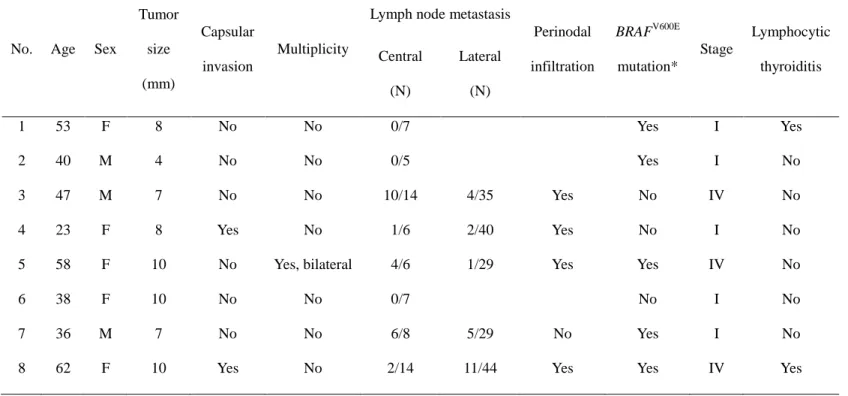
The clinicopathologic characteristics of eight PTMC are shown in Table 2. The mean age was 45.2±16.0 yr in PTMC with lateral node metastasis (N1b PTMC)
14
and 43.7±8.1 yr in PTMC without node metastasis (N0 PTMC) (p=0.523). The mean tumor size did not show a significant difference between two groups (8.4±1.5 mm in N1b PTMC and 7.3±3.1 mm in N0 PTMC; p=0.885). Out of nodal metastasis cases, one showed an extrathyroidal tumor extension, and another a bilateral cancer lesion. Of five N1b PTMC, four cases revealed perinodal infiltration in metastatic nodes. Regarding the BRAFV600E mutation, three N1b and two N0 PTMCs contained the mutation.
Initial oligonucleotide microarray analysis was performed to compare gene expression differences between normal thyroid tissues and PTMC. Hierarchial cluster analysis of DEGs between normal thyroid and PTMC is shown distinctively in Figure 1.
15
Figure 1. Hierarchial cluster analysis of differentially expressed genes between
papillary thyroid microcarcinoma and normal thyroid tissues. Red indicates overexpression, green underexpression, and black average expression.
16
Table 2. Clinicopathologic characteristics of 8 papillary thyroid microcarcinoma patients
No. Age Sex
Tumor size (mm) Capsular invasion Multiplicity
Lymph node metastasis
Perinodal infiltration BRAFV600E mutation* Stage Lymphocytic thyroiditis Central (N) Lateral (N) 1 53 F 8 No No 0/7 Yes I Yes 2 40 M 4 No No 0/5 Yes I No 3 47 M 7 No No 10/14 4/35 Yes No IV No 4 23 F 8 Yes No 1/6 2/40 Yes No I No
5 58 F 10 No Yes, bilateral 4/6 1/29 Yes Yes IV No
6 38 F 10 No No 0/7 No I No
7 36 M 7 No No 6/8 5/29 No Yes I No
8 62 F 10 Yes No 2/14 11/44 Yes Yes IV Yes
17
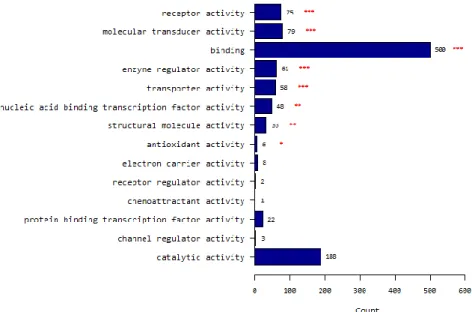
A total of 930 probes corresponding to 798 genes were identified whose expression differed significantly in paired t-test analysis of p<0.05 with a fold-change of ≥2.0. Of these, 413 genes showed significant upregulation, and 385 genes showed downregulation in PTMCs compared to normal thyroid tissues. Regarding functional profile analysis by goProfiles, PTMC showed significant differences in genes associated with biological processes related to (i) multicellular organismal processes; (ii) developmental processes; (iii) responses to stimuli; (iv) biologic adhesion; (v) signaling; (vi) biological regulation; (vii) locomotion; (viii) cell proliferation; (ix) immune system processes; (x) cellular processes; (xi) death; (xii) growth; (xiii) localization; (xiv) cellular component organization or biogenesis; (xv) rhythmic processes; (xvi) establishment of localization; (xvii) reproductive processes; (xviii) viral reproduction; (xix) reproduction; and (xx) pigmentation (Fig. 2A and Table 3). With respect to aspects of cellular components, PTMC showed differences in (i) extracellular region; (ii) extracellular region part; (iii) membrane; (iv) membrane part; (v) membrane-enclosed lumen; (vi) macromolecular complex; (vii) cell junction; (viii) cell part; (ix) organelle; (x) synapse; (xi) organelle part; (xii) cell; and (xiii) synapse part (Fig. 2B and Table 3). Molecular functions showed differences in PTMC related to (i) receptor activity; (ii) molecular transducer activity; (iii) binding; (iv) enzyme regulator activity; (v) transporter activity; (vi) nucleic acid-binding transcription factor activity; (vii) structural molecule activity; and (viii) antioxidant activity (Fig. 2C and Table 3).
18
(A) Molecular characteristics according to biological process
19
(c) Molecular characteristics according to molecular function
Figure 2. Molecular characteristics of differentially expressed genes between normal thyroid and papillary thyroid microcarcinoma(PTMC) tissues
20
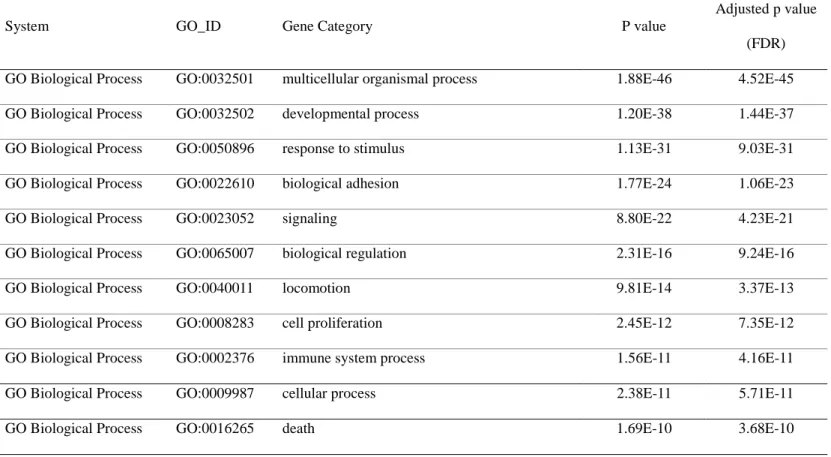
Table 3. Analysis of Differentially expressed genes between normal thyroid and papillary thyroid microcarcinoma(PTMC) tissues according to gene ontology
System GO_ID Gene Category P value
Adjusted p value (FDR) GO Biological Process GO:0032501 multicellular organismal process 1.88E-46 4.52E-45 GO Biological Process GO:0032502 developmental process 1.20E-38 1.44E-37 GO Biological Process GO:0050896 response to stimulus 1.13E-31 9.03E-31
GO Biological Process GO:0022610 biological adhesion 1.77E-24 1.06E-23
GO Biological Process GO:0023052 signaling 8.80E-22 4.23E-21
GO Biological Process GO:0065007 biological regulation 2.31E-16 9.24E-16
GO Biological Process GO:0040011 locomotion 9.81E-14 3.37E-13
GO Biological Process GO:0008283 cell proliferation 2.45E-12 7.35E-12
GO Biological Process GO:0002376 immune system process 1.56E-11 4.16E-11
GO Biological Process GO:0009987 cellular process 2.38E-11 5.71E-11
21
GO Biological Process GO:0040007 growth 7.43E-09 1.49E-08
GO Biological Process GO:0051179 localization 1.97E-06 3.64E-06
GO Biological Process GO:0071840 cellular component organization or biogenesis 4.94E-05 8.47E-05
GO Biological Process GO:0048511 rhythmic process 0.0002871 0.0004595
GO Biological Process GO:0051234 establishment of localization 0.0024359 0.0036539 GO Biological Process GO:0022414 reproductive process 0.0028307 0.0039963
GO Biological Process GO:0016032 viral reproduction 0.0034849 0.0046466
GO Biological Process GO:0000003 reproduction 0.0069792 0.0088159
GO Biological Process GO:0043473 pigmentation 0.0230534 0.0276641
GO Cellular Component GO:0005576 extracellular region 3.89E-46 5.06E-45 GO Cellular Component GO:0044421 extracellular region part 2.37E-37 1.54E-36
GO Cellular Component GO:0016020 membrane 3.41E-20 1.48E-19
GO Cellular Component GO:0044425 membrane part 5.95E-15 1.93E-14
GO Cellular Component GO:0031974 membrane-enclosed lumen 0.0001742 0.0004529 GO Cellular Component GO:0032991 macromolecular complex 0.0003642 0.0007891
22
GO Cellular Component GO:0030054 cell junction 0.0004992 0.0009271
GO Cellular Component GO:0044464 cell part 0.0008169 0.0013275
GO Cellular Component GO:0043226 organelle 0.0021541 0.0029496
GO Cellular Component GO:0045202 synapse 0.0022689 0.0029496
GO Cellular Component GO:0044422 organelle part 0.0046641 0.0055121
GO Cellular Component GO:0005623 cell 0.0071444 0.0077119
GO Cellular Component GO:0044456 synapse part 0.0077119 0.0077119
GO Molecular function GO:0004872 receptor activity 2.15E-16 3.01E-15
GO Molecular function GO:0060089 molecular transducer activity 7.82E-11 5.47E-10
GO Molecular function GO:0005488 binding 4.58E-08 2.14E-07
GO Molecular function GO:0030234 enzyme regulator activity 1.55E-05 5.44E-05 GO Molecular function GO:0005215 transporter activity 0.0001745 0.0004886 GO Molecular function GO:0001071 nucleic acid binding transcription factor activity 0.0015578 0.0034248 GO Molecular function GO:0005198 structural molecule activity 0.0017124 0.0034248 GO Molecular function GO:0016209 antioxidant activity 0.0158113 0.0276698
23
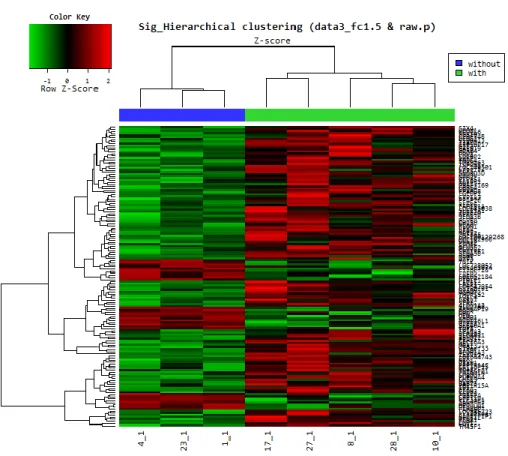
Gene expression differences between N1b and N0 PTMC were smaller than those between normal and PTMC. A median fold-change cut-off of >1.5 and independent t-test with p<0.05 were applied. The hierarchial cluster analysis between N1b and N0 PTMC showed distinct gene expression differences (Fig. 3).
Figure 3. Hierarchial cluster analysis of DEGs between N0 and N1b PTMC.
Red indicates overexpression, green underexpression, and black average expression. “Without” (blue) indicates papillary thyroid microcarcinoma without lymph node metastasis (N0); “With” (green) indicates papillary thyroid microcarcinoma with lateral lymph-node metastasis (N1b).
24
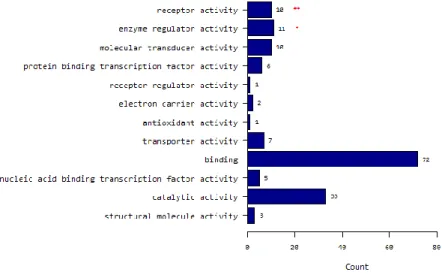
Of 146 probes corresponding to 131 genes whose expression differed significantly between the two groups, 107 genes showed significant upregulation, and 24 showed downregulation in N1b PTMC when compared with N0. By goProfiles analysis, N1b PTMC showed differences in the biological processes linked to (i) signaling; (ii) multicellular organismal process; (iii) response to stimuli; (iv) developmental process; (v) cell proliferation; (vi) death; (vii) locomotion; and (viii) biological regulation (Fig. 4A). Furthermore, significant differences were seen for expression of genes associated with cellular components related to (i) membrane; (ii) extracellular region; (iii) macromolecular complex; (iv) membrane part; (v) cell junction; and (vi) membrane-enclosed lumen. With respect to molecular function, genes related to (i) receptor activity and (ii) enzyme regulator activity showed differences in N1b PTMC compared with N0 (Fig. 4B and C). Differentially expressed genes in N1b PTMC are shown in Table 4 according to gene ontology and functional profiles.
25
(A) Molecular characteristics according to biological process
26
(C) Molecular characteristics according to molecular function
Figure 4. Molecular characteristics of differentially expressed genes between PTMC with lateral neck-node metastasis and PTMC without node metastasis.
27
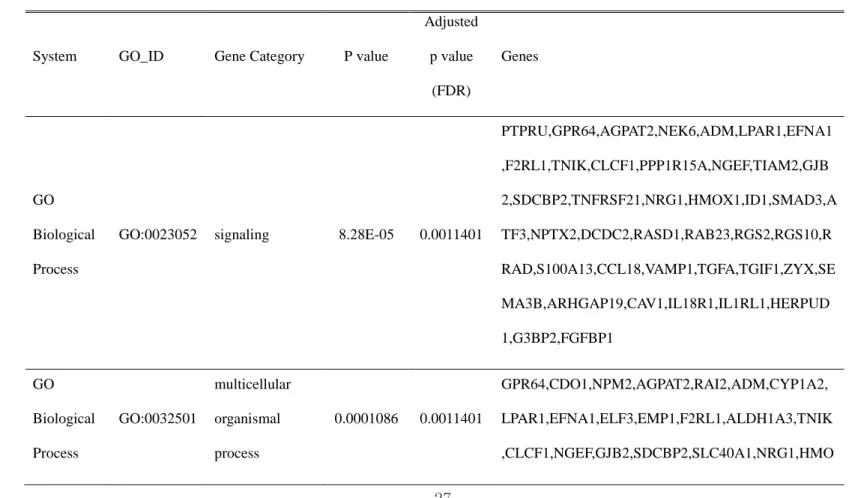
Table 4. Analysis of genes that were differentially expressed between PTMC with lateral neck-node metastasis and PTMC without node metastasis, according to gene ontology
System GO_ID Gene Category P value
Adjusted p value (FDR) Genes GO Biological Process
GO:0023052 signaling 8.28E-05 0.0011401
PTPRU,GPR64,AGPAT2,NEK6,ADM,LPAR1,EFNA1 ,F2RL1,TNIK,CLCF1,PPP1R15A,NGEF,TIAM2,GJB 2,SDCBP2,TNFRSF21,NRG1,HMOX1,ID1,SMAD3,A TF3,NPTX2,DCDC2,RASD1,RAB23,RGS2,RGS10,R RAD,S100A13,CCL18,VAMP1,TGFA,TGIF1,ZYX,SE MA3B,ARHGAP19,CAV1,IL18R1,IL1RL1,HERPUD 1,G3BP2,FGFBP1 GO Biological Process GO:0032501 multicellular organismal process 0.0001086 0.0011401 GPR64,CDO1,NPM2,AGPAT2,RAI2,ADM,CYP1A2, LPAR1,EFNA1,ELF3,EMP1,F2RL1,ALDH1A3,TNIK ,CLCF1,NGEF,GJB2,SDCBP2,SLC40A1,NRG1,HMO
28 X1,HPN,ID1,FREM2,SMAD3,NBL1,NPTX2,DCDC2, RAB23,SIX4,PRKX,RGS2,S100A13,SLC11A1,STIM 1,VAMP1,TGFA,TGIF1,TUBB2A,SEMA3B,CAV1,PR OM1,SLC16A3,IL1RL1,PIWIL1 GO Biological Process GO:0050896 response to stimulus 0.0004512 0.0031585 PTPRU,GPR64,CDO1,AGPAT2,NEK6,ADM,CLDN3, CYP1A2,LPAR1,EFNA1,ELF3,F2RL1,ALDH1A3,TN IK,CLCF1,PPP1R15A,NGEF,TIAM2,HSPB8,SDCBP2 ,TNFRSF21,CYP2S1,NRG1,HMOX1,HPN,ID1,SMA D3,ATF3,SCARA3,DCDC2,RASD1,RAB23,RGS2,R GS10,RRAD,S100A13,CCL18,NFKBIZ,SLC11A1,ST IM1,SULT2B1,TGFA,TGIF1,ZYX,SEMA3B,ARHGA P19,CAV1,IL18R1,SLC16A3,IL1RL1,HERPUD1,G3B P2,FGFBP1
29 GO Biological Process GO:0032502 developmental process 0.0006126 0.0032163 CDO1,NPM2,AGPAT2,RAI2,NEK6,ADM,CYP1A2,L PAR1,EFNA1,ELF3,EMP1,F2RL1,ALDH1A3,TNIK, CLCF1,NGEF,GJB2,SDCBP2,SLC40A1,NRG1,HMO X1,HPN,ID1,FREM2,SMAD3,NBL1,DCDC2,RAB23, SIX4,PRKX,RGS2,S100A13,TGFA,TGIF1,SEMA3B, CAV1,PROM1,PIWIL1 GO Biological Process
GO:0008283 cell proliferation 0.0026645 0.0111909
PTPRU,ADM,EMP1,F2RL1,CLCF1,NRG1,HMOX1, HPN,SMAD3,ATF3,PRKX,S100A13,SLC11A1,TGFA ,TGIF1,CAV1,FGFBP1 GO Biological Process GO:0016265 death 0.0046751 0.0163375 PNMA2,LPAR1,ALDH1A3,CLCF1,PPP1R15A,NGEF ,TIAM2,HSPB8,TNFRSF21,SLC40A1,HBA2,NRG1, HMOX1,HPN,ID1,SMAD3,SIX4,TGFA,CAV1,HERP UD1
30 GO Biological Process GO:0040011 locomotion 0.0054458 0.0163375 PTPRU,LPAR1,EFNA1,F2RL1,HMOX1,ID1,SMAD3, DCDC2,SIX4,PRKX,CCL18,SEMA3B,CAV1,SLC16 A3 GO Biological Process GO:0065007 biological regulation 0.0108891 0.0285839 PTPRU,GPR64,CDO1,NPM2,AGPAT2,NEK6,PIK3IP 1,LMTK3,NCOA7,CYP1A2,LPAR1,EFNA1,ELF3,F2 RL1,ALDH1A3,TNIK,CLCF1,PPP1R15A,NGEF,TIA M2,SDCBP2,TNFRSF21,SLC40A1,HBA2,NRG1,HM OX1,HPN,ID1,SMAD3,ATF3,NBL1,DCDC2,RASD1, RAB23,SIX4,PEX6,PDPR,CHPT1,RFX2,RGS2,RGS1 0,RRAD,S100A13,CCL18,NFKBIZ,SLC11A1,SLPI,S TIM1,VAMP1,TGFA,TGIF1,ZYX,PPP1R14C,SLC4A 11,ARHGAP19,CAV1,IL18R1,SLC16A3,IL1RL1,PIW IL1,HERPUD1,G3BP2,FGFBP1
31 GO Cellular Component GO:0005576 extracellular region 2.02E-05 0.0001314 ADM,EFNA1,C12orf28,CLCF1,CPAMD8,HCG22,NR G1,HMOX1,FREM2,NBL1,SCARA3,SCUBE2,S100A 13,CCL18,SLPI,TGFA,TMPRSS2,SEMA3B,FRAS1,L OXL4,IL1RL1,FGFBP1 GO Cellular Component
GO:0016020 membrane 5.37E-06 6.98E-05
PTPRU,TSPAN1,GPR64,AGPAT2,PIK3IP1,LMTK3,C LDN3,CYP1A2,LPAR1,EFNA1,EMP1,F2RL1,NGEF, ABHD12,GJB2,SDCBP2,CPAMD8,TNFRSF21,SLC2 7A6,CYP2S1,SLC40A1,NRG1,HMOX1,HPN,FREM2 ,CTXN1,TM4SF1,SMAD3,MGAT3,GALNT9,SCARA 3,RASD1,RAB23,PEX6,CHPT1,PLEKHA4,RGS2,RG S10,RRAD,FNDC4,SLC11A1,STIM1,TGFA,TMPRSS 2,ZYX,SEMA3B,ELOVL6,C3orf52,FRAS1,RAB11FI P1,TMEM163,PPP1R14C,SLC4A11,LOXL4,CAV1,PP AP2C,IL18R1,PROM1,CH25H,SLC16A3,MYADM,IL 1RL1,REEP6,HERPUD1,FGFBP1
32 GO
Cellular Component
GO:0030054 cell junction 0.0461395 0.1013821 PTPRU,CLDN3,GJB2,HPN,VAMP1,ZYX,CAV1
GO Cellular Component GO:0031974 Membrane enclosed lumen 0.0467917 0.1013821 NPM2,PNMA2,HMOX1,KRT8,SMAD3,ATF3,PDPR, RGS2,C19orf33 GO Cellular Component GO:0032991 macromolecular complex 0.0013647 0.0059137 NEK6,GJB2,HBA2,KRT8,SMAD3,STIM1,TUBB2A, CAV1,PIWIL1 GO Cellular Component
GO:0044425 membrane part 0.0037740 0.0122656
PTPRU,TSPAN1,GPR64,AGPAT2,PIK3IP1,LMTK3,C LDN3,CYP1A2,LPAR1,EFNA1,EMP1,F2RL1,ABHD 12,GJB2,TNFRSF21,SLC27A6,CYP2S1,SLC40A1,HP N,FREM2,CTXN1,TM4SF1,FNDC4,SLC11A1,STIM1 ,VAMP1,TGFA,TMPRSS2,ZYX,ELOVL6,C3orf52,FR AS1,TMEM163,SLC4A11,CAV1,IL18R1,PROM1,CH
33
25H,SLC16A3,MYADM,IL1RL1,REEP6,HERPUD1 GO
Molecular Function
GO:0004872 receptor activity 0.0071883 0.0862594
PTPRU,CLDN3,LPAR1,HPN,SCARA3,TMPRSS2,SE MA3B,LOXL4,IL18R1,IL1RL1 GO Molecular Function GO:0030234 enzyme regulator activity 0.0263321 0.1579928 TNIK,NGEF,TIAM2,CPAMD8,NRG1,RGS2,RGS10,S LPI,PPP1R14C,ARHGAP19,CAV1
34
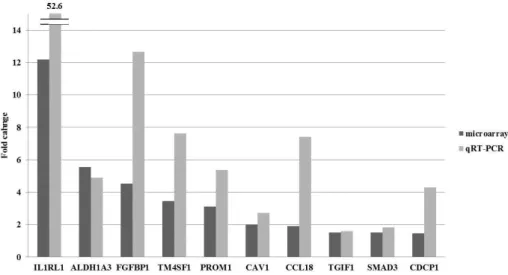
Of 131 DEGs in N1b PTMC, we investigated genes known to be functionally involved in EMT and cancer stem cells. A total of 19 genes including IL1RL1, ALDH1A3, FGFBP1, TM4SF1, SLPI, PROM1, SEMA3B, SLC16A3, FNDC4, CAV1, CCL18, ELF3, TMPRSS2, ID1, TIAM2, DCDC2, TGIF1, EFNA1, and SMAD3 showed a significant upregulation in N1b PTMC (Table 5). Of these, we selected EMT-related genes including IL1RL1, FGFBP1, CAV1, TGIF1, and SMAD3, and cancer stem-cell markers including ALDH1A3, TM4SF1, and PROM1 and performed quantitative RT-PCR (qRT-PCR) to confirm the microarray data. In all cases, qRT-PCR results confirmed a similar or more significant change than the microarrays (Fig. 5).
Figure 5. Validation of microarray-based gene expression by quantitative real time PCR.
35
Table 5. EMT and stem-cell marker-related gene expression in PTMC with lateral neck-node metastasis versus without node metastasis
Gene Symbol Description Fold change * P value
IL1RL1 Homo sapiens interleukin 1 receptor-like 1 12.19 0.019
ALDH1A3
Homo sapiens aldehyde dehydrogenase 1 family, member A3
5.55 0.001
FGFBP1
Homo sapiens fibroblast growth factor binding protein 1
4.53 0.004
TM4SF1
Homo sapiens transmembrane 4 L six family member 1
3.45 0.019
PROM1 Homo sapiens prominin 1 3.11 0.017
SLC16A3
Homo sapiens solute carrier family 16, member 3 (monocarboxylic acid transporter 4)
2.42 0.038
CAV1 Homo sapiens caveolin 1, caveolae protein 2.01 0.007
CCL18
Homo sapiens chemokine (C-C motif) ligand 18 (pulmonary and activation-regulated)
1.91 0.009
TMPRSS2 Homo sapiens transmembrane protease, serine 2 1.87 0.009
TIAM2
Homo sapiens T-cell lymphoma invasion and metastasis 2
1.78 0.005
DCDC2 Homo sapiens doublecortin domain containing 2 1.57 0.021 TGIF1 Homo sapiens TGFB-induced factor homeobox 1 1.52 0.044
36
SMAD3 Homo sapiens SMAD family member 3 1.51 0.03 *Fold change of PTMC with lateral neck node metastasis / PTMC without node metastasis
To confirm protein expression of overexpressed genes, we performed Western blot analysis and IHC for five genes, i.e., IL1RL1, TM4SF1, CAV1, ALDH1A3, and PROM1. In Western blot analysis, protein expression of CAV1 and
TM4SF1 was more highly increased in N1b PTMC than N0 PTMC (Fig. 6). IL1RL1 showed a weak positivity in N1b PTMC when compared with N1 PTMCs. However, the expression of PROM1 and ALDH1A3 did not show a significant correlation between the two groups.
Figure 6. Validation of microarray-based gene expression by Western blot analysis. Lane numbers 1 and 2 contain N0 PTMC samples; 3 and 4 from N1b PTMCs. Arrows indicate the target band.
37
Immunohistochemistry was performed in 44 PTMC samples as an external validation (Table 6). The protein expression was scored based on staining intensity and percentage of positive cells. Regarding PROM1, any positivity was considered as positive. The mean age, gender ratio, and mean tumor size did not show a significant difference between N0 and N1b PTMC groups. Multiple lesion and extrathyroidal extension were significantly more frequent in the N1b group (p<0.001). Vascular and perineural invasion did not show a statistical difference between the groups; however, lymphatic vessel invasion within the tumor was more common in the N1b group (p<0.001). Regarding occurrence of the BRAFV600E mutation, there was no statistical difference
between the two groups. ALDH1A3 and CAV1 were more frequently expressed in N1b PTMCs (p=0.003 and p<0.001, respectively); however, expression of PROM1, TM4SF1, and IL1RL1 showed no significant differences between the groups.
Table 6. Clinicopathologic charateristics and immunohistochemistry of 44 PTMCs N0 PTMC (N=20) N1b PTMC (N=24) P-value
Age (yr, mean±SD) 43.1±11.7 43.8±13.7 0.858
Gender (M/F) 5/15 7/17 0.999
Tumor size (cm, mean±SD) 0.79±0.10 0.78±0.21 0.890 Multiplicity No 20(100%) 10(41.7%) <0.001
38 Yes 0(0%) 14(58.3%) Extrathyroidal extension No 20(100%) 7(29.2%) <0.001 Yes 0(0%) 17(70.8%) Vascular invasion No 20(100%) 23(95.8%) 0.999 Yes 0(0%) 1(4.2%) Lymphatic invasion No 19(95%) 3(12.5%) <0.001 Yes 1(5%) 21(87.5%) Perineural invasion No 20(100%) 23(95.8%) 0.999 Yes 0(0%) 1(4.2%) T stage 1 20(100%) 7(29.2%) <0.001 3 0(0%) 17(70.8%) TNM stage I 20(100%) 5(20.8%) <0.001 IV 0(0%) 19(79.2%)
BRAFV600E mutation No 4(20%) 5(20.8%) 0.999
Yes 16(80%) 19(79.2%) Immunohistochemistry PROM1 No 15(75%) 13(61.9%) 0.505 Yes 5(25%) 8(38.1%) ALDH1A3 No 18(90%) 10(45.5%) 0.003 Yes 2(10%) 12(54.5%) TM4SF1 No 4(20%) 5(21.7%) 0.999 Yes 16(80%) 18(78.3%) CAV1 No 18(90%) 3(12.5%) <0.001 Yes 2(10%) 21(87.5%)
39
IL1RL1 No 15(75%) 13(54.2%) 0.213
Yes 5(25%) 11(45.8%)
IV. DISCUSSION
Nodal spread of PTC is common, and in the range of 4060% of PTC shows cervical lymph-node metastasis at initial diagnosis.12 The tumor spread in PTC mostly occurs in a stepwise pattern from central neck to lateral cervical compartment and superior mediastinum.13 PTMC, a subcentimeter PTC, shows similar gene expression profiles with large PTC; therefore, it is considered as an earlier stage of PTC.14 PTMC also shows frequent nodal metastasis in the range of 2056%, and early extensive lymphatic spread to lateral the compartment was observed in 47% of PTMC at presentation.15,16
With respect to molecular aspects, various markers investigated were found to be engaged in lymph-node metastasis of PTC, including overexpression of vimentin, cyclin D1, metalloproteinase 11, claudin1, VEGF-D, CST6, CXCL14, DHRS3, and SPP1.17-20 Additionally, rearrangements of RET/PTC, NTRK1, and the hotspot mutation BRAFV600E, were investigated. KRAS was correlated with lymph-node metastasis and aggressiveness of PTC; however, there was no systematic reliable molecular marker to predict cervical nodal metastasis.21,22 The process of EMT was first recognized in embryogenesis during organ development, and recently it has also been implicated in cancer progression, associated with cell motility and invasion.10 During EMT, cancer cells lose their
40
epithelial phenotype by dissolution of cell-cell junctions and extracellular matrix structural changes.9 After acquisition of elongated mesenchymal morphology, cancer cells acquire a capacity to infiltrate into surrounding tissues and vasculature, followed by metastasis into lymph nodes and distant organs.8-10 Also EMT plays a key part in conversion of early stage tumor into invasive cancer.10 The role of EMT in the progression and aggressiveness of thyroid cancer has been reported in several studies.23-28 Upregulation of EMT-related genes, including RUNX2, and overexpression of vimentin have been observed in the invasive front of papillary thyroid cancer.17 Furthermore, decreased expression of E-cadherin and increased expression of ZEB1, SMAD7, SNAIL, TWIST1, and CDH1 have been reported more frequently in anaplastic thyroid cancer than in papillary thyroid cancer.23,26,27
Along with EMT, cancer stem cells have received much attention in cancer research. Cancer stem cell have been reported in various solid tumors and implicated in local invasion, systemic dissemination, recurrences of cancer, and resistance to conventional therapies.10,25 Cancer stem cells present a mesenchymal-like appearance and are immortal, and EMT is known to be associated with the stem-cell-like properties of cancer cells.10,24,25,27 The cancer stem-cell population is reported to occur in anaplastic and papillary thyroid cancer cell lines, and these cells present the stem-cell markers CD133, CD44, and aldehyde dehydrogenase.25,29-32 Thyroid cancer stem cells both from cell lines and tissues can form thyrospheroids and develop tumors in
41
immunodeficient mice.33 Furthermore, aggressive papillary thyroid cancer and anaplastic thyroid cancer show high expression of cancer stem-cell markers.24 In this study, we compared the gene expression pattern of N1b N0 PTMC by oligonucleotide microarray hybridization and validated the data with qRT-PCR, Western blot analysis, and IHC. We found that a set of genes related to EMT and cancer stem-cell markers were upregulated in N1b PTMCs. Regarding EMT, IL1 is a proinflammatory cytokine that is important in EMT. The
overexpression of IL1 receptor-like 1 (IL-1RL1, ST-2) is reported in MCF-10A cells with CD44+/CD24 phenotype that have undergone EMT.34 Fibroblast growth factor binding protein 1(FGF-BP1) plays a role in tumor angiogenesis and/or proliferation under TGF- signaling. FGF-BP1 is known as epithelial mesenchymal transition marker and is upregulated in mesenchymal-like colorectal cancer cells.35 Solute carrier family 16, member 3 (monocarboxylic acid transporter 4, known as MCT4) shows a specific interaction with
1-integrin and regulates cell migration by modulating cell adhesion and motility.36 Furthermore, MCT4 (SCL16A3) is closely related to lymphatic metastasis, and silencing of MCT4 by siRNA reduces cell migration and invasion.37 Caveolin-1 (CAV-1) is a major structural protein in caveolae, and its expression is upregulated during EMT.38,39 Furthermore, high expression of CAV-1 indicates EMT independently with E-cadherin loss in breast cancer cell lines.40 Chemokine ligand 18 (CCL18) is known to induce EMT by
42
cell lines.41 Transmembrane protease serine 2 (TMPRSS2) promotes EMT by genomic rearrangement with ERG.42 Expression of T-cell lymphoma invasion and metastasis 2 (TIAM2) induces upregulation of mesenchymal markers (N-cadherin and vimentin) and redistribution of epithelial marker (E-cadherin) in HCC cell lines, and it promotes cancer-cell proliferation and
invasiveness.43Doublecortin domain containing 2 (DCDC2) is a member of the DCX family and is involved in cellular motility and neuronal migration.44,45 TGF- elicits EMT by activating various signaling cascades.46,47 It controls many transcription factors, including Snail, Slug, Twist, SIP1, and ZEB of Wnt and Notch pathways, and these genes are involved in cell adhesion,
mesenchymal differentiation, cell migration, and invasion and have been found to result in transcriptional changes.46 They modulate the transcription of the E-cadherin gene promoter during EMT, which has been considered a hallmark of EMT.46 TGF--induced factor homeobox 1 (TGIF1) is the target of TGF- and involved in EMT via the TFG- pathway.40 TGF-/Smad is an important intracellular signal transduction pathway involved in EMT.48 Ephrin-A1 (EFNA1) is the ligand of the Eph receptor tyrosine kinase and functions in angiogenesis, invasion, cell migration, and metastasis in cancer cells.49
With respect to cancer stem cells, aldehyde dehydrogenase is a detoxifying enzyme acted on oxidized intracellular aldehydes (ALDH) and is associated with stem-like properties.50 ALDH1A3 is known as the main ALDH activity in breast cancer stem cells, and it is predictive of metastasis.51 Furthermore, high
43
ALDH expression has been used to identify a subpopulation of stem-like cells from 26 primary thyroid cancers. Cells with high levels of ALDH were able to grow starting with as few as 5103 cells when injected into
immunocompromised mice. Prominin 1 (PROM1) is known as CD133, is a major stem-cell marker, and it enhances cancer metastasis.52 CD133+ is a CSC marker seen in thyroid cancer cell lines, and it is overexpressed in ATC cell lines and surgical samples of human anaplastic thyroid cancers. Transmembrane 4 L six family member 1 (TM4SF1) is rich in human cancer cells, and it
interacts with integrins in tumor angiogenesis.53 TM4SF1 is known as
tumor-associated antigen L6 (TAAL6) and enhances the motility of lung cancer cells.54 Furthermore, TM4SF1 is reportedly one of the candidate markers of thyroid cancer stem cells.30
This study had several limitations. First, the sample size of oligonucleotide microarrays was too small to determine the key genes having impact on early lymphatic metastasis in PTMC. A large-scale study using tissues from prospectively maintained tissue banks will provide more accurate information. Second, the BRAFV600E mutation is more frequent in PTC occurring in the Korean population, and the carcinogenesis pathway may be different in Western populations. Third, this study defined the overexpression of EMT- and cancer stem-cell-related genes in lateral neck-node metastasis of PTMC only; and therefore, validation is needed for large PTCs.
44 V. CONCLUSION
Genes that play a role in EMT and thyroid cancer stem-cell-like properties are upregulated in early extensive lymphatic spread of PTMC.
45 REFERENCES
1. Sugitani I, Kasai N, Fujimoto Y, Yanagisawa A. A novel classific ation system for patients with PTC: addition of the new variables of large (3 cm or greater) nodal metastases and reclassification d uring the follow-up period. Surgery 2004;135:139-48.
2. Hay ID, Grant CS, van Heerden JA, Goellner JR, Ebersold JR, B ergstralh EJ. Papillary thyroid microcarcinoma: a study of 535 cas es observed in a 50-year period. Surgery 1992;112:1139-46; discus sion 46-7.
3. Noguchi S, Yamashita H, Murakami N, Nakayama I, Toda M, Ka wamoto H. Small carcinomas of the thyroid. A long-term follow-u p of 867 patients. Arch Surg 1996;131:187-91.
4. Monchik JM, De Petris G, De Crea C. Occult papillary carcinoma of the thyroid presenting as a cervical cyst. Surgery 2001;129:42 9-32.
5. Yamashita H, Noguchi S, Murakami N, Toda M, Uchino S, Wata nabe S, et al. Extracapsular invasion of lymph node metastasis. A good indicator of disease recurrence and poor prognosis in patien ts with thyroid microcarcinoma. Cancer 1999;86:842-9.
6. Wada N, Duh QY, Sugino K, Iwasaki H, Kameyama K, Mimura T, et al. Lymph node metastasis from 259 papillary thyroid micro carcinomas: frequency, pattern of occurrence and recurrence, and o
46
ptimal strategy for neck dissection. Ann Surg 2003;237:399-407. 7. Liu Z, Wang L, Yi P, Wang CY, Huang T. Risk factors for centr
al lymph node metastasis of patients with papillary thyroid microc arcinoma: a meta-analysis. Int J Clin Exp Pathol 2014;7:932-7. 8. Karaman S, Detmar M. Mechanisms of lymphatic metastasis. J Cl
in Invest 2014;124:922-8.
9. Kiesslich T, Pichler M, Neureiter D. Epigenetic control of epitheli al-mesenchymal-transition in human cancer. Mol Clin Oncol 2013; 1:3-11.
10. Kong D, Li Y, Wang Z, Sarkar FH. Cancer Stem Cells and Epith elial-to-Mesenchymal Transition (EMT)-Phenotypic Cells: Are They Cousins or Twins? Cancers (Basel) 2011;3:716-29.
11. Phay JE, Ringel MD. Metastatic mechanisms in follicular cell-deri ved thyroid cancer. Endocr Relat Cancer 2013;20:R307-19.
12. Randolph GW, Duh QY, Heller KS, LiVolsi VA, Mandel SJ, Stew ard DL, et al. The prognostic significance of nodal metastases fro m papillary thyroid carcinoma can be stratified based on the size and number of metastatic lymph nodes, as well as the presence o f extranodal extension. Thyroid 2012;22:1144-52.
13. Park JY, Koo BS. Individualized optimal surgical extent of the lat eral neck in papillary thyroid cancer with lateral cervical metastasi s. Eur Arch Otorhinolaryngol 2013.
47
14. Kim HY, Park WY, Lee KE, Park WS, Chung YS, Cho SJ, et al. Comparative analysis of gene expression profiles of papillary thy roid microcarcinoma and papillary thyroid carcinoma. J Cancer Re s Ther 2010;6:452-7.
15. He Q, Zhuang D, Zheng L, Fan Z, Zhou P, Lv Z, et al. The sur gical management of papillary thyroid microcarcinoma: a 162-mont h single-center experience of 273 cases. Am Surg 2012;78:1215-8. 16. Zheng X, Wei S, Han Y, Li Y, Yu Y, Yun X, et al. Papillary mi crocarcinoma of the thyroid: clinical characteristics and BRAF(V60 0E) mutational status of 977 cases. Ann Surg Oncol 2013;20:2266 -73.
17. Vasko V, Espinosa AV, Scouten W, He H, Auer H, Liyanarachchi S, et al. Gene expression and functional evidence of epithelial-to-mesenchymal transition in papillary thyroid carcinoma invasion. Pr oc Natl Acad Sci U S A 2007;104:2803-8.
18. Hucz J, Kowalska M, Jarzab M, Wiench M. [Gene expression of metalloproteinase 11, claudin 1 and selected adhesion related gene s in papillary thyroid cancer]. Endokrynol Pol 2006;57 Suppl A:1 8-25.
19. Yasuoka H, Nakamura Y, Zuo H, Tang W, Takamura Y, Miyauchi A, et al. VEGF-D expression and lymph vessels play an importa nt role for lymph node metastasis in papillary thyroid carcinoma.
48 Mod Pathol 2005;18:1127-33.
20. Ringel MD. Molecular markers of aggressiveness of thyroid cancer. Curr Opin Endocrinol Diabetes Obes 2009;16:361-6.
21. Salehian B, Liu Z. Genetic alterations in differentiated thyroid can cers. Endocr Metab Immune Disord Drug Targets 2009;9:257-68. 22. Oler G, Camacho CP, Hojaij FC, Michaluart P, Jr., Riggins GJ, C
erutti JM. Gene expression profiling of papillary thyroid carcinom a identifies transcripts correlated with BRAF mutational status and lymph node metastasis. Clin Cancer Res 2008;14:4735-42.
23. Buehler D, Hardin H, Shan W, Montemayor-Garcia C, Rush PS, Asioli S, et al. Expression of epithelial-mesenchymal transition reg ulators SNAI2 and TWIST1 in thyroid carcinomas. Mod Pathol 2 013;26:54-61.
24. Hardin H, Montemayor-Garcia C, Lloyd RV. Thyroid cancer stem-like cells and epithelial-mesenchymal transition in thyroid cancers. Hum Pathol 2013;44:1707-13.
25. Lan L, Luo Y, Cui D, Shi BY, Deng W, Huo LL, et al. Epithelia l-mesenchymal transition triggers cancer stem cell generation in hu man thyroid cancer cells. Int J Oncol 2013;43:113-20.
26. Montemayor-Garcia C, Hardin H, Guo Z, Larrain C, Buehler D, Asioli S, et al. The role of epithelial mesenchymal transition mar kers in thyroid carcinoma progression. Endocr Pathol
2013;24:206-49 12.
27. Yasui K, Shimamura M, Mitsutake N, Nagayama Y. SNAIL induc es epithelial-to-mesenchymal transition and cancer stem cell-like pr operties in aldehyde dehydroghenase-negative thyroid cancer cells. Thyroid 2013;23:989-96.
28. Liu Z, Kakudo K, Bai Y, Li Y, Ozaki T, Miyauchi A, et al. Loss of cellular polarity/cohesiveness in the invasive front of papillary thyroid carcinoma, a novel predictor for lymph node metastasis; possible morphological indicator of epithelial mesenchymal transiti on. J Clin Pathol 2011;64:325-9.
29. Shimamura M, Nagayama Y, Matsuse M, Yamashita S, Mitsutake N. Analysis of multiple markers for cancer stem-like cells in hum an thyroid carcinoma cell lines. Endocr J 2014.
30. Mitsutake N, Iwao A, Nagai K, Namba H, Ohtsuru A, Saenko V, et al. Characterization of side population in thyroid cancer cell li nes: cancer stem-like cells are enriched partly but not exclusively. Endocrinology 2007;148:1797-803.
31. Zito G, Richiusa P, Bommarito A, Carissimi E, Russo L, Coppola A, et al. In vitro identification and characterization of CD133(po s) cancer stem-like cells in anaplastic thyroid carcinoma cell lines. PLoS One 2008;3:e3544.
50 ol Metab 2011;96:610-3.
33. Ahn SH, Henderson YC, Williams MD, Lai SY, Clayman GL. De tection of thyroid cancer stem cells in papillary thyroid carcinoma. J Clin Endocrinol Metab 2014;99:536-44.
34. Bhat-Nakshatri P, Appaiah H, Ballas C, Pick-Franke P, Goulet R, Jr., Badve S, et al. SLUG/SNAI2 and tumor necrosis factor gener ate breast cells with CD44+/CD24- phenotype. BMC Cancer 2010; 10:411.
35. Asiedu MK, Beauchamp-Perez FD, Ingle JN, Behrens MD, Radisk y DC, Knutson KL. AXL induces epithelial-to-mesenchymal transit ion and regulates the function of breast cancer stem cells. Oncoge ne 2014;33:1316-24.
36. Gallagher SM, Castorino JJ, Philp NJ. Interaction of monocarboxy late transporter 4 with beta1-integrin and its role in cell migration. Am J Physiol Cell Physiol 2009;296:C414-21.
37. Zhu J, Wu YN, Zhang W, Zhang XM, Ding X, Li HQ, et al. M onocarboxylate transporter 4 facilitates cell proliferation and migrat ion and is associated with poor prognosis in oral squamous cell c arcinoma patients. PLoS One 2014;9:e87904.
38. Huang C, Qiu Z, Wang L, Peng Z, Jia Z, Logsdon CD, et al. A novel FoxM1-caveolin signaling pathway promotes pancreatic can cer invasion and metastasis. Cancer Res 2012;72:655-65.
51
39. Gai X, Lu Z, Tu K, Liang Z, Zheng X. Caveolin-1 is up-regulate d by GLI1 and contributes to GLI1-driven EMT in hepatocellular carcinoma. PLoS One 2014;9:e84551.
40. Hollestelle A, Peeters JK, Smid M, Timmermans M, Verhoog LC, Westenend PJ, et al. Loss of E-cadherin is not a necessity for e pithelial to mesenchymal transition in human breast cancer. Breast Cancer Res Treat 2013;138:47-57.
41. Ploenes T, Scholtes B, Krohn A, Burger M, Passlick B, Muller-Q uernheim J, et al. CC-chemokine ligand 18 induces epithelial to mesenchymal transition in lung cancer A549 cells and elevates the invasive potential. PLoS One 2013;8:e53068.
42. Wu L, Zhao JC, Kim J, Jin HJ, Wang CY, Yu J. ERG is a critic al regulator of Wnt/LEF1 signaling in prostate cancer. Cancer Res 2013;73:6068-79.
43. Chen JS, Su IJ, Leu YW, Young KC, Sun HS. Expression of T-c ell lymphoma invasion and metastasis 2 (TIAM2) promotes prolife ration and invasion of liver cancer. Int J Cancer 2012;130:1302-1 3.
44. Halvey PJ, Wang X, Wang J, Bhat AA, Dhawan P, Li M, et al. Proteogenomic analysis reveals unanticipated adaptations of colorec tal tumor cells to deficiencies in DNA mismatch repair. Cancer R es 2014;74:387-97.
52
45. Wang Y, Yin X, Rosen G, Gabel L, Guadiana SM, Sarkisian MR, et al. Dcdc2 knockout mice display exacerbated developmental di sruptions following knockdown of doublecortin. Neuroscience 201 1;190:398-408.
46. Xu J, Lamouille S, Derynck R. TGF-beta-induced epithelial to me senchymal transition. Cell Res 2009;19:156-72.
47. Huber MA, Kraut N, Beug H. Molecular requirements for epitheli al-mesenchymal transition during tumor progression. Curr Opin Ce ll Biol 2005;17:548-58.
48. Scheel C, Eaton EN, Li SH, Chaffer CL, Reinhardt F, Kah KJ, et al. Paracrine and autocrine signals induce and maintain mesenchy mal and stem cell states in the breast. Cell 2011;145:926-40. 49. Iida H, Honda M, Kawai HF, Yamashita T, Shirota Y, Wang BC,
et al. Ephrin-A1 expression contributes to the malignant character istics of {alpha}-fetoprotein producing hepatocellular carcinoma. G ut 2005;54:843-51.
50. Coradini D, Fornili M, Ambrogi F, Boracchi P, Biganzoli E. TP53 mutation, epithelial-mesenchymal transition, and stemlike features in breast cancer subtypes. J Biomed Biotechnol 2012;2012:254085. 51. Marcato P, Dean CA, Pan D, Araslanova R, Gillis M, Joshi M, e t al. Aldehyde dehydrogenase activity of breast cancer stem cells is primarily due to isoform ALDH1A3 and its expression is predi
53
ctive of metastasis. Stem Cells 2011;29:32-45.
52. King CE, Cuatrecasas M, Castells A, Sepulveda AR, Lee JS, Rust gi AK. LIN28B promotes colon cancer progression and metastasis. Cancer Res 2011;71:4260-8.
53. Shih SC, Zukauskas A, Li D, Liu G, Ang LH, Nagy JA, et al. T he L6 protein TM4SF1 is critical for endothelial cell function and tumor angiogenesis. Cancer Res 2009;69:3272-7.
54. Chang YW, Chen SC, Cheng EC, Ko YP, Lin YC, Kao YR, et a l. CD13 (aminopeptidase N) can associate with tumor-associated a ntigen L6 and enhance the motility of human lung cancer cells. I nt J Cancer 2005;116:243-52.
54
ABSTRACT(IN KOREAN)
갑상선 미세유두암의 측경부 임파절 전이에 영향을 미치는
유전적 변화에 관한 연구
<지도교수 정 웅 윤>
연세대학교 대학원 의학과
이 소 희
배경 갑상선 유두암은 비교적 온순한 생물학적인 속성을 보이며, 특히 갑상선 미세유두암은 매우 양호한 예후를 보인다. 갑상선 유두암 및 미세유두암은 경부 임파절 전이가 흔하며, 이러한 임파절 전이가 유두암의 국소 재발 여부 및 원격 전이에 가장 중요한 예후인자 중 하나이다. 본 연구에서는 진단당시 측경부 임파절 전이를 보이는 갑상선 미세유두암과 임파절 전이가 없는 미세유두암의 유전자 발현을 비교하여 광범위한 조기 임파절 전이에 관여하는 유전자를 찾고, 그 기능적 증거를 검증하고자 한다. 방법 신촌 세브란스 병원에서 수술받은 8명의 갑상선 미세유두암 환자의 신선 조직을 대상으로 하였다. 이중 3명은 경부 임파절 전이가 없는 갑상선 미세유두암이고, 5명은 진단 당시 측경부 임파절 전이가 동반된 미세유두암이었다. Illumina HumanHT-12 v4.0 Expression Beadchip 을 사용하여 대상 환자들의 암종 및 정상 갑상선 조직을 쌍으로 채취하여 RNA 를 추출, oligonucleotide microarray 분석을 시행하였다. independent t-test 을 시행하여 p<0.05 이며, 발현 정도가 1.5배수 이상 차이 나는 경우 유전자 발현의 차이가 있는 것으로 정의하였다. Microarray상 발현의 차이가 있는 유전자 중 상피배엽간 이행 및 암줄기 세포 표지자와 관련된 유전자를 선별하여 정량적 실시간 중합 효소 연쇄 반응, Western blotting 및 면역조직화학염색으로 검증하였다.55 결과 microarray 분석상 총 146의 probe, 131 개의 유전자가 발현양상의 차이를 보였다. 이중 107개의 유전자가 임파절 전이가 있는 미세유두암에서 과발현 되었으며, 24개의 유전자가 발현이 억제되었다. 발현의 차이가 나는 유전자들을 GO profile로 분석하였을 때 해당 유전자가 생물학적 과정 중 signaling, multicellular organism process, response to stimulus, developmental process, cell proliferation, death, locomotion, biological regulation 에 관여하였다. 상피배엽간 이행 및 암줄기 세포 표지자가 임파절 전이가 있는 군에서 의미있게 과발현 되었으며, IL1RL1, ALDH1A3, FGFBP1, TM4SF1, PROM1, CAV1, CCL18, TGIF1, SMAD3, CDCP1 등의 과발현이 실시간 중합효소 연쇄반응으로 검증되었다. Western b blotting에서 CAV1, TM4SF1 및 IL1RL1의 단백발현이 임파절 전이가 있는 군에서 의미있게 과발현되었다. 면역조직화학염색상 ALDH1A3 및 CAV1 의 발현이 임파절 전이가 있는 군에서 더 흔히 발견되었다. 결론 상피배엽간 이행 및 암줄기 세포 표지자와 관련된 유전자가 갑상선 미세유두암의 광범위한 조기 임파절 전이시 과발현 된다.