39-3 / J. Seo
• IMID 2009 DIGEST
Abstract
This experiment implemented a laser projection system that used the 2D MEMS scanner as the driving method for the display device. The 2D MEMS scanner, which can scan the images horizontally and vertically, was applied to drive the projection system using the interlaced scanning method. The laser was directly modulated to implement the grayscale and the images were WVGA resolution quality.
1. Introduction
Currently, the mobile phones and other various mobile multimedia products are changing to meet the increasing demands for a larger screen. In the case of the mobile phones, panels that are over 3 inches, such as LCD and OLED, are being used for the implementation of larger screens. However, there is a limitation to how large the panel can be since it is an LCD or OLED, as well as having difficulties with full web browsing when trying to read. In order to accommodate and resolve these issues, micro-displays such as DMD and LCoS and flying spot displays such as MEMS scanner are being used. Recently, the wide angle of the 2D MEMS scanner and the RGB laser sources are quickly undergoing technological advancement. The projectors that use the 2D MEMS scanner and the laser sources are starting to develop. The laser source has a better power of color expression and optical efficiency than other light sources. The displays that use the scanning methods consume less power and are more compact than the DMD and LCoS panel methods.
In this paper, we implemented a laser projection system using the 2D MEMS scanner and RGB lasers which is compact, low power consuming, and highly efficient.
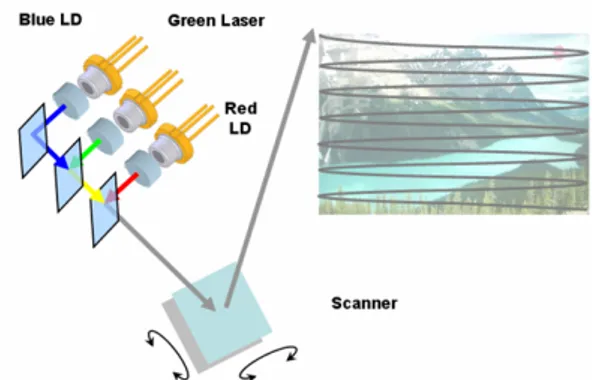
Fig. 1. Basic laser projection system
2. Experimental
This experiment implemented a scanning type of laser display system. Figure 1 shows the basic laser projection system. This laser projection system is consisted of RGB lasers that can be modulated by image signal, 2D MEMS scanner and control system to drive scanner and lasers.
2.1. Scanner driving
In this paper, the horizontal scanning has to be driven by the resonance frequency because of its high Q factor, while the vertical scanning is able to be forced driven at 60Hz.
(a) (b)
Fig. 2. Scanner driving waveform
(a) Sinusoidal waveform, (b) Ramp waveform
Laser projection system that uses a 2D MEMS scanner
JungHoon Seo, Jung Hwan Choi, Yongki Kim, Jongkwon Yi and Jaewook Kwon
LG Electronics, Woomyeon-Dong, Seocho-Gu, Seoul, Korea
Phone: +82-2-526-4524, E-mail: captain75@lge.com39-3 / J. Seo IMID 2009 DIGEST • 525 530 535 540 545 550 10-2 10-1 100 101 M echa n ic al Sc an Ang le ( d eg re es ) Frequency (Hz) (a) 17.960 17.980 18.000 18.020 18.040 100 101 Mech anic al Scan Ang le (d egrees) Frequency (kHz) (b)
Fig. 3. Scanner frequency response (a) Vertical response frequency, (b) Horizontal frequency
In Figure 2(a), in order to drive the scanner in the resonance frequency, the horizontal driving uses a sinusoidal waveform, while the vertical uses the ramp waveform as shown in Figure 2(b). Figure 3 shows correlation between resonance frequency and driving angle. Just as it is shown in Figure 3(b), if the horizontal scanning is driven by the resonance frequency, the driving angle can be increased and vice versa. There is no interference between vertical signal and horizontal signal due to frequency response.
2.2. Laser projection control system
In Figure 4, The FPGA receives the video data and video sync signals from the video source, which makes scanner driving sync signals and RGB lasers modulation video data. Using DACs, the scanner driving signals and laser modulation signals are generated.
A scanning type of display system has the time delay between scanner driving signals and lasers
Fig. 4. Laser projection system control block
modulation signals due to scanner response time. In
this system,the waveform data that was saved on the
internal ROM is synchronized with the scanner driving sync signals and laser video signals.
2.3. Interlaced scanning method
Generally, in the case of the progressive scanning method as shown in Figure 5(a), it has a gap between the scanning lines. In this experiment, we compensated this laser scanning issue by using the interlaced scanning method in Figure 5(b). Lasers are on with solid lines, however they are off with dashed lines as shown in Figure 5(c), (d). Figure 6 shows the interlaced scanning timing diagram. Only odd lines data are valid in the odd frame, while only even lines data are valid in the even frame. In order to implement the interlaced scanning, the start position of each frame needs to be changed. The horizontal movement direction of the MEMS scanner, whether from left to right or vice-versa, is 1 H line. When movement completes a full trip, it would be 2 H lines. Just as it is
(a) (b)
(c) (d)
Fig. 5. Scanning method.
(a) Progressive scanning, (b) Interlaced scanning, (c) Odd frame scanning, (d) Even frame scanning
39-3 / J. Seo
• IMID 2009 DIGEST
shown in Figure 7(a), the MEMS scanner is driven vertically by ramp waveform. The number of total horizontal lines in the display active time is an even number, while the number of total horizontal lines in the retrace time is an odd number. As shown in Figure 7 (b), if the number of horizontal lines in 1 frame is implemented as odd, the start point can be changed in each frame. The solid lines show scanning movement during the display active time, and the lasers are alternately on/off in each frame. The dash lines also show scanning movement during the retrace time, however, the lasers are always off. It can reduce the power consumption.
Fig. 6. Interlaced scanning timing diagram
(a)
(b)
Fig. 7. Interlaced scanning method (a) Vertical waveform,
(b) Horizontal scanner movement
3. Results and discussion
Figure 8 shows the projection image of this laser projection system on the screen. We also compensated the laser scanning issue of the gap between the scanning lines by using the interlaced scanning method. We can achieve the large 50 inches image with WVGA resolution. The volume of this optical engine is about 4cc. Projection distance is free. The brightness is about 7 lm because of the interlaced scanning method.
Fig. 8. Projection image
4. Summary
In this paper, we implemented a laser projection system using the 2D MEMS scanner and RGB lasers, which has compact size, low power consumption, free focus and high efficiency. So we expect that this system could be a truly portable pico-projector solution in the mobile applications.
5. References
1. Matthew S. Brennesholtz, SID’08 Technical Digest , p.858 (2008).
2. Ho-Chi Huang, Maro Jong, SID’09 Technical Digest, Vol 1, p.162 (2009)
3. Boris Ardashnikov, John Duncan, SID’08 Technical Digest, p.1089 (2008).