ICCAS2005 June 2-5, KINTEX, Gyeonggi-Do, Korea
1. INTRODUCTION
Thailand is known as a home to a large variety of fruits, both seasonal and all-year-round. Mango is one of the potential fruits for both local and international markets. Its industry plays an important role in the country’s export economy. It is grown in all regions but area of concentration is in the Central and Northeast. At present, mango production has greatly been developed through improved varieties to meet the consumer taste and preference. Overseas demand for Thai mango has steadily increased both in the forms of fresh and canned fruit. In grading mangoes for export, the farmers must examine all the harvested mature mangoes by eyes and hands. This is quite subjective. So, farmers need alternatives for sorting and grading mangoes since hand labor is costly and inaccurate. An automated mango sorting system could be more feasible.
In recent years, machine vision technology has become more potential and more important to many areas including agricultural industry. The uses of machine vision technology for quality inspection, classification, sorting, and grading agricultural products become more interest [1-3]. Runtz [4] developed a real-time plant recognition algorithm, which is able to distinguish between broadleaf and grassy plant species. It was then applied to build a sprayer control system. Later, Dave and Runtz [5] improved the methods and evaluated three image processing methods for their ability to identify species of plants. The study concluded texture analysis yields best result. Chapron et al. [6] proposed a multiresolution-based method for recognizing weeds in corn fields. They used a color camera, which provides four-band (R, G, B, IR) images, to capture agronomic scene. These multi-band images were processed to obtain color and geometrical features of the vegetation and soil. Bayesian networks was then used to recognize and classify the vegetal species. Recently, Cunha [7] showed another use of image processing approach in crop modeling. He developed a system that analyzes and models leaf images. Some other reports on fruit analysis include works of Njoroge et al. [8] and Gejima et al. [9]. The first developed an automated fruit grading system using color image processing and some special
censors. The latter used color image processing techniques in judging the maturity level of tomatoes. Both RGB and L*a*b* color metrics were used. The research concluded that the a* value of the tomato’s external surface color can be used as a maturity index.
In this project, we propose a vision system that can detect, segment, and analyze the mango’s physical properties such as size, shape, surface area, and color from images. First, the chromaticity of the sample mangoes is learned. The original RGB color image of a mango is transformed to HSI image. H dimension is then used to build the mango’s chromaticity model. After training, the input mango image is then segmented from the background image using chromaticity similarity. Some spatial morphology is applied to suppress the segmentation errors. We then apply a spline fitting to obtain smooth curve of mango boundary. From the segmented image, the mango projected area can be computed. The shape of the mango is then analyzed using some structuring models. Color is also spatially analyzed and indexed in the database for future classification. To obtain the surface area, the mango is peeled. The scanned image of its peels is then segmented and filtered using similar approach. With calibration parameters, the surface area could then be computed. We employed the system to evaluate physical properties of a mango cultivar called “Nam Dokmai”. There were sixty mangoes in three various sizes graded by an experienced farmer’s eyes and hands, twenty mangoes each size.
The general objective of this research is to investigate the potential of using image processing techniques on mango’s external physical analysis as an alternative or supplemental to the traditional manual method. The techniques could be extended and applied to analyze external physical properties of other agricultural products as well.
The organization of this paper is as follows: Section 2 describes our proposed methods in segmenting and analyzing the mango images. Section 3 discusses the experimental setup and results. Section 4 concludes the paper and addresses future works.
Physical Properties Analysis of Mango using Computer Vision
Panitnat Yimyam*, Thanarat Chalidabhongse*, Panmanas Sirisomboon**, and Suwanee Boonmung**
*Faculty of Information Technology, King Mongkut’s Institute of Technology Ladkrabang, Bangkok, Thailand (Tel: +66-2-737-2551; E-mail: [email protected], [email protected])
** Department of Agricultural Engineering, Faculty of Engineering, King Mongkut’s Institute of Technology
Ladkrabang, Bangkok, Thailand
(Tel : +66-2-737-3000 Ext.5120; E-mail: [email protected], [email protected])
Abstract: This paper describes image processing techniques that can detect, segment, and analyze the mango’s physical properties
such as size, shape, surface area, and color from images. First, images of mangoes taken by a digital camera are analyzed and segmented. The segmentation is done based on constructed hue model of the sample mangoes. Some morphological and filtering techniques are then applied to clean noises before fitting spline curve on the mango boundary. From the clean segmented image, the mango projected area can be computed. The shape of the mango is then analyzed using some structuring models. Color is also spatially analyzed and indexed in the database for future classification. To obtain the surface area, the mango is peeled. The scanned image of its peels is then segmented and filtered using similar approach. With calibration parameters, the surface area could then be computed. We employed the system to evaluate physical properties of a mango cultivar called “Nam Dokmai”. There were sixty mango samples in three various sizes graded by an experienced farmer’s eyes and hands. The results show the techniques could be a good alternative and more feasible method for grading mango comparing to human’s manual grading.
2. OUR APPROACH
In this section, we describe in details our methods in processing and analyzing mango images in order to extract their physical properties. We divide the section into three parts: first part discusses our image acquisition method and setup. The second part proposes image processing techniques used for segmenting mango image from the background image. The last part describes methods for computing mango physical properties.
2.1 Mango Images Acquisition
The image acquisition setting is shown in Fig.1. A digital camera is used to capture top-view image of the mango, which is placed on a back-and-white chessboard calibration grid. The image resolution is about 3 million pixels and saved in raw RGB format. The reason that we need that high resolution is that we want to measure accurate size. In addition, we plan to extend this work by reconstructing the 3D volume of mango using voxel crafting techniques on multiple-view images. The calibration grid is used for two purposes: to calibrate size, and to calibrate color. The normal illumination condition with white fluorescent lamps is used. Fig. 2 shows an obtained image.
2.2 Mango Image Segmentation
After acquiring all mango images, a set of images is randomly picked and used as a training set for building a mango’s surface chromaticity model. First, the original RGB color image is transformed to obtain hue value, H, according to this equation:
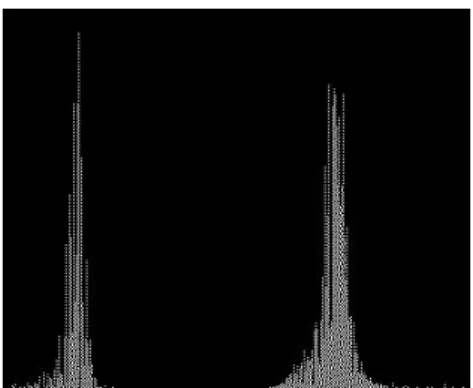
Mango pixel regions are segmented by hand from the training images. A mango’s surface hue model is then constructed using hue values computed from those pixels. This model is then used to segment mango region from the original input images using a simple chromaticity similarity. Fig. 3 shows hue histogram of an input image. Some spatial morphology such as closing and opening operations [10] are then applied to suppress the segmentation errors. The segmentation result is shown in Fig. 4.
Although the spatial filtering can eliminate most segmentation false, however, there is still some erroneous segmentation found along the edges of the mango (see Fig. 5). This could be due to the sampling effect and blurry image.
To smooth the mango region, spline curvature fitting using MATLAB function is then applied. The initial control points for spline fitting are extracted from preliminary boundary pixels. To do this, we first apply boundary detection algorithm [10] on the early segmented image. Then every nth boundary pixels are selected and used as initial control points. A cropped region of spline-fit mango image is shown in Fig. 6.
Fig. 1 Image acquisition setup.
Fig.2 Acquired input image of mango.
Fig. 3 Hue histogram of an input image.
Fig. 4 Segmented mango image
2.3 Physical Properties Analysis
After obtaining clean segmented mango region, we then further analyze the image to obtain some physical properties of the mangoes such as size, shape, area, and color. In this research, we define a set of parameters that are used to refer to mangoes’ physical properties as follows:
Projected area (A) is defined as the area of the 2D
projection image of the top view mango. This can be easily estimated by counting number of pixels inside the boundary. With the known calibration grid size, we can calculate the region area.
Length & Width: Mangoes’ shape and size can be
implied using their lengths and widths. Vasquez-Caicedo et al. [11] defined five mango size parameters as shown in Fig. 7. However, we found these parameters are very difficult to measure either by automate process or by hands. In this project we define two parameters; length L and width W as follows (see Fig. 8):
- Length (L) is defined as the distance between the pole and the tip of the mango. The line between the pole and the tip called mango’s major axis.
- Width (W) is defined as the maximum distance from a boundary pixel to another boundary pixel that is on the other side of the major axis, and the line between them, which is called mango’s minor axis, is perpendicular to the major axis.
To compute L and W, we first must find major and minor axes. We do this by computing angle of mango boundary pixels, i.e., angle between 3 points (Pi-30, Pi, Pi+30) where Pi is the ith boundary pixel. Then, the tip of the mango is the boundary pixel Pi that has global minimum angle. The pole of the mango is estimated by finding a boundary pixel Pi that has local minimum angle and is located about half of the mango perimeter from the tip. Once we get pole and tip, we can obtain major axis and its length, L. We then rotate the image
so that the major axis is lined horizontally. We then search for the minor axis. The minor axis is the line that is perpendicular to the major axis and has maximum distance measured between two boundary pixels that cross this line and be on the other side of the major axis. The maximum distance is the width W.
Color: Color can also be spatially analyzed and
indexed in the database for future classification. The color features are measured separately in five regions; northeast, southeast, southwest, and northwest of the major and minor axes, and at the center where major and minor axes intersected as shown in Fig.9. We keep the color model in RGB as it is original color space when acquiring image, and it is easily to transform to other color metrics when needed.
Surface area (S) is defined as the area of the surface of
mango in 3D. To measure surface area of the mango, all the mangoes were peeled using hand peelers. The peels images are then captured and digitized using a scanner at 300dpi. The image is then binarized, where white pixels correspond to mango peel and black pixels correspond to background. However, the image obtaining from scanner is not clean. A salt-and-pepper noise reduction technique must be applied. Fig. 10 shows the clean binary mango peel image. Then, the white pixels are counted and the area of the surface can be estimated using the known calibration grid size.
3. EXPERIMENTS AND RESULTS
The proposed algorithms mentioned in the previous section were implemented in C/C++ and MATLAB on a typical PC. For image acquisition, a scanner and a 3 Mega-pixel digital camera connected to the PC are used. We employed the system to evaluate physical properties of a mango cultivar called “Nam Dokmai”. Sixty mango samples were obtained from a local mango farm in Chachoengsao, a province in Central of Thailand. The mangoes were harvested at the same maturity as they are harvested for export. There are Fig. 6 Result after spline fit.
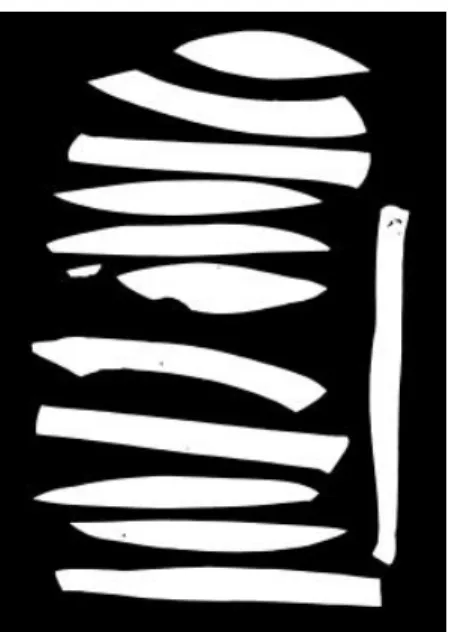
Fig. 7 Mango size parameters defined by Vasquez-Caicedo et al. [11]. pole tip L W Minor axis Major axis
Fig. 8 The proposed mango size parameters.
three various sizes: Small, Medium, and Large, twenty mangoes each size. They were graded by an experienced farmer’s eyes and hands.
After obtaining the mangoes, we captured their images using setup as shown in Fig.1 with a Kodak CX6330 digital camera. Each mango is placed on a black-and-white chessboard calibration grid with 5mm x 5mm grid size (see Fig. 2). To measure 3D surface area of the mango, all the mangoes were peeled by hands. The peels of each mango were laid down on a transparent sheet and covered by a black plastic box. They were then scanned by a scanner (HP Scanjet3500c Series) at 300dpi resolution. The image is then binarized, where white pixels correspond to mango peel and black pixels correspond to background.
All the 60 top-view mango images were then processed according to the algorithms explained in previous section to obtain projected area, length, width, and color. Another 60 scanned image of mango peels were also processed and the 3D surface areas were computed. The results show in Table 1.
Table 1 Physical properties of “Nam Dokmai” in three size.
Small Medium Large
Paramet ers
µ
σ µ σ µ σ S (cm2) 213.95 6.44 232.72 7.15 260.07 12.50 A (cm2) 60.26 2.50 67.18 2.86 75.22 3.77 L (cm) 12.60 0.44 13.46 0.47 14.12 0.59 W (cm) 6.58 0.21 6.90 0.19 7.31 0.21For color analysis, we segmented projected image of mango into 5 regions as shown in Fig.9. Each region was then analyzed and its average color in R,G,B was recorded. This spatial color information is indexed in the database for future classification. Table 2 shows the color in each region of the sixty mangoes. The results demonstrate that the color spatial distribution is not related to its size.
Table 2 Color of “Nam Dokmai” at various positions.
Small Medium Large
Region
(
µ
R,
µ
G,
µ
B) (
µ
R,
µ
G,
µ
B) (
µ
R,
µ
G,
µ
B)
1 (178,173,135) (181,175,139) (175,171,136) 2 (193,183,139) (194,185,144) (191,186,148) 3 (195,187,144) (196,191,148) (189,185,146) 4 (214,201,158) (212,202,160) (210,203,166) 5 (219,210,166) (217,211,168) (212,208,168)4. CONCLUSIONS AND FUTURE WORKS
We have described image processing techniques that can detect, segment, and analyze the mango’s external physical properties. Some parameters are defined and calculated from the segmented mango images. These include 2D projected area, 2D projected length, 2D projected width, and 3D surface area. Color is also measured and modeled spatially. Sixty “Nam Dokmai” cultivar mangoes in three sizes (S, M, L) were evaluated. Their physical properties parameters were recorded. The results show the techniques could be a good alternative and more feasible method for grading mango comparing to human’s manual grading.To extend the work, we plan to work with multiple-view mango images. The goal is to estimate 3D volumetric of the mango. This would be done using voxel crafting technique. Once the 3D volume is constructed, we can estimate the 3D size, shape as well as the volume more precisely.
REFERENCES
[1] A. Milella, G.Reina, M. Foglia, and A. Gentile, “Computer Vision Applications in Agricultural Robotics”, Proc. 11th IEEE Intl’ Conf. on Mechatronics and Machine Vision in Practice, Macau, 2004.
[2] YR. Chen, “Future Trends of Machine Vision Technology for Agricultural Applicatioins”, Proc. Intl’ Conf. on Engineering and Technological Science (ICETS2000), China, 2000.
[3] W. Lu and S. Da-Wen, “Computer Vision Systems for Rapid Quality Inspection of Agricultural and Food Products”, Proc. Intl’ Conf. on Engineering and Technological Science (ICETS2000), China, 2000. [4] K.J. Runtz, “Electronic Recognition of Plant Species for
Machine Vision Sprayer Control Systems”, Proc. IEEE Western Canada Conference on Computer, Power, and Communication Systems in a Rural Environment (WESCANEX’91), pp. 84-88, 1991.
[5] S. Dave, K. Runtz, “Image Processing Methods for Identifying Species of Plants,” Proc. IEEE Western Canada Conference on Computer, Power, and Communication Systems in a Rural Environment (WESCANEX’95), pp. 403-408, 1995.
[6] M. Chapron, P. Boissard, and L. Assemat, “A Multiresolution Based Method for Recognizing Weeds in Corn Fields,” Proc. 15th Intl’ Conf. on Pattern Recognition (ICPR’2000), pp. 303-306, 2000.
[7] J. B. Cunha, “Application of Image Processing Techniques in the Characterization of Plant Leafs,” Proc. IEEE Intl’ Symposium on Industrial Electronics, 2003. Fig. 10 Image of mango peels after noise cleaning.
[8] J.B. Njoroge, K. Ninomiya, N. Kondo, and H. Toita, “Automated Fruit Grading System using Image Processing”, Proc. SICE Annual Conference (SICE2002), Japan, 2002.
[9] Y. Gejima, H. Zhang, and M. Nagata, “Judgement on Level of Maturity for Tomato Quality Using L*a*b* Color Image Processing”, Proc. the 2003 IEEE/ASME Intl’ Conf. on Advanced Intelligent Mechatronics (AIM 2003), 2003.
[10] Shapiro and Stockman, “Computer Vision”, Prentice Hall, 2001.
[11] A.L. Vasquez-Caicedo, S. Neidhart, P. Pathomrungsiyounggul, P. Wiriyacharee, A. Chattracul,P. Sruamsiri, P. Manochai, F. Bangerth, R. Carle, “Physical, Chemical, and Sensory Properties of Nine Thai Mango Cultivars and Evaluation of their Technological and Nutritional Potential”, Proc. Intl’. Symposium Sustaining Food Security and Managing Natural Resources in Southeast Asia, Thailand, 2002.
![Fig. 7 Mango size parameters defined by Vasquez-Caicedo et al. [11]. pole tip L W Minor axis Major axis](https://thumb-ap.123doks.com/thumbv2/123dokinfo/4891812.37133/3.892.85.415.111.239/fig-mango-parameters-defined-vasquez-caicedo-minor-major.webp)