DOI 10.3349/ymj.2008.49.1.63
Purpose: The objective of this study was to determine whether the progressive increase of metabolic syndrome (MetS) score, the number of components of MetS, is correlated significantly with increasing pulse pressure (PP). Materials and Methods: 4,034 subjects were enrolled from the Cardiovascular Genome Center of Yonsei University (M : F = 2344: 1690, 55.2 ± 10.5). Most of the study population were recruited from hypertension clinics, controlled with medications according to JNC7 guidelines. The Asian modified criteria of MetS were applied and MetS score was estimated. The HOMA index for insulin resistance, cholesterol profiles, and anthropometric measurements were assessed. Results: Among 4034 participants, 1690 (41.9%) were classified as MetS. Progressive increase in PP was demonstrated for increasing components of the MetS score. Multiple linear regression analysis with PP as the dependent variable showed that age (β = 0.311, p < 0.001), MetS score (β = 0.226, p < 0.001), male gender (β = -0.093, p < 0.001) and HOMA index IR (β = 0.033, p = 0.03) are significantly associated with PP (R2= 0.207, p < 0.001). Conclusion: The present results from this study demonstrate that increasing MetS score is an independent determinant of increasing PP. The results also demonstrate the independent role of MetS in increasing arterial stiffness and PP. Key Words: Metabolic syndrome, pulse pressure, arterial stiffness, metabolic syndrome scores
INTRODUCTION
The pulse pressure (PP), the difference between
systolic blood pressure (SBP) and diastolic blood pressure (DBP), is known to be an important predictor of cardiovascular and cerebrovascular mortality in both hypertensive and normotensive populations.1-3
PP is determined by ventricular interaction with the elastic properties of the large arteries and the magnitude of wave reflection.1,2,4 Therefore, the increase in PP is determined primarily by the increase in large arterial stiffness.3 Recent epide-miologic studies have demonstrated that the increase in PP is independently associated with adverse cardiovascular events.1-3 Therefore, clinical
determinants associated with increasing PP may have clinical significance.
Studies have shown that obesity and the presence of MetS are associated with increasing arterial stiffness.5-9 Endothelial dysfunction,
in-sulin resistance, atherogenic alterations, neurohor-monal abnormalities and hypercoagulability are some of the factors that contribute to the increased arterial stiffness in MetS.5
Therefore, the objective of this study was to determine whether the progressive increase in MetS score, the number of components of metabolic syndrome, is significantly correlated with increase in PP.
MATERIALS AND METHODS
Patient population
The study group consisted of 4,034 subjects who were enrolled at the Yonsei Cardiovascular
Increase of Metabolic Syndrome Score is an Independent
Determinant of Increasing Pulse Pressure
Jae-Youn Moon,1 Sungha Park,2,3Chul Min Ahn,2 Jung Rae Cho,2Chan Mi Park,3Young-Guk Ko,2 Donghoon Choi,2 Myung Ho Jeong,1 Yangsoo Jang,2,3 and Namsik Chung2
1The Heart Center, Chonnam National University Hospital, Gwangju, 2Division of Cardiology,3Cardiovascular Genome Center,
Cardiovascular Hospital, Yonsei University College of Medicine, Seoul, Korea.
Received July 18, 2007 Accepted September 13, 2007
This work was supported by grant (A000385) from the Ministry of Health and Welfare, Republic of Korea, and by a grant of the Seoul R &BD Program, Republic of Korea (10526).
Reprint address: requests to Dr. Sungha Park, Division of Cardio-logy, Yonsei Cardiovascular Center, Yonsei University College of Medicine, 250 Seongsanno, Seodaemun-gu, Seoul 120-752, Korea. Tel: 82-2-2228-8455, Fax: 82-2-393-2041, E-mail: [email protected]
HOMA (homeostasis model assessment of insulin resistance) index
= Fasting insulin ( IU/mL)μ × Fasting glycemia (mmol/L)
22.5
Genome center (men: 2,344. women: 1,690. mean age: 55.2 ± 10.5). The Cardiovascular Genome Center is a Korean government-sponsored research project, whose objective is to determine the genetic factors that are associated with the development of cardiovascular disease in a large prospective Korean cohort. Most of the study populations were recruited from the hypertension outpatient clinic, and their blood pressure was controlled with medications according to JNC7 guidelines.10 The rest of subjects were composed
of populations who presented for a routine health status check up at Yonsei Cardiovascular Center. The blood pressure of hypertension patients was presented as normal subjects because of proper medications. Our database contained information about all the constituents of the MetS, and bio-chemical risk factors for coronary artery disease (CAD). Subjects were asked to refrain from per-forming strenuous exercise or drinking alcoholic beverages 24 hours before the laboratory test. They were also instructed to avoid eating or drinking anything during the test except water. Written informed consent was obtained from all subjects, and the protocol was approved by the Institutional Review Board of Yonsei University College of Medicine.
Blood collection and assessment of insulin resistance
Blood samples were taken from the forearm after at least 12 hours of fasting and collected into EDTA-treated and plain tubes. The serum glucose levels were determined by using the enzymatic method (Hitach 7600 - 110, Hitachi Co., Tokyo, Japan), and the insulin concentration with an immunoradiometric assay (Biosource, Nivelles, Belgium) with intra- and inter-assay coefficients of variation of 2.1 - 4.5% and 4.7 - 12.2%, respectively. The status of insulin resistance was measured using the homeostasis model assessment of insulin resistance index (HOMA index) with the following formula;
The serum apolipoprotein A1 and B were
deter-mined by using Immuno-turbidometric analyzer at 340 nm with a specific antiserum (Cobas Integra Roche, USA, Rotkreuz, Switzerland).
The analysis of total cholesterol and trigly-cerides was based on an enzymatic method (Hitachi 7600 - 110, Hitachi Co., Tokyo, Japan). After precipitation of serum chylomicron, low density lipoprotein-cholesterol (LDL-C), and very low density lipoprotein (VLDL) with dextran sulfate-magnesium, and high density lipoprotein-cholesterol (HDL-C) remaining in the supernatant fluid was measured by using an enzymatic method (Hitachi 7600-110, Hitachi Co., Tokyo, Japan). The LDL-C level was calculated using the Friedewald formula with serum triglyceride concentrations < 4.52 mol/L (400 mg/dL).11
Anthropometric and blood pressure measurements
The body weight, waist circumferences and height were measured in the morning. Body mass index (BMI) was calculated by dividing body weight (in kg) by height2 (in m). Blood pressure
was read from the left arm while subjects remained seated. Readings of SBP and DBP were taken in the supported left arm of the seated subject after 5 minutes of quiet rest, with a mercury column sphygmomanometer with cuff-size adjustment based on arm circumference. Baseline of each SBP and DBP each was average of 3 separate measure-ments taken by the examining physician.
Classification of metabolic status (modified NCEP criteria for Asian)
The National Cholesterol Education Program (NCEP) Adult Treatment Panel III (ATP III) guide-lines12,13 classify individuals as having the MetS if
they possess three or more of the following criteria:
Central obesity:The World Health Organization (WHO) has recognized the disproportionate contribution of obesity to the development of cardiovascular risk factors in Asians and has provisionally lowered the classifica-tion of central obesity to > 80 or > 90 cm in females and males
High blood pressure:If patient’s systolic and/or diastolic blood pressures were 130/85 mmHg or patients were
Statistical analysis
Values were expressed as mean ± SD. Statistical analysis was performed with SPSS version 13.0 for WINDOWS (SPSS Inc, Chicago, IL, USA) for descriptive statistics. Linear regression analysis was performed using the variables significant in bivariate analysis as the candidate variables and
PP as a dependent variable.
In model 1, the MetS score (the number of components) was entered along with age, gender, smoking habits, and LDL cholesterol. In model 2, the MetS score was entered with age, gender, smoking habits, LDL cholesterol, and HOMA index. A two-tailed value of p < 0.05 was con-sidered statistically significant.
RESULTS
Clinical characteristics in relation to MetS score
The study population consisted of 4,034 subjects (men: 2,344. women: 1,690. mean age: 55.2 ± 10.5). Table 1 describes the general clinical features of subjects included in the study and the distribution of subjects with a 0 to 5 MetS score [MetS score receiving blood pressure lowering drugs.
Hyperglycemia: Fasting plasma glucose 6.1 mmol/L (110 mg/dL) or patients were receiving glucose lowering drugs.
Low HDL-cholesterol (HDL-C): Fasting HDL-C < 1.04 or 1.29 mmol/L (40 or 50 mg/dL) in males and females, respectively.
Hypertriglyceridemia: Fasting plasma triglycerides 1.69 mmol/L (150 mg/dL).
Table 1. Clinical Characteristics of Subjects in Relation to MetS Score
Number of components of metabolic syndrome (MetS score) Total 0 (n = 525) 1 (n = 833) 2 (n = 986) 3 (n = 968) 4 (n = 572) 5 (n = 150) (n = 4034) Age* (yrs) 52.6 ± 10.1 53.3 ± 10.7 55.3 ± 10.3 56.4 ± 10.2 57.5 ± 10.5 58.8 ± 9.3 55.2 ± 10.5 Hypertension* 0 (0%) 277 (33.3%) 463 (47.0%) 572 (59.1%) 373 (65.2%) 80 (53.3%) 1765 (43.8%) Smoking (%) 175 (33.5%) 175 (21.1%) 183 (18.6%) 179 (18.5%) 88 (15.4%) 23 (15.3%) 823 (20.4%) Waist* (cm) 78.3 ± 6.4 81.5 ± 7.3 86.7 ± 7.7 89.8 ± 7.9 92.8 ± 7.2 93.9 ± 6.7 86.4 ± 8.9 BMI (Kg/m2) 22.1 ± 2.4 23.1 ± 2.5 24.5 ± 2.7 25.5 ± 2.8 26.2 ± 2.8 26.7 ± 2.8 24.5 ± 3.0 SBP* (mmHg) 108.9 ± 9.6 118.9 ± 17.0 124.7 ± 17.9 128.0 ± 18.8 131.8 ± 18.4 132.3 ± 18.9 123.5 ± 18.6 DBP* (mmHg) 72.0 ± 7.4 76.9 ± 10.8 79.5 ± 10.7 80.2 ± 10.9 81.3 ± 11.1 80.0 ± 10.3 78.4 ± 10.8 PP* (mmHg) 36.8 ± 7.6 42.0 ± 12.1 45.2 ± 12.8 47.8 ± 14.2 50.5 ± 14.3 52.3 ± 16.9 45.1 ± 13.6 TG* (mg/dL) 89.4 ± 28.7 109.2 ± 60.3 135.9 ± 74.1 178.8 ± 103.8 222.1 ± 93.2 295.5 ± 234.9 152.8 ± 103.1 LDL-C (mg/dL) 118.2 ± 31.1 120.2 ± 32.1 122.9 ± 35.2 122.4 ± 37.3 121.6 ± 39.4 123.1 ± 43.0 121.4 ± 35.5 HDL-C* (mg/dL) 54.1 ± 10.5 50.7 ± 11.6 45.4 ± 11.3 40.8 ± 10.0 37.4 ± 8.7 34.7 ± 6.6 45.0 ± 12.0 TG/HDL-C* 1.73 ± 0.69 2.29 ± 1.41 3.26 ± 2.21 4.69 ± 3.22 6.40 ± 3.65 9.04 ± 8.02 3.86 ± 3.42 ApoA1* (mg/dL) 143.3 ± 20.6 140.5 ± 23.9 133.7 ± 25.2 128.3 ± 24.3 125.9 ± 20.9 123.4 ± 18.6 132.4 ± 24.2 ApoB* (mg/dL) 76.8 ± 20.1 80.4 ± 20.7 86.9 ± 22.3 92.9 ± 22.7 97.5 ± 24.1 101.8 ± 27.0 89.0 ± 23.5 ApoB/apoA1* 0.55 ± 0.15 0.59 ± 0.17 0.67 ± 0.20 0.74 ± 0.20 0.79 ± 0.21 0.83 ± 0.23 0.70 ± 0.21 Fasting glc* (mg/dL) 83.6 ± 8.3 85.9 ± 12.0 89.4 ± 17.2 94.1 ± 24.1 101.1 ± 28.9 142.1 ± 52.4 92.7 ± 24.4 Insulin* ( IU/mL)μ 6.41 ± 5.88 7.59 ± 5.18 8.43 ± 4.34 9.72 ± 5.46 11.59 ± 7.51 14.29 ± 10.78 8.97 ± 6.13 HOMA index* 1.33 ± 1.27 1.62 ± 1.15 1.86 ± 1.01 2.29 ± 1.61 2.99 ± 2.85 5.26 ± 5.43 2.13 ± 2.06 Statin (%) 28 (5.3%) 118 (14.2%) 170 (14.2%) 214 (22.1%) 132 (23.1%) 46 (30.7%) 708 (17.6%) Fibrates (%) 0 (0%) 10 (1.2%) 19 (1.9%) 26 (2.7%) 13 (2.3%) 10 (6.7%) 78 (1.9%)
*p value < 0.05 between groups.
BMI, body mass index; SBP, systolic blood pressure; DBP, diastolic blood pressure; PP, pulse pressure; TG, triglycerides; LDL-C, LDL-cholesterol; HDL-C, HDL-cholesterol; apoA1, apolipoproteinA1; apoB, apolipoproteinB; fasting glc, fasting glucose.
0 (n = 525), 1 (n = 833), 2 (n = 986), 3 (n = 968), 4 (n = 572), 5 (n = 150)]. As expected, the values of all of the anthropometric, metabolic, serum lipo-protein and marker of insulin resistance variables, except LDL cholesterol levels, were significantly different between the subjects with different MetS scores. Subjects with increasing MetS scores were associated with an increase in age, waist line, BMI, SBP, DBP, TG, apoB, fasting glucose, insulin, and HOMA index. A clear relation was evident between the MetS score and the degree of insulin resistance and hyperglycemia.
As MetS score increased, so did HOMA index, which is a marker of increased insulin resistance. As the number of components of the MetS rose, the prevalence of hypertension also increased. No difference was noted in the serum levels of LDL cholesterol and the prevalence of current smokers. The prevalence of NCEP Asian modified MetS ( 3 metabolic components) was 41.9% (men: 35.5%, women: 50.8%) in the study group. PP was dif-ferent between the subjects with and without MetS (without MetS: 42.2 ± 12.0 mmHg vs with MetS: 49.1 ± 14.6 mmHg, p < 0.001). The prevalence of MetS according to age group is shown in Table 2.
Effects of MetS score on pulse pressure
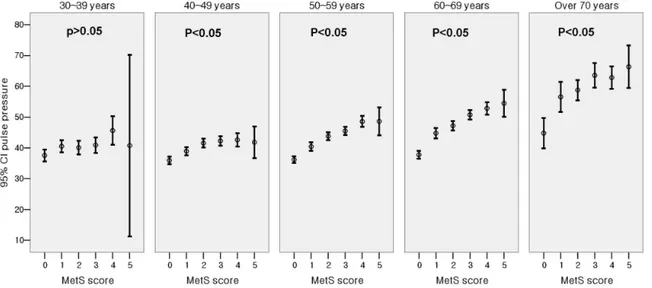
Fig. 1 shows the significant difference in the level of PP for subjects with different MetS score (Score 0: 36.8 ± 7.6 mmHg, Score 1: 42.0 ± 12.1 mmHg, Score 2: 45.2 ± 12.8 mmHg, Score 3: 47.8 ± 14.2 mmHg, Score 4: 50.5 ± 14.3 mmHg, Score 5: 52.3 ± 16.9 mmHg, p < 0.001 by one-way ANOVA analysis). When the subjects were divided into 5 groups according to age and MetS score, PP showed a progressive increase as the MetS score
increased within each age group (Fig. 2). The slope of the elevation showed steep increase in the patients over the age of 50. Also, the HOMA index demonstrated a pattern of increase according to increasing PP in each age groups as well (Fig. 3). After adjustment for age and hypertension, insulin resistance, which was measured by HOMA index, was also correlated with PP (correlation coefficient = 0.074, p < 0.01). We investigated whether in-creased MetS scores were independently associated with an increase in PP. Linear regression was performed using the variables significant in bivariate analysis as the candidate variables and PP as a dependent variable, and we found asso-ciations of MetS score with PP while controlling for classical cardiovascular risk factors (smoking, age, gender, LDL-C). Cardiovascular risk factors that are components of MetS, such as the presence of hypertension, triglycerides, HDL and obesity,
Table 2. Prevalence of Metabolic Syndrome (Total and Women Group) 30 - 39 yrs
(n = 299) 40 - 49 yrs(n = 896) 50 - 59 yrs(n = 1348) 60 - 69 yrs(n = 299) 70 - 79 yrs(n = 299) Total Men (n = 2,344) (36.4%)60/165 206/563(36.6%) 265/777(34.1%) 249/716(34.8%) (41.4%)51/123 831/2344(35.5%) Women (n = 1,690) (23.1%)31/134 106/333(31.8%) 300/571(52.5%) 296/469(63.1%) 126/183(68.9%) 859/1690(50.8%) Total 91/299 (30.4%) 312/896(34.8%) 565/1348(41.9%) 545/1185(46.0%) 177/306(57.8%) 1,690/4,034(41.9%)
Fig. 1.Difference of pulse pressure in relation to metabolic syndrome score (Score 0: 36.8 ± 7.6; Score 1: 42.0 ± 12.1; Score 2: 45.2 ± 12.8; Score 3: 47.8 ± 14.2; Score 4: 50.5 ± 14.3; Score 5: 52.3 ± 16.9).
were not entered in the analysis due to colline-arity.
When age, gender, smoking history, serum LDL-C, MetS score, and HOMA index were entered into the model, the independent predictors of PP were age (β = 0.311, p < 0.001), MetS score (β = 0.226, p < 0.001), male gender (β = - 0.093, p < 0.001) and HOMA index (β = 0.033, p = 0.03) with a model R2= 0.207 (p < 0.001)(Table 3).
DISCUSSION
The main finding from this study is that an increase in MetS score is correlated with an increase in PP. Furthermore, we found that MetS score itself was an independent predictor of increase in PP, and that an increasing degree of MetS score is associated with an increase in the parameter of insulin resistance, such as HOMA index.
Fig. 2. Difference of pulse pressure in relation to metabolic syndrome score (in age groups).
MetS and increasing arterial stiffness
MetS is recognized as a cluster of cardiovas-cular risk factors that frequently coincides with insulin resistance and hyperglycemia. Previous studies showed that obesity and the presence of MetS are associated with increasing arterial stif-fness.5-9 Moreover, the independent association
between vascular structure with function and each component of MetS has previously been reported.8
In the present study, regression analysis revealed that an increase of MetS score was proportionately related to an increase in PP, demonstrating that increasing component of MetS is a determinant of increasing PP, irrespective of age. Because tradi-tional risk factors of cardiovascular disease are known to be associated with increasing degree of arteriosclerosis, the clustering of risk factors in patients with MetS may be one of the important factors for the elevation in arterial stiffness and subsequent increase in PP.14-16 However, the effect
of MetS is more than the sum of its parts, with each components acting synergistically in the development of cardiovascular disesase.17,18 In a cross sectional analysis of the Baltimore Longitudi-nal Study of Aging (BLSA), the clustering of components of MetS exerted a synergistic effect
on vascular stiffness that was more than the effect of individual components of MetS.8 MetS is
associated with an increase in sympathetic and neurohormonal activation, endothelial dysfunction and increasing degree of insulin resistance which may act in concert to increase arterial stiffness and PP.5,19,20
Vascular inflammation is also an important determinant of increasing arterial stiffness with an increase in serum high sensitivity C-reactive protein (hsCRP) that is associated with increase in pulse wave velocity.21 Inflammation plays a key role in the development of complications in metabolic syndrome, and hsCRP is known to be significantly correlated with each component of metabolic syndrome as well as degree of insulin resistance.22-24 Therefore, an increasing degree of
vascular inflammation may be important in increasing arterial stiffness and PP in patients with MetS.
Mechanisms of correlations between insulin resistance and arterial stiffness
An interesting finding from this study is the progressive increase in insulin resistance that is associated with increase in PP. This finding was Table 3. Multiple Regression Models Evaluating the Independent Determinants of PP
Model 1: R2= 0.206, p < 0.001
B Beta 95% CI for Unstandardized B p value
Age 0.401 0.310 0.365 ~ 0.438 < 0.001
MetS score 2.396 0.238 2.105 ~ 2.678 < 0.001
Men - 2.525 - 0.092 - 3.668 ~ - 1.383 < 0.001
LDL cholesterol level 0.010 0.027 - 0.001 ~ 0.021 0.063
Smoking habits - 0.775 - 0.029 - 1.883 ~ 0.333 0.170
Model 2 (Model A + HOMA index): R2= 0.207, p < 0.001
B Beta 95% CI for Unstandardized B p value
Age 0.402 0.311 0.365 ~ 0.438 < 0.001 MetS score 2.282 0.226 1.973 ~ 2.590 < 0.001 Men - 2.557 - 0.093 - 3.699 ~ - 1.415 < 0.001 HOMA index 0.231 0.033 0.023 ~ 0.440 0.030 LDL cholesterol level 0.010 0.026 - 0.001 ~ 0.021 0.077 Smoking habits - 0.790 - 0.029 - 1.897 ~ 0.317 0.162
demonstrated in all age groups, except for the subgroup of patients over 70 years. Insulin resist-ance is known to be associated with increasing arterial stiffness.25 Although the mechanism
underlying this association is not clearly defined, insulin resistance state is associated with decreased endothelial dependent arterial compliance.25 Also,
insulin is known to diminish wave reflection the effect of which is blunted in obese, insulin resistance state,26 and regression analysis which
HOMA index in the equation demonstrated that insulin resistance is independently associated with increase in PP. (Table 3, model 2) However, the addition of HOMA index to the regression model resulted in weak contribution of insulin resistance to pulse pressure with an increase of R2 from
0.206 to 0.207 (Table 3). Therefore, the clustering of components of MetS that exerts a synergistic effect on vascular stiffness may be more important in increasing pulse pressure than insulin resist-ance itself.
The prevalence of MetS in this study population was relatively high due to the fact that the study population consisted of a high proportion of patients with a history of cardiovascular disease and hypertension. Also, many patients consented to enroll at the cardiovascular genome center due to health concerns. Therefore, the prevalence of MetS in our data does not reflect that of the general population. Furthermore, blood pressure and PP in this study were relatively low, and the reason appeared to be that many of the patients in the study group were being administered with antihypertensive medications. Nevertheless, this would not diminish the clinical impact of this study since PP is a significant predictor for car-diovascular risk in treated hypertensive patients as well.27
REFERENCES
1. Franklin SS, Khan SA, Wong ND, Larson MG, Levy D. Is pulse pressure useful in predicting risk for coronary heart Disease? The Framingham heart study. Circula-tion 1999;100:354-60.
2. Blacher J, Staessen JA, Girerd X, Gasowski J, Thijs L, Liu L, et al. Pulse pressure not mean pressure determines cardiovascular risk in older hypertensive patients. Arch Intern Med 2000;160:1085-9.
3. Benetos A, Safar M, Rudnichi A, Smulyan H, Richard JL, Ducimetieère P, et al. Pulse pressure: a predictor of long-term cardiovascular mortality in a French male population. Hypertension 1997;30:1410-5.
4. Nichols WW, Nicolini FA, Pepine CJ. Determinants of isolated systolic hypertension in the elderly. J Hypertens Suppl 1992;10:S73-7.
5. Grassi G, Giannattasio C. Obesity and vascular stiffness: when body fat has an adverse impact on arterial dynamics. J Hypertens 2005;23:1789-91. 6. Czernichow S, Bertrais S, Blacher J, Oppert JM, Galan
P, Ducimetière P, et al. Metabolic syndrome in relation to structure and function of large arteries: a pre-dominant effect of blood pressure. A report from the SU.VI.MAX. Vascular Study. Am J Hypertens 2005;18: 1154-60.
7. Schillaci G, Pirro M, Vaudo G, Mannarino MR, Savarese G, Pucci G, et al. Metabolic syndrome is associated with aortic stiffness in untreated essential hypertension. Hypertension 2005;45:1078-82.
8. Scuteri A, Najjar SS, Muller DC, Andres R, Hougaku H, Metter EJ, et al. Metabolic syndrome amplifies the age-associated increases in vascular thickness and stiffness. J Am Coll Cardiol 2004;43:1388-95.
9. Sutton-Tyrrell K, Newman A, Simonsick EM, Havlik R, Pahor M, Lakatta E, et al. Aortic stiffness is associated with visceral adiposity in older adults enrolled in the study of health, aging, and body composition. Hyper-tension 2001;38:429-33.
10. Chobanian AV, Bakris GL, Black HR, Cushman WC, Green LA, Izzo JL Jr, et al. Seventh report of the Joint National Committee on Prevention, Detection, Evalua-tion, and Treatment of High Blood Pressure. Hyperten-sion 2003;42:1206-52.
11. Friedewald WT, Levy RI, Fredrickson DS. Estimation of the concentration of low-density lipoprotein cholesterol in plasma, without use of the preparative ultra-centrifuge. Clin Chem 1972;18:499-502.
12. Executive Summary of The Third Report of The Natio-nal Cholesterol Education Program (NCEP) Expert Panel on Detection, Evaluation, And Treatment of High Blood Cholesterol In Adults (Adult Treatment Panel III). JAMA 2001;285:2486-97.
13. Kim HC, Choi KS, Jang YH, Shin HW, Kim DJ. Normal serum aminotransferase levels and the metabolic syndrome: Korean National Health and Nutrition Examination Surveys. Yonsei Med J 2006;47:542-50. 14. Wilkinson IB, Prasad K, Hall IR, Thomas A,
MacCallum H, Webb DJ, et al. Increased central pulse pressure and augmentation index in subjects with hypercholesterolemia. J Am Coll Cardiol 2002;39:1005-11.
15. Mahmud A, Feely J. Effect of smoking on arterial stiff-ness and pulse pressure amplification. Hypertension 2003;41:183-7.
16. Schram MT, Henry RM, van Dijk RA, Kostense PJ, Dekker JM, Nijpels G, et al. Increased central artery stiffness in impaired glucose metabolism and type 2
diabetes: the Hoorn Study. Hypertension 2004;43:176-81.
17. Grandi AM, Maresca AM, Giudici E, Laurita E, Marchesi C, Solbiati F, et al. Metabolic syndrome and morphofunctional characteristics of the left ventricle in clinically hypertensive nondiabetic subjects. Am J Hypertens 2006;19:199-205.
18. Reilly MP, Rader DJ. The metabolic syndrome: more than the sum of its parts? Circulation 2003;108:1546-51. 19. Kosch M, Barenbrock M, Kisters K, Rahn KH, Hausberg M. Relationship between muscle sympathetic nerve activity and large artery mechanical vessel wall properties in renal transplant patients. J Hypertens 2002;20:501-8.
20. Westerbacka J, Seppälä-Lindroos A, Yki-Järvinen H. Resistance to acute insulin induced decreases in large artery stiffness accompanies the insulin resistance syndrome. J Clin Endocrinol Metab 2001;86:5262-8. 21. Nagano M, Nakamura M, Sato K, Tanaka F, Segawa T,
Hiramori K. Association between serum C-reactive protein levels and pulse wave velocity: a population-based cross-sectional study in a general population. Atherosclerosis 2005;180:189-95.
22. Ridker PM, Wilson PW, Grundy SM. Should C-reactive protein be added to metabolic syndrome and to assessment of global cardiovascular risk? Circulation 2004;109:2818-25.
23. Festa A, D'Agostino R Jr, Howard G, Mykkänen L, Tracy RP, Haffner SM. Chronic subclinical inflam-mation as part of the insulin resistance syndrome: the Insulin Resistance Atherosclerosis Study (IRAS). Circulation 2000;102:42-7.
24. Ridker PM, Buring JE, Cook NR, Rifai N. C-reactive protein, the metabolic syndrome, and risk of incident cardiovascular events: an 8-year follow-up of 14 719 initially healthy American women. Circulation 2003; 107:391-7.
25. Sengstock DM, Vaitkevicius PV, Supiano MA. Arterial stiffness is related to insulin resistance in nondiabetic hypertensive older adults. J Clin Endocrinol Metab 2005;90:2823-7.
26. Westerbacka J, Yki-Järvinen H. Arterial stiffness and insulin resistance. Semin Vasc Med 2002;2:157-64. 27. Greenberg J. Antihypertensive treatment alters the
predictive strength of pulse pressure and other blood pressure measures. Am J Hypertens 2005;18:1033-9.