the Korean Family and
Policy Issues
Kyunghee Chung
Meekyung Suh
the Korean Family and
Policy Issues
Kyunghee Chung
*Meekyung Suh
**Korea Institute for Health and Social Affairs
* Research Associate, KIHASA ** Fellow, KIHASA
San 42-14, Bulkwang-dong, Eunpyung-ku, Seoul 122-705, Korea
Chapter1
Introduction 5
Chapter2
Changes in Population and the Family 7
Chapter 3
Family Related Policy Issues 17
Chapter 4
Conclusion 35
References 38
Introduction
Since the 1970s, social issues surrounding the family, including changes in the family structure, breakdown of families, changes in the attitude toward gender-roles, and weakened familialism, have attracted interest in the family as a basic unit of society. In addition, the need for more social policies and programs targeting the family has arisen due to the increasing social problems related to family changes.
As a result of the rapid decrease in fertility, the decline in the infant mortality rate, and the substantial increases in life expectancy, the percentage of population under the age of 14 is decreasing, while the percentage of the population 65 years of age and over is increasing. As the percentage of youth decreases, the importance of children increases. With the rapid decline of total fertility rate, the concerns about children, especially children's welfare, increases as an investment for the future. However, the current programs for children are few and mainly focused on underprivileged children. Welfare programs for children should move from how
to satisfy their basic needs of underprivileged children to how to satisfy the diverse needs of children. In addition, caring for the elderly has become a social issue. The root condition of the increasing interests in social policy concerning aging problem is not only population aging but also the weakening of the care-giving role of the family.
Furthermore, the sustained decrease in the average number of family members, the rise of the nuclear family, and the changes in the attitude towards women's role are contributing to the increase of women's social participation. Policies that help women to combine work and family responsibilities, however, are not fully set.
Considering these various issues, it is necessary to identify the current status of the family and the social policies and programs that are required for meeting family changes. For this purpose, the existing statistical data is analyzed. Both the national statistics produced by the government and the national data set produced by government research institutes were used. Based on this review, policy recommendations will be presented.
Changes in Population and
the Family
Age Composition of the Population
Due to the rapid decrease in the fertility rate and the sustained increase in life expectancy, the number and proportion of the youth population has decreased; at the same time, the number and proportion of the aged population has substantially increased.
The percentage of the population under 14 years of age was 42.5% in 1970, compared with 23.2% in 1995. Moreover, the corresponding proportion is expected to be 15.8% in 2021. The youth dependency ratio was 78.2 in 1970, compared to 32.6 in 1995, and it is expected to be 22.2 in 2021. As the proportion of the youth decrease, the importance of children increases. Hence, comprehensive welfare policies for enhancing the quality of the youth population are urgently needed. The percentage of the total population aged 65 and over was 3.1% in 1970, compared with 5.7% in 1995. Moreover, the corresponding proportion is expected to
be 13.1% in 2021. Similar trends have been observed and are expected to continue concerning the old age dependency ratio and the index of aging(see Table 1). Table 1. Age Composition of the Korean Population,
1970~2020 (Unit: %) 1970 1980 1990 1995 2000 2010 2021 Age Composition 0~14 15~64 65+ Total 42.5 54.4 3.1 100.0 34.0 62.2 3.8 100.0 25.8 69.2 5.0 100.0 23.2 71.1 5.7 100.0 21.2 72.0 6.8 100.0 19.1 71.5 9.4 100.0 15.8 71.1 13.1 100.0 Youth Dependency Ratio1) 0~14 78.2 54.6 37.4 32.6 29.4 26.8 22.2 Old Age Dependency Ratio2) 65+ 5.7 6.1 7.2 8.0 9.4 13.1 18.4 Index of Aging3) 65+ 7.9 11.2 19.4 24.5 31.9 49.1 82.9 Note: 1) Youth Dependency Ratio=(Pop. under 15
Years Old/Pop. from 15 to 64 Years old)×100 2) Old Age Dependency Ratio=(Pop. 65 Years Old and over/Pop. from 15 to 64 Years old)×100 3) Index of Aging=(Pop. 65 Years Old and over/Pop. under 14 Years old)×100 Sources: Economic Planning Board, Population and Housing Census Report, 1960~1985. National Statistical Office, Population and Housing Census Report, 1990.
National Statistics Office, Population Projection for 1990~2021, 1991.
Along with rapid population aging, the fact that a significant and increasing proportion of the Korean elderly are living apart from their children indicates
the increasing social need to care for the elderly. The proportion of households with an elderly person(s) was 22.6% of the entire number of households in Korea both in 1988 and 1994. Two nation-wide surveys have shown that the proportion of households composed of a single elderly person or an elderly couple only grew from 5.2% of all households in 1988 to 8.7% in 1994. Among the households with elderly person(s), the proportion of the households with elderly person(s) only increased from 22.9% in 1988 to 38.5% in l994(see Table 2). Table 2. Proportion of Households with Elderly Aged
60 Years and over, 1988 and 1994 (Unit: %)
1988 1994
Whole Urban Rural Whole Urban Rural Households of a Single Elderly
Person / Total Households
2.2 1.2 4.5 3.4 2.0 8.2 Households of an Elderly Couple /
Total Households
3.0 1.4 6.8 5.3 3.0 13.4 Elderly Households of a Single /
Households with Elderly Persons
9.6 7.2 12.2 14.9 11.4 20.0 Elderly Households of a Couple /
Households with Elderly Persons
13.3 8.4 18.7 23.6 17.2 32.7 Households with Elderly Persons/
Total Households
22.6 16.8 36.6 22.6 17.2 40.7
Sources: Rhee et al., A Study on Structural Characteristics of Households with the Elderly, 1989.
Rhee et al., Living State and Its Policy Implications of the Korean Elderly, 1994.
Family Structure
Household Size and Types
The total number of households in Korea has been doubled since 1970. In 1990 the number of households reached 11,355,000 which is an increase of 5,779,000 households over 1970 (see Table 3). Meanwhile, the average number of household members recorded an overall decline from 5.2 persons in 1970 and 4.6 in 1980 to 3.7 in 1990. This trend is mainly the result of the decline in the average number of births per women. In terms of household type, one person households increased from 4.2% of the total number of households in 1975 to 9.0% in 1990. This reflects an increase in the number of one-person households among the elderly in rural areas and an increase in the number of young people who live alone in urban areas.
Family Size and Types
In terms of the number of generations represented in a family, two generation families accounted for 74.1% of all families. One generation families reached 12%, up from 6.8% in 1970, while three generation families decreased from 23.2% in 1970 to 14.0% in 1990.
Furthermore, nuclear families are the most common family type in Korea, accounting for 76% of all families in 1990. The decline in the size of families can be traced to the decline of fertility in Korea. Total fertility rates decreased from 2.7 in 1980 to 1.6 in 1990. Table 3. Changes in the Family Structure in Korea
1970 1975 1980 1985 1990 Total Number of Households(1,000persons) 5,576 6,648 7,969 9,571 11,355 Household Size: Average Number of Household Members 5.2 5.1 4.5 4.1 3.7
One Person Households(%) - 4.2 4.8 6.9 9.0 Number of Generations in the Family(%)
1 Generation 2 Generations 3+ 6.8 70.0 23.2 7.1 71.8 21.2 8.8 73.1 18.1 10.5 73.3 16.3 12.0 74.1 14.0 Types of Families(%) Nuclear Families Extended Families Others 71.5 21.9 6.6 70.5 21.9 14.8 72.9 14.1 13.0 75.3 13.7 11.1 76.0 12.5 11.5 Total Fertility Rates 4.5 3.3 2.7 1.7 1.6 Sources: National Statistical Office, Population and Housing Census, Various Years.
National Statistical Office, Population Projection, 1991.
Kong, S.K., The Family Formation and Fertility Behavior in the Republic of Korea, 1992.
The Formation of Families
Trends of Marriage and Divorce
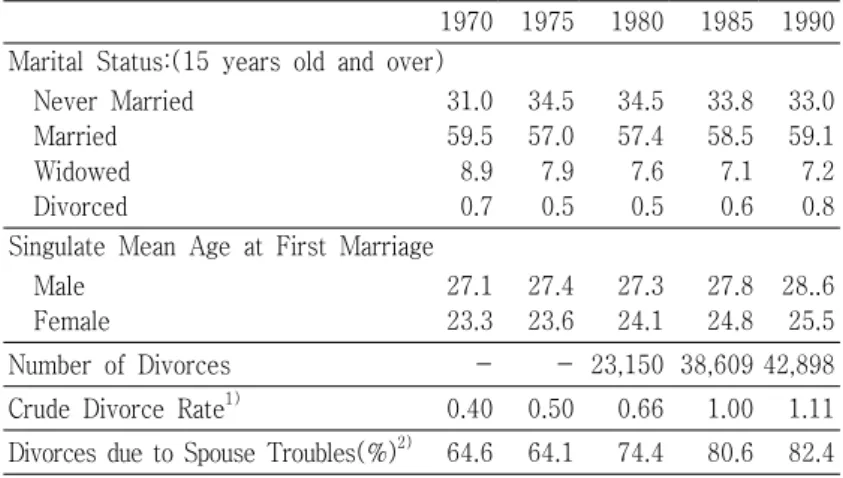
According to the 1990 Population and Housing Census Report, the number of people who have never been married accounted for 33.0% of the population 15 years of age and over, while married people represented 59.1%, widowed people 7.2% and divorced people 0.8%. The average age at marriage has been pushed upward; women's average age at the time of their first marriage has increased from 23.3 in 1970 to 25.5 in 1990. Similarly, men's average age at marriage increased from 27.1 in 1970 to 28.6 in 1990(see Table 4). The crude divorce rate increased from 0.4 in 1970 to 1.1 in 1990. Furthermore, according to vital registration statistics, divorce due to troubles with one's spouse increased from 65% of all divorces in 1970 to 83% in 1990. Other types of reasons of divorce are troubles with family members, ill health, and economic problems. Therefore, the need for programs designed to try to prevent divorce and to support the members of dissoluted families is increasing.
Table 4. Formation and Dissolution of Families
1970 1975 1980 1985 1990 Marital Status:(15 years old and over)
Never Married Married Widowed Divorced 31.0 59.5 8.9 0.7 34.5 57.0 7.9 0.5 34.5 57.4 7.6 0.5 33.8 58.5 7.1 0.6 33.0 59.1 7.2 0.8 Singulate Mean Age at First Marriage
Male Female 27.1 23.3 27.4 23.6 27.3 24.1 27.8 24.8 28..6 25.5 Number of Divorces - - 23,150 38,609 42,898 Crude Divorce Rate1) 0.40 0.50 0.66 1.00 1.11
Divorces due to Spouse Troubles(%)2) 64.6 64.1 74.4 80.6 82.4
Note: 1) Crude Divorce Rate=(Number of Divorces/Total Pop.) × 1,000 2) Reasons of divorce are troubles with one's spouse, troubles with family members, ill health, and economic problems. Source: National Statistical Office, Population and Housing Census, Various Years.
National Statistical Office, Vital Registration Statistics, Various Years.
KIHASA, Fertility and Family Health Surveys, Various Years.
Births
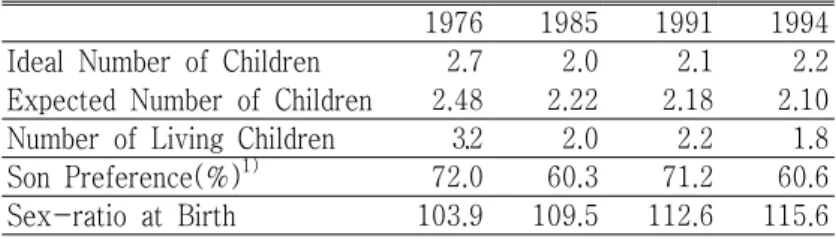
Both actual number of births and the norms on children have changed. The average ideal number of children changed from 2.7 in 1978 to 2.2 in 1994; and the average expected number of children per family decreased from 2.5 in 1980 to 2.1 in 1994(see Table 5). The average number of living children per family decreased from 3.2 in 1978 to 1.8 in 1994.
Table 5. Attitudes about Children and Births
1976 1985 1991 1994 Ideal Number of Children 2.7 2.0 2.1 2.2 Expected Number of Children 2.48 2.22 2.18 2.10 Number of Living Children 3.2 2.0 2.2 1.8 Son Preference(%)1) 72.0 60.3 71.2 60.6 Sex-ratio at Birth 103.9 109.5 112.6 115.6 Note: 1) Son preference is measured by the degree of son necessity. Source: KIHASA, Fertility and Family Health Surveys, Various Years.
Although the average number of children has decreased, Koreans still have a strong preference for sons. This son preference has resulted in an increased number of sex-selective abortions.
The sex-ratio at birth reached 115.6 in 1994, up from 103.9 in 1980. Sex-selective abortions have become a grave social, demographic, and ethical issue, and future trends in the sex-ratio at birth will need careful monitoring.
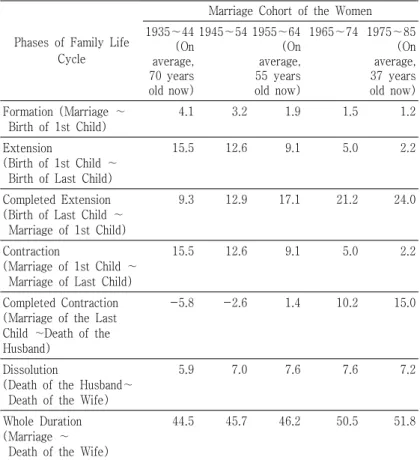
Changes in the Family Life Cycle
A decline in fertility, marrying at a later age, and a longer life expectancy has brought about changes in the life cycle of women(see Table 6). Although the whole duration of the family life cycle has been extended, the family extension stage has been shortened. The duration from the birth of the first child to the
birth of the last has decreased from 16(70 years old now), 9(55 years) to 2 years(37 years). Although the total number of years of childbearing and rearing decreased, the years devoted to rearing one child increased. This means that the burden of child rearing has not been notably alleviated despite the decline in fertility.
The shortened family extension stage allows for more active labor force participation by women. Moreover, the centrality of child rearing in a marriage has decreased, while the quality of the conjugal relationship has become more important.
The duration of the empty-nest period has also increased. Therefore, the economic, psychological, and emotional issues of middle-aged or elderly couples have recently gained importance.
Table 6. Changes in the Family Life Cycle in Korea (Unit: years)
Phases of Family Life Cycle
Marriage Cohort of the Women 1935∼44 (On average, 70 years old now) 1945∼54 1955∼64 (On average, 55 years old now) 1965∼74 1975∼85 (On average, 37 years old now) Formation (Marriage ∼ Birth of 1st Child) 4.1 3.2 1.9 1.5 1.2 Extension (Birth of 1st Child ∼ Birth of Last Child)
15.5 12.6 9.1 5.0 2.2
Completed Extension (Birth of Last Child ∼ Marriage of 1st Child)
9.3 12.9 17.1 21.2 24.0
Contraction
(Marriage of 1st Child ∼ Marriage of Last Child)
15.5 12.6 9.1 5.0 2.2
Completed Contraction (Marriage of the Last Child ∼Death of the Husband)
-5.8 -2.6 1.4 10.2 15.0
Dissolution
(Death of the Husband∼ Death of the Wife)
5.9 7.0 7.6 7.6 7.2
Whole Duration (Marriage ∼ Death of the Wife)
44.5 45.7 46.2 50.5 51.8
Family Related Policy Issues
Issues on Children
Protecting and Raising Infants
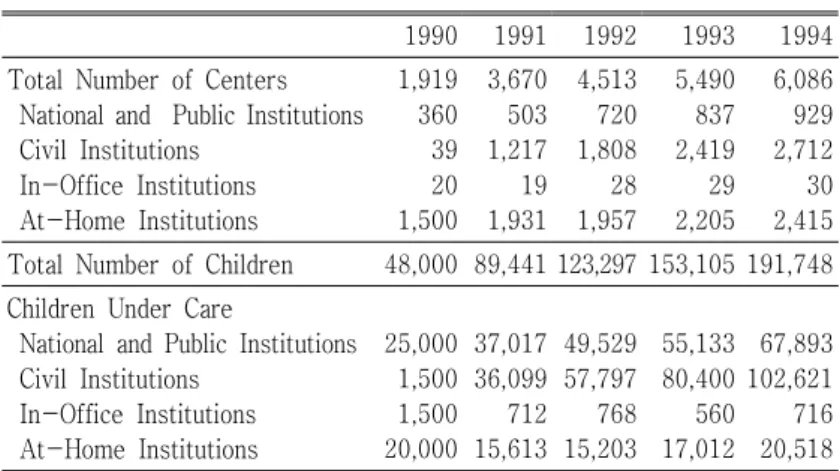
As more women come to be employed, a greater share of the responsibilities of protecting and caring for children are gradually shifting from the family to the Government. The purpose of programs for infants is to allow young children to become sound members of society through physical and mental protection and suitable education.
Currently, the Children's Welfare Division in the Ministry of Health and Welfare(MOHW) is in charge of compiling an annual expenditure budget, improving related laws, and establishing day-care centers. On the other hand, the Family Welfare Division in the Bureau of Family Welfare is implementing these projects at the provincial level. In 1994, there are 6,086 day-care centers and ay-care center's coverage rate for the children under the age of 6 of working mothers is
14.7%(see Table 7 and Table 8).
Table 7. Number of Institutions and Children at Day-Care Centers
(Unit: facilities, persons)
1990 1991 1992 1993 1994 Total Number of Centers
National and Public Institutions Civil Institutions In-Office Institutions At-Home Institutions 1,919 360 39 20 1,500 3,670 503 1,217 19 1,931 4,513 720 1,808 28 1,957 5,490 837 2,419 29 2,205 6,086 929 2,712 30 2,415 Total Number of Children 48,000 89,441 123,297 153,105 191,748 Children Under Care
National and Public Institutions Civil Institutions In-Office Institutions At-Home Institutions 25,000 1,500 1,500 20,000 37,017 36,099 712 15,613 49,529 57,797 768 15,203 55,133 80,400 560 17,012 67,893 102,621 716 20,518 Source: MOHW, White Paper on Health and Social Affairs, 1994.
Table 8. Estimation of Day Care Centers' Coverage for the Children(0∼5 years) of Working Mothers
(Unit: facilities, persons, %)
Years Children of 0∼5 Years (A) Employment Rate of Women of 25~34 Years (B) Children, 0~5 Years of Working Mothers (A×B) No. of Institutions No. of Children under Care (C) Coverage Rate (C/A×B) 1992 3,931,646 32.85 1,291,522 4,513 123,297 9.55 1993 3,948,777 32.85 1,297,173 5,490 153,105 11.80 1994 3,966,098 32.85 1,302,863 6,086 191,748 14.70 Sources: MOHW, White Paper on Health and Social Affairs, 1994.
National Statistical Office, Population Projection, 1991.
National Statistical Office, Report on the Employment Structure Survey, 1993.
In 1995, about 2,481 day-care centers supported by the Government were established in impoverished areas. In 1997, the Government will expand day-care centers so that they will cover almost all children who need day-care services. Day-care centers should be established in every residential apartment area in which the number of households is over 500. Every workplace with over 300 female employees should establish day-care centers by 1997. Also, after-school care programs and school meals will be implemented by the year 2000.
Welfare for Underprivileged Children
Child welfare services are provided for children younger than 18 years of age in accordance with the Child Welfare Act passed in 1981. As the number of children has been decreasing since 1976, the number of underprivileged children has also been decreasing. The number of underprivileged children was 426,392 or 3.3 percent of the total child population in 1994. The Government supports the living costs for children who are being accommodated at the welfare facilities(279 facilities in 1995) and the personnel expenses of the specialists at those institutions. In 1995, 13,457 of these children formed relationships with sponsors. In addition, the Government has been operating
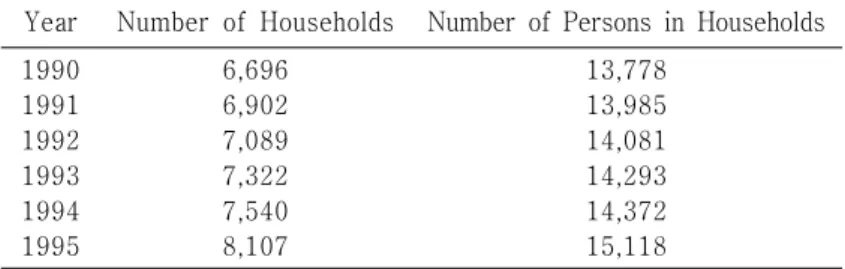
a job-placement program for children living in the welfare facilities who are reach adulthood since 1976. As of 1995, there were 8,107 child-headed households, of which the number totaled 15,118 persons(see Table 9). Most of the child-headed households face many difficulties in trying to cope with the hardships of managing their own lives and future, including the cost of education, after their parents have passed away or became ill. The Government includes them in the livelihood protection and medicaid schemes in order to protect these families and to provide better conditions for them to become sound members of society. An appropriate amount of financial support is given to them for their education and clothes, as well.
Table 9. Annual Number of Child-headed Household(1994)
Year Number of Households Number of Persons in Households 1990 1991 1992 1993 1994 1995 6,696 6,902 7,089 7,322 7,540 8,107 13,778 13,985 14,081 14,293 14,372 15,118
Issues on the Elderly
Economic Security
Economic Conditions
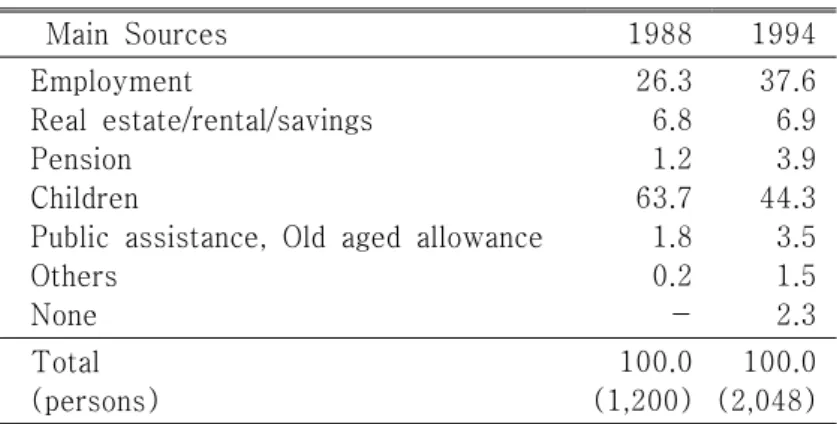
Because policies and programmes to promote life-long preparation for old age are not fully set in Korea, the elderly tend to rely on their children or their own income. Although elderly persons are relying more and more on their own income sources these days, children continue to be the most important financial provider for them. For instance, 44.3% of the elderly incomes were given to them by their children in 1994. Nonetheless, the income earned from elderly people's own employment has sharply risen in recent years(see Table 10). In addition, the labor force participation rate of those aged 60 years and over was 25.9% in 1970, 28.3% in 1980, 35.6% in 1990 and 38.2% in 1994, showing a steadily increasing trend(see Table 11).
Table 10. Income Sources for the Elderly (Unit: %) Main Sources 1988 1994 Employment Real estate/rental/savings Pension Children
Public assistance, Old aged allowance Others None 26.3 6.8 1.2 63.7 1.8 0.2 -37.6 6.9 3.9 44.3 3.5 1.5 2.3 Total (persons) 100.0 (1,200) 100.0 (2,048) Sources: Rhee et al., A Study on Structural Characteristics of
Households with the Elderly, 1989.
Rhee et al., Living State and Its Policy Implications of the Korean Elderly, 1994.
Table 11. Labor Force Participation Rate by Sex of the Elderly(60+)
(Unit: %) Year Total Pop. Elderly(60+)
Total Male Female
1970 57.6 25.9 41.7 14.8
1980 59.0 28.3 45.1 17.0
1985 56.6 29.3 44.3 19.3
1990 60.0 35.6 49.8 26.4
1994 61.7 38.2 53.8 27.9
Note: Labor-Force Participation Rate = Number of people aged 60 and over economically active population (the employed + the unemployed) / Number of people aged 60 and over
Source: National Statistical Office, Annual Report on the Economically Active Population Survey, 1970~1994.
However, when you break down the figures on the number of elderly who were employed in 1994, the working elderly were engaged in non-salary receiving jobs in the form of self-employment or family businesses. Among the working elderly, 67.5% were self-employed or family business workers, whereas full-time paid elderly workers accounted for 18.3%. Moreover, 55.8% of the working elderly aged 60 years and over were engaged in agriculture, forestry and fishing in 1994.
Policies for Economic Security
Establishing income maintenance, including financial support for the elderly, is one of the most important social welfare policies for the elderly. There are three job placement programs that provide elderly people with an opportunity to earn money by making good use of their free time: 1) Elderly Job Bank, 2) Elderly Workplace, and 3) Elderly Employment Promotion (Employment Promotion Law).
The Elderly Job Bank program was started in 1981, and 60 Banks were being operated by local branch offices of the National Association of Senior Citizens in 1994. The Elderly Workplace program was started in 1986 and 272 workplace are being operated by voluntary organizations with government assistance.
In these places, elderly persons undertake simple handcrafts, such as making envelopes, growing crops, and so on.
The Employment Promotion Law enacted in 1991 encourages business firms to employ 3% or more of its employees from among the population aged 55 and over. In addition, this law stipulates that 40 jobs (selling bus tokens and cigarettes, attending parking lots and public parks, etc.) should be preferentially allocated to elderly persons.
The National Pension System, public assistance based on the Livelihood Protection Law, and the old age allowance are three components of the public policy to enhance the economic security of the elderly. The Korean government prepared basic policy measures for implementing a national pension system in 1973. The pension system currently covers industrial workers employed in companies with 5 or more employees, as well as the self-employed, farmers and fishermen. In 1995, 55.0% of all employees were covered by parts of the national pension system, but only 1.3% of the elderly population(51,336 persons) were eligible for pension benefits.
The Livelihood Protection Law was enacted in 1961 to guarantee a minimum standard of living and
to enhance the self-reliance capabilities of the elderly poor. The recipients of public assistance are selected annually by the local governments based on the income/poverty criteria set up by the Ministry of Health and Welfare. In 1995, the number of the elderly receiving public assistance was 265,119 which covered 10.4% of the total elderly population aged 65 and over. In addition, an old age allowance has been provided to poor elderly persons since 1991. In 1995, 174,000 elderly persons aged 70 and over received 30,000 to 50,000 won per month depending on their age.
Health and Medical Problems
Health Status of the Elderly
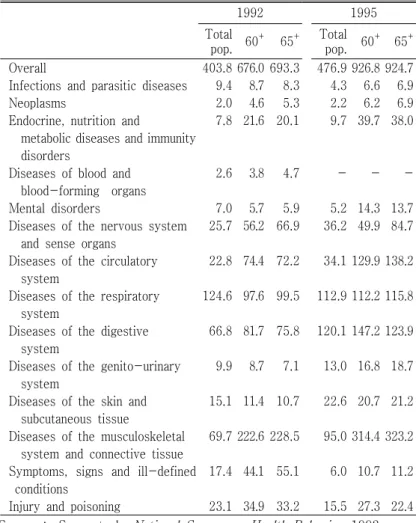
Morbidity is higher among the elderly than among the total population; 86.8% of the elderly have chronic diseases and 33.5 % of the elderly have at least one of the difficulties of Activities of Daily Living(ADL). The prevalence rate of illness in the "last 2 weeks" among the elderly aged 60 and over was 676.0 per 1,000 persons in 1992 and 926.8 per 1,000 persons in 1995, displaying a rapid increase. By comparison, the prevalence rate of illness in the "last 2 weeks" among the total population was 476.9 in 1995(Rhee et al, 1994). Of the diseases, the elderly suffered most from
diseases of the musculoskeletal system and connective tissue, diseases of the digestive system, and diseases of the circulatory system(see Table 12).
Table 12. Disease Patterns of the Elderly
(Unit: times) 1992 1995 Total pop. 60 + 65+ Total pop. 60 + 65+ Overall
Infections and parasitic diseases Neoplasms
Endocrine, nutrition and
metabolic diseases and immunity disorders
Diseases of blood and blood-forming organs Mental disorders
Diseases of the nervous system and sense organs
Diseases of the circulatory system
Diseases of the respiratory system
Diseases of the digestive system
Diseases of the genito-urinary system
Diseases of the skin and subcutaneous tissue
Diseases of the musculoskeletal system and connective tissue Symptoms, signs and ill-defined conditions
Injury and poisoning
403.8 9.4 2.0 7.8 2.6 7.0 25.7 22.8 124.6 66.8 9.9 15.1 69.7 17.4 23.1 676.0 8.7 4.6 21.6 3.8 5.7 56.2 74.4 97.6 81.7 8.7 11.4 222.6 44.1 34.9 693.3 8.3 5.3 20.1 4.7 5.9 66.9 72.2 99.5 75.8 7.1 10.7 228.5 55.1 33.2 476.9 4.3 2.2 9.7 5.2 36.2 34.1 112.9 120.1 13.0 22.6 95.0 6.0 15.5 926.8 6.6 6.2 39.7 14.3 49.9 129.9 112.2 147.2 16.8 20.7 314.4 10.7 27.3 924.7 6.9 6.9 38.0 13.7 84.7 138.2 115.8 123.9 18.7 21.2 323.2 11.2 22.4 Sources: Song et al., National Survey on Health Behavior, 1992. Choi et al., The Level of Health and Medical Utilization Practice of the Korean People, 1995.
Health and Medical Policies
At present all Koreans are covered by health insurance or medical assistance programs. As of 1995, 96.7% of those aged 65 and over were covered by health insurance and the rest of the elderly were covered by medical assistance.
In spite of the high coverage of health insurance, the increasing medical expenditure due to the aging population has become a main concern for Koreans. The elderly comprise 5.3% of the population covered by health insurance, but 10.3% of health insurance costs are used for the elderly. Also, the medical costs per elderly person aged 65 and over are approximately 2.1 times those of citizens younger than 64. Therefore, the high medical costs resulting from population aging has become an important issue(Han, 1994). In addition, because of the high rate of elderly people living on their own and the increasing labor force participation of women, who have traditionally been the main care-provider to the elderly in Korea, public assistance to care for the elderly is urgently needed.
Recently, the Government began devoting attention to social care services for the elderly, based on the recognition of the difficulties of caring for frail elderly
in the home. Home help services (33 places), day care centers for the elderly(10 places) and short-term care centers(10 places) are under operation as experimental projects. The program will receive major budgetary support, and thus is expected to increase rapidly in the coming years. The Korean government also provides free heath check-up services for low-income elderly persons aged 65 and over.
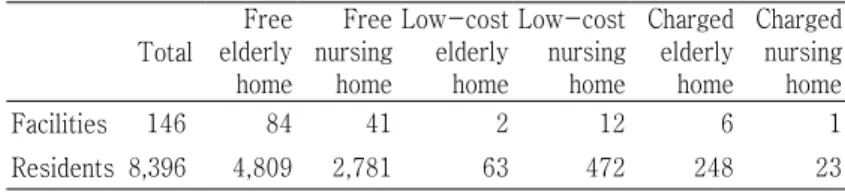
In addition, there are six kinds of institutional care facilities for the elderly in Korea. In 1996, 8,396 people(0.3% of those aged 65 and over) are cared for in 146 facilities(see Table 13).
Table 13. Welfare Facilities for the Elderly in 1996 (Unit: facilities, persons)
Total Free elderly home Free nursing home Low-cost elderly home Low-cost nursing home Charged elderly home Charged nursing home Facilities 146 84 41 2 12 6 1 Residents 8,396 4,809 2,781 63 472 248 23
Source: MOHW, Annual Report on Welfare Facilities, 1996.
Leisure Activities
In combination with Korea's economic growth, the need for leisure activities has increased. However, there are few existing social service programmes for
the elderly. Leisure activities of the elderly are more home-based than community-based. The most popular activities are watching TV or listening to the radio, visiting children and friends, and baby-sitting.
Since the elderly spend most of their time at home, their social activities are limited. With regard to elderly people's leisure and related activities, there are three types of facilities offering social activities: the Korean government operates Senior Halls(a neighborhood lounge where elderly people can gather and relax); Senior Citizens Centers(a special facility for various welfare and leisure services); and a Multi-purpose Senior Town(a complex composed of residential, medical, welfare and leisure facilities).
Issues on Women
Women's Social Participation
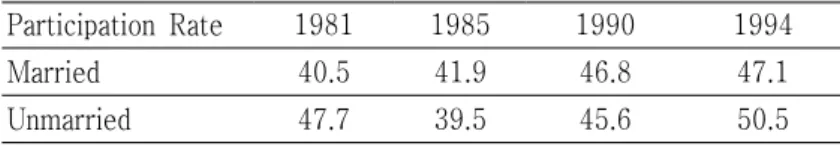
Korean women have become more involved in economic activities. The labor force participation rate among married women showed an increase from 42.3% in 1981 to 47.9% in 1994. The labor force participation rate increase is greater among married
women than unmarried women(see Table 14).
Table 14. Labor Force Participation Rate by Marital Status Participation Rate 1981 1985 1990 1994
Married 40.5 41.9 46.8 47.1
Unmarried 47.7 39.5 45.6 50.5
Source: National Statistical Office, Annual Report on the Economically Active Population Survey.
A number of factors are believed to be responsible for the increase among married women. First, increased living standards and larger educational expenses for children have prompted housewives to earn money to supplement their husbands' incomes. According to the
Social Statistics Survey, conducted by National
Statisitcal Office in 1991, the most common reason women gave for working was "to help with family finance." Secondly, women have a stronger desire to take part in economic activities and are able to adapt themselves to careers more readily than their predecessors.
However, working women are generally concentrated in low-wage fields and small companies, and the majority of them are employed as part-time workers (see Table 15). This means that the economic status of women remains low. Moreover, women still face
sexual discrimination in the labor market due to restrictive recruitment practices, gender wage gaps, limited opportunities for promotion, low wages, long working hours, lack of job security, lack of child care centers, and hazardous working conditions(Park, 1993). Table 15. Employment Status of Working Women
1985 1990 1993 1994 % of Women in Regular Positions 32.4 35.6 36.5 36.7 % of Women Employed in Small
Companies (5 or less employees) 68.8 64.6 62.7 -% of Women in Part-time Positions 54.0 65.9 64.9 -% of Self-employed Workers
among Working Women 19.0 16.1 15.9 15.7 Source: National Statistical Office, Annual Report on the Economically Active Population Survey.
In an effort to help eliminate such discrimination, the Equal Employment Opportunity Act was established and went into effect on April 1, 1988. The act guaranteed equality between men and women in employment, and special provisions were made for pregnancy, including a 60-day paid maternity leave and one-year child care leave. The act also mandates the provision of child care facilities by employers. However, employers have not abandoned many of their discriminatory practices.
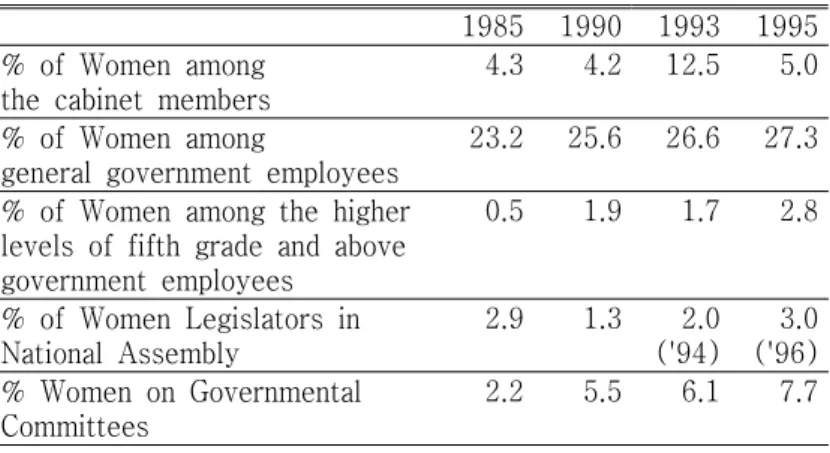
Women's participation in public affairs is essential to their advancement. However, women's level of participation in politics and decision-making has not changed significantly over the past decade. Currently, there are only 9 female legislators and only 1 female cabinet member, which is 3% and 5% of the total number of legislators and cabinet members respectively. In the executive branch, women are concentrated in the lower levels of seventh grade or below. Among the higher levels, fifth grade and above1), only 2.8%
of the positions are occupied by women(see Table 16). Therefore, the President's Special Commission on Globalization of Korea announced in a special report its recommendation of ten medium and long-term policy priorities for women. Among the policy priorities is to set in place institutional support for women's employment. This is to be accomplished by increasing the percentage of women in public services, introducing an incentive system to recruit more women at public enterprises, and socially sharing maternity protection costs.
1) Government employees are classified from 9th grade to 1st grade. The rate of females is dramatically reduced from 5th grade and above.
Table 16. Women in Public Affairs
1985 1990 1993 1995 % of Women among
the cabinet members
4.3 4.2 12.5 5.0 % of Women among
general government employees
23.2 25.6 26.6 27.3 % of Women among the higher
levels of fifth grade and above government employees 0.5 1.9 1.7 2.8 % of Women Legislators in National Assembly 2.9 1.3 2.0 ('94) 3.0 ('96) % Women on Governmental Committees 2.2 5.5 6.1 7.7
Source: Kim and Yoon, A Study on the Policy Tasks for the Implementation of the Platform for Action of the 1995 Beijing World Conference on Women, 1996.
Welfare for Underprivileged Women
As of 1990, 15.7% of all households were headed by women. Furthermore, 56,996 women received public aid in 1995 and most of them were low-income mothers in charge of their families(see Table 17). On April 1, 1989, the Mother-Child Welfare Act was promulgated to support mother-headed families. In 1995, 15,925 million won was granted to those families with middle or high school students and also to those with infants under 6 years old.
One hundred twenty two Women's Counseling Centers and 23 Women's Vocation Centers help unmarried
mothers, women separated from their husbands and low-income women for their reintegration into the society. Table 17. Total Population for the Women's Welfare Policy(1995) (Unit: person, (%)) F e m a l e Population Aged 15 to 64 Underprivileged Women Total Low-income, Mother-headed Families Unmarried Mothers Women Separated from Husband Others 15,716,049 56,996 (100.0) 46,793 (82.1) 1,789 (3.2) 3,326 (5.8) 5,088 (8.9) Source: MOHW, Major Programs for Health and Welfare, 1996.
Protection from Violence
Domestic violence and sexual assault against children and women has become an issue in Korea. Therefore, the Government enacted and put into practice the Act Relating to Punishment of Sexual Offenders and Protection of Victims on April 1, 1994. This Act is the first legislation of its kind in Asia. It is expected that this act will be effective in preventing sexual violence and in promoting women's rights. Also, the National Assembly is preparing an act to punish offenders and protect victims of domestic violence.
Conclusion
In order to help erect future family policy orientation, this study attempted to identify the current status of the family and social policies and programs to meet the changes in the family. The major changes in the family we are witnessing are reflected in the statistics which show a decline in family size, an increase in the number of nuclear families, and the increased labor force participation of women.
These changes result in the weakened capacity of the family to protect and care for individual members of the family in terms of economic, physical and emotional care. A fundamental problem, therefore, is the gap between the increasing dependency needs and the insufficient support provided by social policies. To fill the gap, the Government should share the responsibilities of caring for members of society with the individual families.
Currently, family welfare policies are focused only on the underprivileged population. However, due to the dramatic and fundamental changes in the family,
welfare policies should target the welfare of families in general. In other words, family policies should move from the residual approach to a comprehensive approach. First of all, policies that enable families to maintain their economic security are needed. The introduction of family allowances to families with children or the elderly and the universal old-age pension system should be examined by the Government.
Secondly, the Government should assume a greater share of the responsibilities of protecting and caring for children and the elderly. Through the extension of child-care facilities and after-school programs, the government could help rear young children as sound members of society. Also, by strengthening social care services for the elderly, such as home help services, day care centers and short-term care centers, the Government could share the responsibilities of caring for the elderly with the individual families.
In addition, the physical and mental protection of children and women is an essential base for healthy families. Thus, in order to secure this protection, an act related to the punishment of domestic violence offenders and the protection of victims must be enacted.
strengthened to help solve family problems. Family counselling services, such as marriage-counselling, parent education, and counselling on conjugal relationships, can prevent family problems. Preventive rather than curative services can reduce social problems and social costs resulting from the weakening of the family.
Choi, J. S. et al., The Level of Health and Medical Utilization Practice of the Korean People, 1995(in Korean).
Economic Planning Board, Population and Housing
Census Report, 1960-1985(in Korean).
Hong, M. S. et al., 1994 National Family Health and Fertility Survey(in Korean).
Kim, S. U. and Yoon, D.Y. A Study on the Policy Tasks for the Implementation of the Platform for Action of the 1995 Beijing World Conference on
Women, Korea Women's Development Institute,
1996(in Korean).
Kong, S.K. et al., The Family Formation and Fertility
Behavior in the Republic of Korea, 1992(in Korean).
_________________, Family Changes and Family Policies in the Republic of Korea, 1987(in Korean). Ministry of Health and Welfare(MOHW), White Paper
on Health and Social Affairs, 1996(in Korean).
_______________________________________, Major Programs for Health and Welfare, 1996.
_______________________________________, Annual Report on welfare facilities, 1996(in Korean).
National Statistical Office, Annual Report on the Vital Statistics(in Korean).
__________________________, Annual Report on the Economically Active Population Survey(in Korean).
__________________________, Population and Housing
Census Report, 1990(in Korean).
__________________________, Population Projection for
1990-2021, 1991(in Korean).
Park, S.J., "Women and the Labor Market", in Women's Association of Korean Society Studies (Ed.), Women and Korean Society, pp. 233~266,
1993(in Korean).
Rhee et al., A Study on Structural Characteristics of Households with the Elderly, 1989(in Korean). ___________, Living State and Its Policy Implications
of the Korean Elderly, 1994(in Korean).
Song, K. Y. et al., National Survey on Health Behavior, 1992(in Korean).
Table A-1. Ministry of Health and Welfare Expenditures (1990~1994)
(Unit: hundred million won, (%)) 1990 1991 1992 1993 1994 Total Expenditures 11,518 (100.0) 14,628 (100.0) 15,462 (100.0) 16,552 (100.0) 17,718 (100.0) Social Welfare Services
Child Welfare Expenditures Welfare Expenditures for the Elderly
Welfare Expenditures for Women
Other Social Welfare Services 315 ( 2.7) 379 ( 3.3) 27 (0.0) 475 ( 4.4) 481 ( 3.3) 393 ( 2.7) 47 (0.3) 501 ( 3.4) 722 ( 4.7) 577 ( 3.7) -618 ( 4.0) 708 ( 4.3) 827 ( 5.0) 64 ( 0.4) 659 ( 4.0) 857 ( 4.8) 462 ( 2.6) 89 ( 0.5) 720 ( 4.1) Social Security Medical Insurance National Pension 4,458 (38.7) 202 ( 1.8) 6,761 (46.2) 217 ( 1.5) 6,941 (44.9) 126 ( 0.8) 7,312 (44.2) 136 ( 0.8) 7,777 (43.9) 149 ( 0.8) Public Assistance
Relief for the Livelihood Medical Aid
Health and Medical Care Others 2,341 (20.3) 1,513 (13.2) 1,279 ( 11.1) 519 ( 4.5) 2,506 (17.1) 1,730 (11.9) 1,393 ( 9.5) 499 ( 4.1) 2,610 (16.9) 1,934 (12.5) 1,192 ( 7.7) 742 ( 4.8) 2,579 (15.6) 2,210 (13.3) 997 ( 6.0) 1,060 ( 6.4) 2,644 (14.9) 2,637 (14.9) 1,449 ( 8.2) 934 ( 5.3) Source: MOHW, Yearbook of Health and Welfare Statistics, 1995.
Table A-2. Proportion of Welfare Budget, 1987~1995 (Unit: %) 1987 1990 1993 1995 National budget / GNP 16.0 14.9 14.3 14.7 Social Security Budget / GNP 0.6 1.0 0.9 0.8 Social Security Budget/
National Budget
3.7 6.6 6.4 5.9 Social Welfare Services Budget/
National Budget
0.3 0.5 0.6 -Social Welfare Services Budget/
Social welfare Budget
8.1 7.7 9.0
-Sources: MOHW, Programs for Health and Social Welfare Policies, 1987~1996.
Economic Planning Board, Budget for Fiscal Year, 1987~1996.
Table A-3. Programs and Policies for the Elderly, 1995. (Unit: 1,000 Won, %)
Budget %
Total
Economic Security ∙Old Age Allowance ∙Elderly Workplace 84,664,832 47,025,432 47,010,432 15,000 100.0 55.5 55.5 0.01 Health & Medical Care
∙Health Examination ∙home-helper ∙Day Care ∙Short-term Care 2,230,270 240,090 1,447,680 247,500 295,000 2.6 0.2 1.7 0.3 0.3 Institutional Care 18,223,905 21.5 Leisure Activities ∙Senior Hall
∙Senior Citizens Center ∙Multi-purpose Senior Town
16,587,035 8,508,535 1,633,500 6,445,000 19.6 10.4 1.9 12.4 Others 598,190 0.7