Phantom testing with a single source and a detector for an industrial CT system
Jong Bum Kim, Sung Hee Jung, Jin Sup KimKorea Atomic Energy Research Institute 150 Dukjin-dong, Yusong-gu, Daejon Korea, 305-353
1. Introduction
γ-ray CT has many advantages over x-ray , ultrasonic CT to diagnose an industrial process unit in that the industrial process unit object size and density of media are not fixed and it depends on the local situation. γ-ray CT can solve the problem by selecting a source with a different energy in various local situations. In most case, even the low resolution of a image is enough for the plant engineer to diagnose the system condition. Furthermore a sealed source is easy for handling, installing and moving for various local plant environments.
2. Principles and methods
The industrial CT introduced here is based on a γ-ray transmission using a single source and a detector. Filtered back projection method is used for image reconstruction.
2.1 Principe of the γ-ray CT
In the γ ray transmission CT, the transmitted intensity, I of a mono energetic radiation beam while traversing through an object of thickness u is given by the following equation[ ].
∫
=
I
e
− xyduI
0 µ( , ) (1) WhereI
0 is the incident beam intensity of the radiation beam andµ
( y
x
,
)
represents the attenuation coefficient. Equation (1) can be rearranged as equation (2)∫
=
x
y
du
I
I
In
0µ
(
,
)
(2) The line integral along the path of u is known as the ray-sum. θ ) , ( yx µFigure 1. Arrangement of γ-ray transmission CT
)
,
(
s
θ
P
is the line integral ofµ
( y
x
,
)
along a line inclined at an angle θ from the y axis and at a distance s from the origin (Fig. 1)[2]. Mathematically, it is written as∫
=
x
y
du
s
P
(
,
θ
)
µ
(
,
)
(3) As a result, projections are a set of ray-sums at each angle. This projection equation is the Radon transformation ofµ
( y
x
,
)
) , ( ) , (s R x y p θ = µ (4)Where R is the Radon transform operator. Tomography is reconstruction of a function
)
,
( y
x
µ
from the line integrals of the function. This implies the solving the Radon transformation:∫
−∞∞= x ydu
s
R ]( , ) ( , )
[ µ θ µ (5)
Fig 2. is image reconstruction routine known as filtered back projection.
) , (sθ P transformFourier ) , (ξθ P x ξ Inverse fourier transform Back projection ) , ( yx µ
Figure 2. Filtered back projection routine
) , (ξ θ
P denotes the Fourier transform of P(s,θ), ). Mathematically, it is written as [2] ds s j s p P(ξ,θ)=
∫
∞ ( ,θ)exp(− 2πξ ) ∞ − (6) ) , (sθp) denotes the inverse Fourier transform ofP(ξ,θ)•ξ . Mathematically, it is written as [2] ξ πξ θ ξ ξ θ P j sd s p( , )
∫
∞| | ( , )exp 2 ∞ − = ) (7) Reconstruction image can be obtained from the back projection of . p)(s,θ)∫
+
=
πθ
θ
θ
θ
µ
0(
cos
sin
,
)
)
,
(
x
y
p
)
x
y
d
(8) 2.2 Experimental set-upThe hardware set-up for the γ-ray CT data acquisition and the motion control system consists of a microcomputer with a standard serial interface RS 232C and two motors. One motor moves the source and detector at the same time for a parallel scanning and the other motor rotates the scan table by a preset projection angle. Fig 3 shows the experimental set up for γ-ray CT scanning which has a single source and a detector for a parallel beam scanning, internal diameter of 60cm,
Cs-Transactions of the Korean Nuclear Society Autumn Meeting Busan, Korea, October 27-28, 2005
137 20mCi as a γ-ray emitter and 1inch NaI(TI) as a receiver.
Figure 3. Experimental set-up for fixed bed reactor
The test phantom is based on a phantom of Fig 4 used at CREL, Washington University St. Louis, with a separation between the gas (air) voids. It is also decided to use solid polypropylene to avoid a difference in the packing density etc. The test phantom is 40cm diameter long and filed with polypropylene powder.
D D/8
D/16
Polypropylene Air
Figure 4. Phantom proposed by IAEA CRP group. 2.3 Experimental result
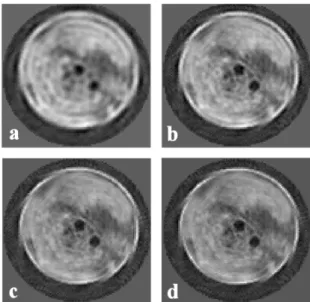
Fig5 shows the experimental result of the polypropylene phantoms simulating the cross-section of the packed bed with air bubbles. 64 projections and 51 samples per projection. To limit the unbounded nature of the frequency response, a band limited filter has been proposed for equation (7) [2].
) ( )
(ξ ξW ξ
H = (13) Fig 5 shows the consequence of the image result of the band limited filter with different cut-off frequencies. Figures from a to d corresponded to the result from
) (ξ
W =1, |ξ|< 0.4, 0.6, 0.8, 1
Figure 5. Phantom result scanned.
The phantom is simulating the fixed bed reactor with air bubbles. Fixed bed reactors like a desulphurization unit or structured packing reactors may create a channel by which the process media preferentially passes through and some part of internal structure may be damaged after a long period operation. It means that a larger scale CT can be directly applied to a real size fixed bed reactor
3. Conclusion
The Industrial CT is a multi-disciplinary research and development activity requiring the NCS, precision mechanical assemblies and radioisotopes handling. In addition to the applications in N.D.T, the application of an industrial CT recently has spread to a process visualization inside the reactor among the developed countries. Further investigation is required to improve the overall system to achieve a higher data acquisition speed and measurement rate for a process visualization. ACKNOWLEDGMENT .
The development have been carried out under the Nuclear R & D Program by MOST.
REFERENCES
[1] Avinash C. Kak, Malcolm Slaney, Principles of Computerized Tomographic Imaging, Electric Copy.(1999) IEEE PRESS.
[2] ANIL K. JAIN, Fundamentals of Digital Image Processing, (1989) 431-475, PRENTICE HALL, Englewood Cliffs. [3] Johansen G A, T Froystein, B T Hjertaker and Oisen, A dual sensor flow imaging tomographic system, Meas, Sci. Technol. 7 (1996) 297-3071. Printed in the UK.
[4] Johansen G A and Jackson P, Radioisotope gauges for industrial process measurements, ISBN 0-471-48999-9, John Wiley & Sons, Ltd (2004) 336pp.