Building D, 370 Sicheong-daero, Sejong City 30147 KOREA Korea Institute for Health & Social Affairs ISSN 2092-7117
Research in Brief
Introduction
South Korea’s national debt as a percentage of GDP is substantially lower than the OECD average. Some have claimed, however, that, given the increasing welfare spending and the potential cost of unification, South Korea’s national debt, kept though it has been at low levels, may grow to an extent that could cause concern. Still others claim that Korea’s national debt has already gone beyond the level recommended by the international community. This brief attempts to verify whether South Korea’s fiscal state is robust enough to afford growing social expenditures and costs associated with inter-Korean integration.
Measuring South Korea’s fiscal sustainability
In this study, South Korea’s fiscal sustainability is measured separately for South Korea and an integrated Korea, factoring in projected changes in the population structure and unemployment. We also looked at how, after inter-Korean integration, South Korea’s fiscal state would change under the most unfavorable economic conditions imaginable. We used the fiscal space model developed by Ostry et al. (2010) and by Ghosh et al. (2013), where fiscal space is defined as the difference between the current debt level and the projected debt limit. The debt limit, a critical point above which the government becomes unable to afford growing debt, is determined by the uppermost intersection of fiscal reaction function and the interest repayment schedule.
This study estimated fiscal reaction functions through pooled time series cross-section analysis of
South Korea’s Fiscal Sustainability
under the Assumption of Inter-Korean
Integration
Hae-Jin Ko
Associate Research Fellow
Issue No 2020-11
independent variable and the primary balance as the dependent variable. In deriving the interest repayment schedule, this study took into account the endogenous relationship between observed interest rates and national debt. If the fiscal space (difference between the current debt level and the uppermost intersection of fiscal reaction function and the interest repayment schedule) has a positive value, the government would be able to maintain its 2015 fiscal stance without eroding fiscal sustainability.
The model used here, taking into account national capacity for fiscal management, identifies long-term fiscal sustainability, rather than short-long-term fiscal balance. This enables to ascertain whether South Korea, with its population aging rapidly and its economy growing at low rates, remains capable over time of financing increasing welfare needs, even under the assumption of highly unfavorable fiscal conditions. Table 1 illustrates several post-integration scenarios and hypothetical situations where South Korea’s national debt level is assumed to rise over time.
[Table 1] South Korean welfare state’s fiscal sustainability under different scenarios and hypotheses
Baseline Fiscal space calculated by factoring in South Korea’s population structures, unemployment rates, and national debt ratios for the years 1991~2015
Inter-Korean integration
assumed
Inter-Korean Integration Scenario 1
Fiscal space calculated by taking into account the structure of the combined population of the two Koreas (total dependency ratio- projections of the population aged 65 and over) and unemployment rates
Inter-Korean
Integration Scenario 2 Fiscal space calculated based on a minimum unemployment rate of 25% for the North Korean population aged 25~59
Inter-Korean
Integration Scenario 3 Fiscal space calculated based on a maximum unemployment rate of 56% for the North Korean Population aged 25~59
Hypothetical Situation 1 Fiscal space calculated by factoring in Scenarios 1~3 under the assumption of a national debt ratio 1.4 times higher than the 2015 level (Germany’s debt-to-GDP ratio 10 years after unification)
Hypothetical Situation 2 Fiscal space calculated by factoring in Scenarios 1~3 under the assumption of a national debt ratio 1.9 times higher than the current level (Germany’s debt-to-GDP ratio 20 years after unification)
South Korea’s fiscal space is large enough to maintain the current level of expenditures while still keeping fiscal sustainability. As shown in Table 2, South Korea can afford a debt-to-GDP ratio of 393 percent (debt limit) with the assumption that its 2015 fiscal stance is maintained. Here the fiscal space-to-GDP ratio is measured to be considerably high at 360 percent (the difference between the debt limit and the 2015 debt ratio, which is 37.9 percent). All the other countries observed in this study, barring Greece, are found able to keep fiscal sustainability. South Korea is ranked 18th in terms of debt limit. When it comes to fiscal space, its ranking is higher at 8th. The outcome is attributable to the fact that South Korea
has been keeping its national debt at levels (39.9 percent) considerably lower than the OECD average (79.1 percent). The South Korean welfare state’s long-term fiscal sustainability is not at a level that causes concern even given that this analysis does not take into account data beyond 2015 and therefore does not take into account recent increases in national debt, as South Korea would be able to maintain sufficient fiscal space even under the assumption of worse-case scenarios. A stark contrast to South Korea is Japan, where, because of its high current debt levels, even a high debt limit-to-GDP ratio of 411 percent does not leave it much fiscal space. This suggests that to keep fiscal sustainability over time requires keeping the national debt at manageable levels.
[Table 2] Debt limit and fiscal space for selected countries (as % of GDP)
Country Debt limit Fiscal space
As % of GDP Ranking As % of GDP Ranking South Korea 393.2 18 355.3 8 Greece 40.2 29 -136.7 29 Netherlands 399.5 8 334.4 13 Norway 392.6 21 364.6 3 New Zealand 393.2 19 363.2 5 Denmark 398.8 9 353.3 9 Germany 398.2 11 327.2 15 Latvia 398.4 10 363.4 4 US 397.8 12 308.8 20 Belgium 400.5 7 294.5 24 Sweden 406.2 6 362.8 6 Swiss 397.4 13 351.8 11 Spain 409.5 4 310.3 19 Slovakia 408.3 5 355.4 7 Slovenia 396.2 15 313.0 18 Iceland 380.7 27 313.1 17 Ireland 534.3 1 455.7 1 UK 395.2 16 306.2 22 Austria 394.2 17 308.0 21 Italy 378.3 28 245.6 27 Japan 411.2 2 163.2 28 Czech Republic 410.2 3 369.8 2 Canada 383.3 25 291.8 25 Portugal 383.0 26 254.0 26 Poland 397.2 14 345.9 12 France 392.9 20 296.8 23 Finland 389.9 24 327.4 14 Hungary 391.6 22 316.3 16 Australia 390.4 23 352.8 10 Average 388.4 ㆍ 309.2 ㆍ
[Figure 1] An international comparison of national debt ratios (as % of GDP)
Source: IMF International Financial Statistics. https://data.imf.org (as of Nov. 2, 2019)
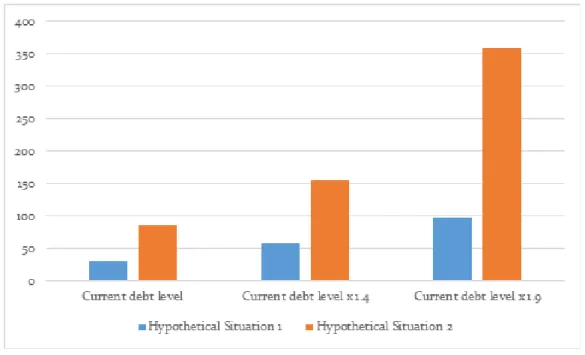
As illustrated in Figure 2, even with North Korea’s population structure and labor market situations factored in, South Korea’s fiscal space-to-GDP ratio is over 150 percent, implying that fiscal sustainability is well preserved. This further indicates the healthy fiscal state of the South Korean welfare state. Hypothetical Situation 1 in Figure 2 is drawn from Germany’s post-unification fiscal state. Even under this hypothesis, where South Korea’s debt-to-GDP ratio is twice the 2015 level, the fiscal space-to-GDP ratio is as high as 250 percent. Even with the assumed increases of the magnitude Germany had seen in its national debt and interest rate after its unification, South Korea is still left with ample fiscal space.
[Figure 2] South Korea’s fiscal space as % of GDP under different debt-level assumptions (current debt level, current debt level x 1.4, current debt level x 1.9)
Notes: ‘Inter-Korean integration 1’ factors in the total dependency ratio, projected % of the elderly population, and unemployment rate for the combined population (based on data from international organizations); ‘Inter-Korean integration 2’ assumes an estimated minimum unemployment rate of 25 percent for the North Korean population aged 25~59 (based on data from international organizations and from Suk Lee (KDI FOCUS, 78, 1-8)); ‘Inter-Korean integration 3’ assumes an estimated maximum unemployment rate of 56 percent for the North Korean Population aged 25~59 (based on data from international organizations and from Suk Lee (KDI FOCUS, 78, 1-8)); “Long-term interest rate’ comes from the IMF’s International Financial Statistics; ‘Assumed interest rate 1’ is estimated by using Vector Auto-regression Model (I), factoring in national debt, government revenues, government expenditures, output gap, inflation rate and short- and long-term interest rates; ‘Assumed interest rate 2’ is estimated by using Vector Auto-regression Model (I), factoring in national debt; ‘Hypothetical Situation 1’ is based on the average treasury bond interest rates growth rates for Germany for the first 3 years after its unification; ‘Hypothetical Situation 2’ factors in South Korea’s treasury bond interest rate and growth rate during the 1997 economic crisis.
Figure 3 shows the extent to which South Korea’s fiscal space shrinks when inter-Korean integration is assumed. The difference shown here is between the fiscal space estimated based on the observed long-term interest rate without assuming inter-Korean integration on the one hand, and the fiscal space estimated based on the scenario cases on the other. South Korea’s fiscal space is smaller under the assumption of inter-Korean integration than under the assumption of no integration. However, even when inter-Korean integration is assumed, South Korea’s fiscal sustainability would not get undermined under the 2015 fiscal stance. Figure 3 illustrates a hypothesis where South Korea’s national debt ratio is 1.9 times higher than the 2015 level. Under this hypothesis, an economic recession comparable to the one that transpired in 1997 might as well put South Korea’s fiscal sustainability at risk, as here the fiscal space shrinks to close to zero, as shown in Figure 2. However, caution should be taken against over-interpretation of this situation, as it is not a realistic scenario, although it is necessary to prepare beforehand for fiscal risks that may lie ahead.
[Figure 3] Difference in South Korea’s fiscal space between South Korea and an integrated Korea (as % of GDP)
Note: The difference in fiscal space is between South Korea’s fiscal space projected based on the observed long-term interest rate (without assuming inter-Korean integration) and fiscal space projected in inter-Korean integration scenarios; ‘Hypothetical Situation 1’ is based on the average treasury bond interest rates growth rates for Germany for the first 3 years after its unification; ‘Hypothetical Situation 2’ factors in South Korea’s treasury bond interest rate and growth rate during the 1997 economic crisis.
Concluding remarks
South Korea’s fiscal state is robust enough to remain sustainable even in inter-Korean integration scenarios. This would hold even after factoring in the upward trend from 2015 onward in social expenditures and the national debt. Even in scenarios with fiscal situations comparable to those of Germany after its unification, South Korea is found to have sufficient fiscal space. This suggests that caution should be taken against over-emphasizing the fiscal risks associated with inter-Korean integration. To be sure, our understanding is limited as to the actual conditions prevailing North Korea. Uncertainties abound in international relations that lie beyond the control of the two Koreas. Some of these uncertainties can be done away with as the two Koreas strengthen their mutual understanding through continued dialogue. Also, continued efforts toward improving inter-Korean cooperation and social security programs will prove conducive for reducing to some extent the costs of unification.