JHEP10(2016)006
Published for SISSA by Springer
Received: March 13, 2016 Revised: August 27, 2016 Accepted: September 16, 2016 Published: October 3, 2016
Search for new physics with the M
T2variable in all-jets final states produced in pp collisions at
√ s = 13 TeV
The CMS collaboration
E-mail: [email protected]
Abstract: A search for new physics is performed using events that contain one or more jets, no isolated leptons, and a large transverse momentum imbalance, as measured through theMT2variable, which is an extension of the transverse mass in events with two invisible particles. The results are based on a sample of proton-proton collisions collected at a center-of-mass energy of 13 TeV with the CMS detector at the LHC, and that corresponds to an integrated luminosity of 2.3 fb−1. The observed event yields in the data are consistent with predictions for the standard model backgrounds. The results are interpreted using simplified models of supersymmetry and are expressed in terms of limits on the masses of potential new colored particles. Assuming that the lightest neutralino is stable and has a mass less than about 500 GeV, gluino masses up to 1550–1750 GeV are excluded at 95% confidence level, depending on the gluino decay mechanism. For the scenario of direct production of squark-antisquark pairs, top squarks with masses up to 800 GeV are excluded, assuming a 100% branching fraction for the decay to a top quark and neutralino. Similarly, bottom squark masses are excluded up to 880 GeV, and masses of light-flavor squarks are excluded up to 600–1260 GeV, depending on the degree of degeneracy of the squark masses.
Keywords: Hadron-Hadron scattering (experiments), Supersymmetry ArXiv ePrint: 1603.04053
JHEP10(2016)006
Contents
1 Introduction 1
2 The CMS detector 2
3 Simulated event samples 2
4 Event reconstruction 3
5 Event selection 5
5.1 Signal regions 7
6 Backgrounds 8
6.1 Estimation of the background from leptonic W boson decays 8
6.2 Estimation of the background from Z(νν)+jets 10
6.3 Estimation of the multijet background 13
6.4 Cross-check of multijet background estimation 16
7 Results and interpretation 17
8 Summary 20
A Detailed results 25
B Aggregated regions 32
C Summary plots 36
The CMS collaboration 42
1 Introduction
Searches for new physics based on final states with jets and large transverse momentum imbalance are sensitive to broad classes of new physics models, including supersymmetry (SUSY) [1–8]. Such searches were previously conducted by both the CMS [9–13] and ATLAS [14,15] collaborations, using data from 8 TeV proton-proton (pp) collisions. They placed lower limits on the masses of pair-produced colored particles near the TeV scale for a broad range of production and decay scenarios and provided some of the most stringent constraints on the production of supersymmetric particles. These searches are particularly interesting at this time as they are among the first to benefit from the increase in the CERN LHC center-of-mass energy from 8 to 13 TeV, as shown in two recent analyses of these final
JHEP10(2016)006
states by ATLAS and CMS [16,17]. As a consequence of the increase in parton luminosity at 13 TeV, the cross section for the pair production of particles with the color quantum numbers of a gluon increases by more than a factor of 30 for a particle of mass 1.5 TeV.
In this paper we present results of a search for new physics in events with jets and significant transverse momentum imbalance, as characterized by the “stransverse mass”
MT2, a kinematic variable that was first proposed for use in SUSY searches in refs. [18,19]
and used in several Run 1 searches [13,20]. The search is performed using a data sample corresponding to an integrated luminosity of 2.3 fb−1 of pp collisions collected at a center- of-mass energy of 13 TeV with the CMS detector at the LHC.
In this analysis we select events with at least one jet and veto events with an identified, isolated lepton. Signal regions are defined by the number of jets, the number of jets identi- fied as a product of b quark fragmentation (b-tagged jets), the scalar sum of jet transverse momenta (HT), andMT2. The observed event yields in these regions are compared with the background expectation from standard model (SM) processes and the predicted contribu- tions from simplified supersymmetric models of gluino and squark pair production [21–25].
2 The CMS detector
The central feature of the CMS apparatus is a superconducting solenoid, 13 m in length and 6 m in diameter, which provides an axial magnetic field of 3.8 T. Within the field volume are several particle detection systems. Charged-particle trajectories are measured with silicon pixel and strip trackers, covering 0 ≤φ <2π in azimuth and |η|<2.5 in pseudorapidity, whereη ≡ −ln[tan(θ/2)] andθ is the polar angle of the trajectory of the particle with re- spect to the beam direction. The transverse momentum, the component of the momentump in the plane orthogonal to the beam, is defined in terms of the polar angle aspT=psinθ. A lead-tungstate crystal electromagnetic calorimeter and a brass and scintillator hadron calor- imeter surround the tracking volume, providing energy measurements of electrons, photons, and hadronic jets in the range|η|<3.0. Muons are identified and measured within|η|<2.4 by gas-ionization detectors embedded in the steel flux-return yoke of the solenoid. Forward calorimeters on each side of the interaction point encompass 3.0<|η|<5.0. The detector is nearly hermetic, allowing momentum imbalance measurements in the plane transverse to the beam direction. A two-tier trigger system selects pp collision events of interest for use in physics analyses. A more detailed description of the CMS detector is available in ref. [26].
3 Simulated event samples
Monte Carlo (MC) simulations are used in the estimate of some of the SM backgrounds, as well as to calculate the selection efficiency for various new physics scenarios. The main back- ground and control samples (W+jets, Z+jets, tt+jets, γ+jets, and QCD multijet events), as well as signal samples of gluino and squark pair production, are generated with theMad- Graph5 generator [27] interfaced withpythia8.2 [28] for fragmentation and parton show- ering. Signal processes are generated at leading order with up to two extra partons present in the event. Other background samples are generated withMadGraph [email protected] [29]
JHEP10(2016)006
(s channel single top, ttW, ttZ, ttH) and with powheg v2 [30, 31] (t channel single top, tW), both interfaced withpythia8.2 [28].
Next-to-leading order (NLO) and next-to-NLO cross sections [29–34] are used to normalize the simulated background samples, while NLO plus next-to-leading-logarithm (NLL) calculations [35] are used for the signal samples. The NNPDF3.0LO and NNPDF3.0NLO [36] parton distribution functions (PDF) are used, respectively, withMad- Graph, and withpowheg v2 andMadGraph amc@nlo. Standard model processes are simulated using ageant4 based model [37] of the CMS detector, while the simulation of new physics signals is performed using the CMS fast simulation package [38]. All simulated events include the effects of pileup, i.e. multiple pp collisions within the same or neighbor- ing bunch crossings, and are processed with the same chain of reconstruction programs as used for collision data.
4 Event reconstruction
Event reconstruction is based on the particle-flow (PF) algorithm [39,40], which combines information from the tracker, calorimeter, and muon systems to reconstruct and identify PF candidates, i.e. charged and neutral hadrons, photons, muons, and electrons. We select events with at least one reconstructed vertex that is within 24 cm (2 cm) of the center of the detector in the direction along (perpendicular to) the beam axis. In the presence of pileup, usually more than one such vertex is reconstructed. We designate as the primary vertex (PV) the one for which the summedp2T of the associated charged PF candidates is the largest.
Charged PF candidates associated with the PV and neutral particle candidates are clustered into jets using the anti-kT algorithm [41] with a distance parameter of 0.4. The jet energy is calibrated using a set of corrections similar to those developed for the 8 TeV data [42]: an offset correction accounting for neutral energy arising from pileup interactions in the area of the reconstructed jet; a relative correction that makes the jet energy response, i.e. the ratio of the reconstructed to the original jet energy, uniform inpTandη; an absolute correction that restores the average jet energy response to unity; and a residual correction, applied to account for remaining differences between data and simulation.
Jets originating from b quarks are identified by the combined secondary vertex al- gorithm [43]. We use a working point with a tagging efficiency of approximately 65%
for jets originating from b quarks with momenta typical of top quark pair events. For jets with transverse momentum above approximately 200 GeV, the tagging efficiency de- creases roughly linearly, reaching an efficiency of about 45% at 600 GeV. The probability to misidentify jets arising from c quarks as b jets is about 12%, while the corresponding probability for light-flavor quarks or gluons is about 1.5%.
The transverse hadronic energy, HT, is defined as the scalar sum of the magnitudes of the jet transverse momenta, while the missing transverse hadronic momentum, HTmiss, is defined as the negative vector sum of the transverse momenta of the same jets. Except for a few cases described later, the construction of higher-level variables and the event categorization are based on jets withpT>30 GeV,|η|<2.5, and passing loose requirements
JHEP10(2016)006
on the jet composition designed to reject rare spurious signals arising from noise and failures in the event reconstruction [44]. The transverse momentum imbalance (~pTmiss), whose magnitude is referred to asETmiss, is defined as the negative of the vector sum of the transverse momenta of all reconstructed charged and neutral PF candidates.
Electron candidates are reconstructed as clusters of energy deposits in the electro- magnetic calorimeter, matched to tracks in the silicon tracker [45]. We identify electrons having pT > 10 GeV by loose requirements on the shape of these energy deposits, on the ratio of energy in associated hadron and electromagnetic calorimeter cells (H/E), on the geometric matching between the energy deposits and the associated track, and on the con- sistency between the energy reconstructed from calorimeter deposits and the momentum measured in the tracker. In addition, we require that the associated track be consistent with originating from the PV. The PF algorithm applies a looser set of requirements to identify “PF electrons” with even smaller transverse momenta. We use it to extend the range of identified electrons down to pT >5 GeV.
Muon candidates are reconstructed by combining tracks found in the muon system with corresponding tracks in the silicon detectors. Candidates are required to be classified as either Global Muons or Tracker Muons, according to the definitions given in ref. [46], when they have pT > 10 GeV. The associated silicon detector track is required to be consistent with originating from the PV. The PF algorithm applies looser requirements to identify “PF muons” with even smaller transverse momenta. We use it to extend the range of identified muons down to pT>5 GeV.
The isolation of electrons and muons is defined as the scalar sum of the transverse mo- menta of all neutral and charged PF candidates within a cone ∆R=p
(∆η)2+ (∆φ)2along the lepton direction. The variable is corrected for the effects of pileup using an effective area correction [47], and the size of the cone is dependent on the lepton pT according to:
∆R=
0.2, pT≤50 GeV, 10 GeV
pT
, 50< pT ≤200 GeV, 0.05, pT>200 GeV.
(4.1)
The relative lepton isolation is the lepton isolation divided by the lepton pT.
When selecting PF electrons and muons, as well as isolated PF charged hadrons, a track-only isolation computed in a larger cone is used. Relative track isolation is calculated using all charged PF candidates within a cone ∆R <0.3 and longitudinal impact parameter
|∆z|<0.1 cm relative to the PV.
The efficiency for selecting prompt electrons, i.e., electrons from decays of electroweak bosons or SUSY particles, increases from 65–70% at apT of 10 GeV to 80–90% at 50 GeV, and plateaus at 85–95% above 100 GeV, where the smaller values are from signal samples with high jet multiplicity and the larger numbers are from tt+jets events. For prompt muons, the efficiency increases from 75–90% at a pT of 10 GeV to 85–95% at 50 GeV, and plateaus at 95–99% above 200 GeV.
Photon candidates, used in the estimation of the Z→ννbackground, are reconstructed from deposits in the electromagnetic calorimeter and are selected using the shower shape
JHEP10(2016)006
Online trigger selection [GeV] Offline selection [GeV]
HT >800 HT >1000 &ETmiss >30 HT >350 &ETmiss>100 HT >450 &ETmiss >200 HTmiss >90 &ETmiss >90 & noise removal criteria HT >200 &ETmiss >200
Table 1. The three signal triggers and the corresponding offline selections.
variable (σηη) and the ratio H/E [48]. Additionally, we require that their track isolation in a cone ∆R <0.3 be less than 2.5 GeV.
5 Event selection
Before assigning events to different signal regions, the baseline selection described in this section is implemented. Collision events are selected using triggers with different require- ments onHT,ETmiss, andHTmiss. Table1summarizes the triggers and corresponding offline selections, after which the triggers are found to be>98% efficient. As shown in the table, events with HT <1000 GeV are selected with triggers that impose an ETmiss requirement.
As a consequence, for the low HT sample we employ a tighter requirement on the offline value of ETmiss.
The events passing the selections of table 1 are further divided according to the total number of jets (Nj) and the number of jets identified as originating from b quarks (Nb).
When determiningNb, we lower the jetpT threshold from 30 to 20 GeV in order to increase sensitivity to potential signal scenarios with soft decay products.
For events with at least two reconstructed jets, we start with the pair having the largest dijet invariant mass and iteratively cluster all selected jets using a hemisphere algorithm that minimizes the Lund distance measure [49, 50] until two stable pseudo-jets are obtained. The resulting pseudo-jets together with the p~Tmiss are used to determine the stransverse massMT2[18,19]. This kinematic mass variable, which can be considered as a generalization of the transverse mass variable MT defined in ref. [51], was introduced as a means to measure the mass of pair-produced particles in situations where both decay to a final state containing the same type of undetected particle. The variableMT2is defined as:
MT2= min
~
pTmissX(1)+~pTmissX(2)=~pTmiss
hmax
MT(1), MT(2)i
, (5.1)
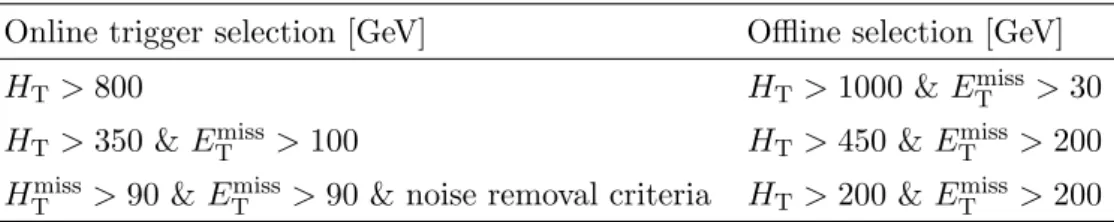
where~pTmissX(i) (with i= 1,2) are the unknown transverse momenta of the two undetected particles and MT(i) the transverse masses obtained by pairing any of the two invisible par- ticles with one of the two pseudojets. The minimization is performed over trial momenta of the undetected particles fulfilling the ~pTmiss constraint. Most of the background from QCD multijet events (defined more precisely in section 6) is characterized by very small values of MT2, while a wide class of new physics models imply large values of stransverse mass. Figure1 shows theMT2 distributions expected from simulation for the background processes and one signal model, the gluino-mediated bottom squark production described
JHEP10(2016)006
[GeV]
MT2 0 200 400 600 800 1000 1200 1400
Events / 50 GeV
1 10 102
103
104
105
106
107
108 HT > 200 GeV > 30 GeV
miss
ET
≥0b
≥2j,
Multijet Top quark W+jets
ν ν Z →
0
χ1
b
→ b g~ , g~ g~ pp →
= 1100 GeV
g~
m
= 100 GeV
0 χ1
m∼
(13 TeV) 2.3 fb-1
CMS Simulation
Figure 1. Distribution of theMT2variable in simulated background and signal event samples after the baseline selection is applied. The line shows the expectedMT2 distribution for a signal model of gluino-mediated bottom squark production with the masses of gluino and lightest neutralino equal to 1100 and 100 GeV, respectively. The simplified signal model is described in refs. [21–25]
and in the text.
in refs. [21–25] and section 7. Selections based on the MT2 variable are a powerful means to reduce the contribution from multijet events to a subleading component of the total background. A complete discussion of the MT2 properties as a discovery variable and details about the exact calculation of the variable are given in refs. [13,20].
The main selection to suppress the background from multijet production is the re- quirement MT2>200 GeV in events with at least two reconstructed jets. Even after this requirement, a residual background contribution with larger MT2 values remains, arising primarily from events in which the energy of a jet has been severely underestimated. To further suppress background events resulting from this effect, we require ∆φmin > 0.3, where ∆φmin is defined as minimum azimuthal angle between the ~pTmiss vector and up to four highest pT jets. For the purpose of the ∆φmin calculation only, we consider jets with
|η| < 4.7. The number and definition of jets entering the ∆φmin calculation are chosen to maximize signal to background separation. In addition, we require that the magnitude of the vector difference in the transverse momentum imbalance determined using either the selected jets (H~Tmiss) or all PF candidates (~pTmiss) satisfy |~pTmiss−H~Tmiss|/ETmiss <0.5.
This requirement protects against large imbalances arising from objects with pT<30 GeV or |η| > 2.5. Finally, events with possible contributions from beam halo processes or anomalous noise in the calorimeters are rejected using dedicated filters [52].
To reduce the background from SM processes with genuine ETmiss arising from the decay of a W boson, we reject events with an identified electron or muon withpT>10 GeV and |η| < 2.4. Only electrons (muons) with a relative isolation less than 0.1 (0.2) are considered in the veto. Events are also vetoed if they contain an isolated charged PF candidate (electron, muon or charged hadron) to reject τ leptons decaying to leptons or hadrons. To avoid loss of efficiency in potential signals with large jet multiplicities, events
JHEP10(2016)006
are only vetoed if the transverse mass (MT) formed by the momentum of the isolated charged PF candidate and~pTmiss is less than 100 GeV, consistent with the leptonic decay of a W boson. For charged candidates identified as a PF electron or muon, we veto the event if the candidate haspT >5 GeV and a relative track isolation of less than 0.2. For charged candidates identified as a PF hadron, we veto the event if the candidate has pT>10 GeV and a relative track isolation of less than 0.1.
5.1 Signal regions
Signal regions are defined separately for events with either exactly one jet passing the counting criteria above, or with two or more jets. Events with Nj ≥ 2 are categorized based onHT,Nj,Nb as follows:
• 5 bins in HT: [200,450], [450, 575], [575, 1000], [1000, 1500], and >1500. These bins, which are expressed in GeV, are also referred to as very low HT, low HT, medium HT, high HT, and extremeHT regions,
• 11 bins inNj and Nb: 2–3j & 0b, 2–3j & 1b, 2–3j & 2b, 4–6j & 0b, 4–6j & 1b, 4–6j
& 2b,≥7j & 0b,≥7j & 1b,≥7j & 2b, 2–6j &≥3b,≥7j & ≥3b.
Each bin defined by the HT, Nj, Nb requirements above is referred to as a “topological region”.
Since SUSY events could result in MT2 distributions harder than the remaining SM backgrounds, we further divide each topological region in bins of MT2, expressed in GeV, as follows:
• 3 bins at very-low HT: [200,300], [300,400], and>400,
• 4 bins at low HT: [200,300], [300,400], [400,500], and >500,
• 5 bins at medium HT: [200,300], [300,400], [400,600], [600,800], and >800,
• 5 bins at high HT: [200,400], [400,600], [600,800], [800, 1000], and >1000,
• 5 bins at extreme HT: [200,400], [400,600], [600,800], [800,1000], and >1000.
For events with Nj = 1, i.e. belonging to the “monojet” signal regions, the MT2 variable is not defined. We instead opt for a simpler strategy with signal regions defined by the pT of the jet and Nb:
• Nb: 0b,≥1b,
• 7 bins in jet pT, indicated in GeV, which are defined as follows: [200,250], [250,350], [350,450], [450,575], [575,700], [700,1000], and >1000.
In order to have more than one event expected in each signal region, the actualMT2(or jet pT) binning is coarser than indicated above for some of the topological regions. A complete list of the signal bins is provided in tables 4, 5, and 6 in appendix A. In total, we define 172 separate signal regions.
JHEP10(2016)006
6 Backgrounds
There are three sources of SM background to potential new physics signals in a jets plus ETmiss final state:
• “Lost lepton background”: events with genuine invisible particles, i.e. neutrinos, from leptonic W boson decays where the charged lepton is either out of acceptance, not reconstructed, not identified, or not isolated. This background comes from both W+jets and tt+jets events, with a small contribution from single top quark pro- duction, and is one of the dominant backgrounds in nearly all search regions. It is estimated using a one-lepton control sample, obtained by inverting the lepton veto in each topological region.
• “Z →νν background”: Z+jets events where the Z boson decays to neutrinos. This almost irreducible background is most similar to potential signals. It is a major back- ground in nearly all search regions, its importance decreasing for tighter requirements on Nb. This background is estimated usingγ+jets and Z→`+`− control samples.
• “Multijet background”: mostly instrumental background that enters a search region because of either significant mismeasurement of the jet momentum or sources of anomalous noise in the detector. There is also a small contribution from events with genuineETmiss from neutrinos produced in semi-leptonic decays of charm and bottom quarks. To suppress this background we apply the selections described in section 5, after which this type of background is sub-dominant in almost all search regions.
The background is estimated from a control sample obtained by inverting the ∆φmin requirement in each topological region.
For all three categories, the event yields in the control regions are translated into back- ground estimates in the signal regions using “transfer factors”, either based on simulation or measured in data, which are described in the next sections.
6.1 Estimation of the background from leptonic W boson decays
Single-lepton control regions are used to estimate the background arising from leptonic W boson decays in W+jets and tt+jets processes. Control region events are selected using the same triggers as for signal regions, and the baseline selections of section5are applied with the exception of the lepton veto. Instead, we require exactly one lepton candidate passing either the PF lepton selection (e orµonly) or the lepton selection used in lepton vetoes. In addition, we requireMT(`, ~pTmiss)<100 GeV to reduce potential contamination from signal.
Selected events are then grouped into the categories described in section 5.1, binning the single-lepton control regions in the HT, Nj, and Nb dimensions, but not in MT2, to preserve statistical precision. The binning in Nj and Nb is the same as that of the signal regions, except for signal bins with Nj ≥ 7 and Nb ≥ 1. For these signal regions, the background prediction is obtained using a control region with the same HT selection as the signal and requiringNj≥7 and 1≤Nb≤2. This is motivated by the scarcity of data in control regions with Nj ≥7 and Nb ≥2 as well as potential contamination from signal
JHEP10(2016)006
in bins withNj ≥7 and Nb ≥3. For events with Nj= 1, one control region is defined for each bin of jet pT.
The background yieldN1`SR in each signal region SR is obtained from the corresponding single-lepton yieldN1`CRin the control region CR by the application of transfer factorsR0`/1`MC and kMC, and according to the following equation:
N1`SR(HT, Nj, Nb, MT2) =N1`CR(HT, Nj, Nb) R0`/1`MC (HT, Nj, Nb) kMC(MT2). (6.1) The number of events for which we fail to reconstruct or identify an isolated lepton can- didate is obtained via the factor R0`/1`MC (HT, Nj, Nb), which accounts for lepton acceptance and selection efficiency and the expected contribution from the decay of W bosons to hadrons through an intermediate τ lepton. The factor R0`/1`MC is obtained from simulation and corrected for small measured differences in lepton efficiency between data and simu- lation. The fraction of events in each topological region expected to populate a particular MT2bin,kMC(MT2), is used to obtain the estimate in each search bin and is also obtained from simulation.
Normalization to data control regions reduces reliance on the MC modeling of most kinematic quantities, exceptMT2. The uncertainty inkMC(MT2) is evaluated in simulation by variations of the important experimental and theoretical parameters. Reconstruction uncertainties, assessed by varying the tagging efficiency for b quarks, and by evaluating the impact of variations in jet response on the counting of jets and b-tagged jets, EmissT , and MT2, are typically found to be less than 10%, but can reach as much as 40% in some bins. Renormalization and factorization scales, PDFs [53], and the relative composition of W+jets and tt+jets are varied to assess the dominant theoretical uncertainties, which are found to be as large as 30%. Based on these results, for kMC(MT2) we assign a shape uncertainty that reaches 40% in the highest bins of MT2.
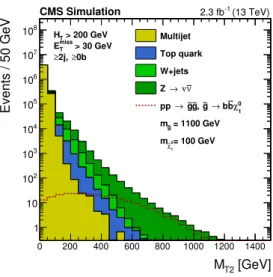
The MC modeling of the MT2 distribution is checked in data using control regions enriched in events originating from either W+jets or tt+jets, as shown in the left and right plots of figure2, respectively. An additional check is performed by comparing the standard estimate with that obtained by replacing the factor kMC(MT2) in eq. (6.1), with an extra dimension in the binning of the control region, which becomes N1`CR(HT, Nj, Nb, MT2).
The two estimates agree within the statistical precision permitted by the size of the control regions.
The single-lepton control regions typically have 1–2 times as many events expected as compared to the corresponding signal region. The statistical uncertainty in this event yield ranges from 1 to 100%, depending on the region, and is propagated to the final uncertainty in the background estimate. The transfer factorR0`/1`MC depends on the MC modeling of the lepton veto andMT selection efficiencies. Leptonic Z boson decays are used to evaluate the MC modeling of lepton selection efficiencies, and the resulting uncertainty propagated to the background estimate is found to be as large as 7%. TheMTselection efficiency is cross- checked using a similar dilepton sample and removing one of the leptons to mimic events where the W boson decays to a lepton, and an uncertainty of 3% is assigned by comparing data to simulation. The uncertainty in the MC modeling of the lepton acceptance, assessed by varying the renormalization and factorization scales and PDF sets, is found to be as
JHEP10(2016)006
[GeV]
MT2
200 400 600 800 1000 1200 1400
Events / Bin
−1
10 1 10 102
103
104
105
2j, 0b, 1 lepton
≥
> 200 GeV MT2
Data Top quark W+jets Multijet
(13 TeV) 2.3 fb-1
CMS
Data/MC0.5 1 1.5 2
[GeV]
MT2
200 300 400 500 600 700 800 900 1000
Events / Bin
−1
10 1 10 102
103 ≥ 2j, ≥ 2b, 1 lepton > 200 GeV MT2
Data Top quark W+jets Multijet
(13 TeV) 2.3 fb-1
CMS
Data/MC0.5 1 1.5 2
Figure 2. Comparison between simulation and data in the MT2 observable. The left and right plots correspond to control samples enriched in W+jets and tt+jets, respectively. The sum of the distributions from simulation is scaled to have the same integral as the corresponding histograms from data. The uncertainties shown are statistical only.
large as 5%. Finally, the uncertainty in the b tagging efficiency and the jet energy scale is typically less than 10%, although it can be as large as 40% in some bins.
The effect of signal contributions to the lost-lepton control samples can be non negligi- ble in some parts of signal parameter space, and is taken into account in the interpretations presented in section 7. Such a contribution would cause an overestimate of the lost-lepton background in the signal regions. In order to account for this effect, which is typically small but can become as large as 20% in some compressed scenarios, the predicted signal yield in each signal region is corrected by the amount by which the background would be overestimated.
6.2 Estimation of the background from Z(νν)+jets
The Z→νν background is estimated using aγ+jets control sample selected using a single- photon trigger. We select events where the photon haspT>180 GeV, to mimic the implicit requirement on the pT of the Z boson arising from the baseline selection MT2>200 GeV, and |η| < 2.5. The full baseline selection requirements are made based on kinematic variables re-calculated after removing the photon from the event, to replicate the Z→ νν kinematics.
Adopting a similar strategy as that used for the estimation of the lost-lepton back- ground, selected events are then grouped into the categories described in section 5.1, bin- ning the photon control regions in the HT, Nj, and Nb dimensions, but not in MT2, to preserve statistical precision. For events withNj= 1, one control region is defined for each bin of jetpT. The background estimateNZ→ννSR in each signal bin is obtained from the events
JHEP10(2016)006
(photon removed) [GeV]
HT
500 1000 1500 2000 2500 3000
Photon purity
0.7 0.75 0.8 0.85 0.9 0.95
1 (13 TeV)
2.3 fb-1
CMS
Data (fit) MC purity
≥0b
≥1j, HT [GeV]
500 1000 1500 2000 2500 3000
ratioγ) / - l+Z(l
0 0.02 0.04 0.06 0.08 0.1 0.12
(13 TeV) 2.3 fb-1
CMS Data Simulation
Data / MC 0.5
1 1.5
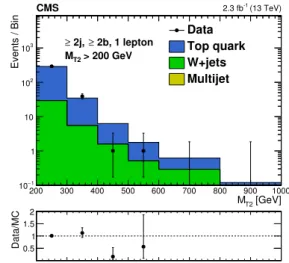
Figure 3. The left plot shows the photon purity, Pγ, measured in data for the single-photon control sample compared with the values extracted from simulation. The right plots show the Z/γ ratio in simulation and data as a function ofHT(upper plot), and the corresponding double ratio (lower plot).
yieldNγCRin the control region by the application of transfer factors according to eq. (6.2):
NZ→ννSR (HT, Nj, Nb, MT2) =
=NγCR(HT, Nj, Nb) Pγ(HT, Nj, Nb) f RZ/γMC(HT, Nj, Nb) kMC(MT2). (6.2) The prompt-photon purity, Pγ, which accounts for photons arising from meson decays, is measured in data by performing a template fit of the charged-hadron isolation distribution for eachHT,Nj, andNb region. The shape of the template for prompt photons is obtained from data by measuring the charged-hadron activity in cones well-separated from the photon and any jet. The isolation template for background photons arising from meson decays, which happen normally within hadronic jets, is also obtained from data using photon candidates that fail theσηη requirement. A prompt photon purity of 90–100%, as measured in data, is well reproduced by simulation as seen in the left plot of figure 3. A separate determination of the prompt photon purity using a tight-to-loose ratio method [54]
obtained from the charged-hadron isolation sideband is found to yield consistent results.
The Z → νν background in each bin of HT, Nj, and Nb is obtained from the corre- sponding photon control region yield via the factor RZ/γMC, which accounts for the photon acceptance and selection efficiency and the ratio of cross sections for the production of Z+jets andγ+jets events.
The ratio RZ/γMC is obtained from γ+jet events simulated with MadGraph with an implicit requirement ∆R >0.4 between the prompt photon and the nearest parton. As no such requirement can be made in data, a correction factorf = 0.92 is applied to account for the fraction of selected photons passing the ∆Rrequirement. This factor is determined from studies with samples of MadGraph+pythiaand pythia-only multijet events, the latter having no explicit requirement on the separation between the photon and the nearest par-
JHEP10(2016)006
ton. The ratioRZ/γMC obtained from simulation is validated in data using Z→`+`− events.
In this validation, the baseline selection is applied to the Z→`+`− sample after removing the reconstructed leptons from the event, to replicate the kinematics of Z → νν, and the top-quark background contamination is subtracted. The upper right plot of figure3shows theRZ/γratios in simulation and in data, while the double ratio, RdataZ→`+`−/γ/RZ→`MC+`−/γ, is shown in the lower right plot. The values are shown in bins of HT, after corrections to ac- count for measured differences between data and simulation in lepton and photon selection efficiencies and in b tagging. The double ratio shows no significant trend as a function of HT, and a correction factor of 0.95 is applied toRZ/γMC to account for the observed deviation from unity. Similarly, the double ratio as a function of Nj and Nb shows no significant trends and is found to be consistent with unity after the same correction factor is applied.
As in the case of the estimate of the single-lepton background, normalization to data control regions reduces reliance on the MC modeling to a single dimension, MT2. The fraction of events in each topological region expected to populate a particular MT2 bin, kMC(MT2), is used to obtain the estimate in each search bin. The uncertainty in this frac- tion in eachMT2bin is evaluated in simulation by variations of the important experimental and theoretical quantities. Theoretical uncertainties represent the largest contribution, and are assessed by variations of the renormalization and factorization scales and PDF sets.
Smaller contributions from reconstruction uncertainties are determined by varying the b- tagging efficiency and the mistag rate, and by evaluating the impact of variations in jet energy response on the counting of jets and b-tagged jets, ETmiss, andMT2. Experimental and theoretical uncertainties in kMC(MT2) total as much as 30% at large values of MT2. Based on these results, we assign an uncertainty for kMC(MT2) that reaches 40% in the highest bins of MT2.
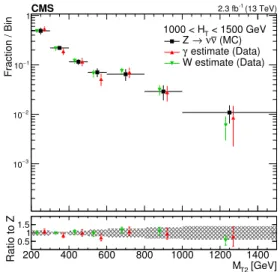
The MC modeling of theMT2variable is checked in data using highly populated control samples of γ+jets and W→`ν events. Figure 4 shows good agreement between the MT2 distribution obtained from these samples with that from Z→ννsimulation in the medium- and high-HT regions. In this comparison, the γ+jets sample is corrected based on Pγ, f, andRZ/γMC, while the W boson sample is corrected for top quark background contamination and rescaled by a RZ/WMC factor analogous to RMCZ/γ. Similarly to what is done for the lost- lepton background, an additional check is performed by comparing the standard estimate with that obtained by replacing the factor kMC(MT2) in eq. (6.2) with an extra dimension in the binning of the control region, which becomes NγCR(HT, Nj, Nb, MT2). These two estimates agree within the statistical precision permitted by the size of the control regions.
The single-photon control regions typically have 2–3 times as many events as compared to the corresponding signal regions. The statistical uncertainty in this yield ranges from 1 to 100%, depending on the region, and is propagated in the final estimate. The domi- nant uncertainty in the MC modeling ofRMCZ/γ comes from the validation of the ratio using Z→`+`−events. One-dimensional projections of the double ratio are constructed — sepa- rately in bins of number of jets, number of b-tagged jets, andHT(figure3, right) — and an uncertainty inRZ/γMCin each bin ofNj,Nb, andHTis determined by adding in quadrature the uncertainty in the ratioRZ→``/γfrom the corresponding bins of the one-dimensional projec-
JHEP10(2016)006
Fraction / Bin
−3
10
−2
10
1
10−
1
< 1000 GeV 575 < HT
(MC) ν ν Z →
estimate (Data) γ
W estimate (Data) (13 TeV) 2.3 fb-1
CMS
[GeV]
MT2
200 400 600 800 1000 1200 1400
Ratio to Z
0.51 1.5
Fraction / Bin
−3
10
−2
10
1
10−
1
< 1500 GeV 1000 < HT
(MC) ν ν Z →
estimate (Data) γ
W estimate (Data) (13 TeV) 2.3 fb-1
CMS
[GeV]
MT2
200 400 600 800 1000 1200 1400
Ratio to Z
0.51 1.5
Figure 4. The shape of theMT2distribution from Z→ννsimulation compared to shapes extracted fromγandW data control samples in the medium- (left plot) and high-HTregions (right plot). The MT2 distributions in the data control samples are obtained after removing the reconstructed γ or lepton from the event, to replicate the kinematics of Z→νν. The ratio of the shapes derived from data to the Z→ννsimulation shape is shown in the lower plots, where the shaded band represents the uncertainty in the MC modeling of theMT2 variable. Data points are shifted horizontally by
±20 GeV to make the vertical error bars more visible.
tions. As sufficient data are not available to evaluate the double ratio for regions withNb≥ 3, and as no trends are visible in theNbdistribution forNb<3, we assign twice the uncer- tainty obtained in the nearest bin, i.e. Nb = 2. This uncertainty ranges from 10 to 100%, depending on the search region. An additional 11% uncertainty in the transfer factor, based on the observed offset of the double ratio from unity, is added in quadrature with the above.
The uncertainty in the measurement of the prompt photon purity includes a statistical contribution from yields in the isolation sideband that is typically 5–10%, but can reach as much as 100% for search regions requiring extreme values ofHTor largeNj. An additional 5% uncertainty is derived from variations in purity caused by modifications of the signal and background templates, and from a “closure test” of the method in simulation. We indicate with closure test a measurement of the ability of the method to predict correctly the true number of background events when applied to simulated samples. Finally, an uncertainty of 8% is assigned to cover differences in the correction fraction f observed betweenMadGraph+pythia andpythia-only simulations.
6.3 Estimation of the multijet background
The multijet background consists predominantly of light-flavor and gluon multijet events.
Though this background is expected to be small after requiring MT2>200 GeV, we esti- mate any residual contribution based on data control samples. For events with at least two jets, a multijet-enriched control region is obtained in each HT bin by inverting the ∆φmin
requirement described in section 5. For the high- and extreme-HT bins, control region events are selected using the same trigger as for signal events. For lower-HT regions, the
JHEP10(2016)006
[GeV]
MT2
60 70 100 200 300 400
0.01 0.1 1 10
rφ
< 1500 GeV 1000 < HT
Data
Data after subtraction Fit
(13 TeV) 2.3 fb-1
CMS
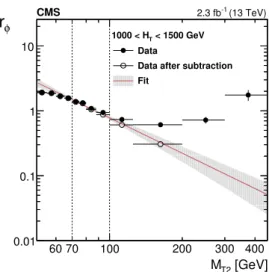
Figure 5. Distribution of the ratio rφ as a function of MT2 for the high-HT region. The fit is performed on the background-subtracted data points (open markers) in the interval 70 < MT2 <
100 GeV delimited by the two vertical dashed lines. The solid points represent the data before subtracting non-multijet backgrounds using simulation. Data point uncertainties are statistical only.
The line and the band around it show the fit to a power-law function and the associated uncertainty.
online ETmiss requirement precludes the use of the signal trigger, and the control sample is instead selected using prescaled HT triggers with lower thresholds. Prescaled triggers accept only a fixed fraction of the events that satisfy their selection criteria.
The extrapolation from low- to high-∆φmin is based on the following ratio:
rφ(MT2) =N(∆φmin>0.3)/N(∆φmin<0.3). (6.3) Studies in simulation show the ratio to be well described by a power law function,a(MT2)b. The parametersa, b are determined in eachHT bin by fitting the ratiorφ(MT2) in a side- band in data, i.e. 60< MT2<100 GeV, after subtracting non-multijet contributions using simulation. For the high- and extreme-HT regions, the fit is performed in a slightly nar- rower MT2 window, with the lower edge increased to 70 GeV. Data with lower values of MT2are not used, since in these events the ETmiss no longer arises predominantly from un- derestimated jet energies, but also receives important contributions from the measurement of energy not clustered into jets. The high-MT2 boundary of the fitting region is chosen to minimize the effect of the non-multijet contributions mentioned above. An example in the high-HT region is shown in figure 5. The inclusive multijet contribution in each HT
region, NincSR(MT2), is estimated using the fittedrφ(MT2) and the number of events in the low-∆φmin control region, NincCR(HT):
NincSR(MT2) =NincCR(HT) rφ(MT2). (6.4) From the inclusive multijet estimate in each HT region, the predicted background in bins of Nj and Nb is obtained from the following equation
Nj,bSR(MT2) =NincSR(MT2)fj(HT) rb(Nj), (6.5)
JHEP10(2016)006
Nj
2 3 4 5 6 7 8 9 10 11
0 0.2 0.4 0.6 0.8 1
fj 1.2 (13 TeV)
2.3 fb-1
CMS
< 1500 GeV 1000 < HT
Data Simulation
Nb
0 1 2 3 4 5 6
−3
10
−2
10
−1
10 b 1
r (13 TeV)
2.3 fb-1
CMS
≤ 6 Nj
4 ≤ Data Simulation
Figure 6. Fraction fj of multijet events falling in bins of number of jetsNj (left) and fractionrb
of events falling in bins of number of b-tagged jetsNb(right). Values offjandrbare measured in data, after requiring ∆φmin<0.3 and 100< MT2<200 GeV. The bands represent both statistical and systematic uncertainties of the estimate from simulation.
where fj is the fraction of multijet events falling in bin Nj, and rb is the fraction of all events in bin Nj that fall in bin Nb. Simulation indicates that fj and rb attain similar values in low- and high-∆φmin regions, and that the values are independent of MT2. We take advantage of this to measure the values of fj and rb using events withMT2 between 100–200 GeV in the low-∆φmin sideband, where fj is measured separately in each HT bin, while rb is measured in bins ofNj, integrated over HT, as rb is found to be independent of the latter. Values of fj and rb measured in data are shown in figure 6 compared to simulation.
An estimate based onrφ(MT2) is not viable in the monojet search region so a different strategy must be employed. Multijet events can pass the monojet event selections through rare fluctuations in dijet events, as when the transverse momentum of one of the two jets is severely underestimated because of detector response or because of particularly energetic neutrinos from b and c quark decays. In these cases, the resulting reconstructed jet can be assigned a transverse momentum below the jet-counting threshold (pT <30 GeV). In order to estimate this background contribution, we define a control region by selecting dijet events in which the leading jet has a transverse momentum pT>200 GeV (as in the mono- jet signal region), and the second jet has a transverse momentum just above threshold, i.e.
30< pT <60 GeV. These events must further pass an inverted ∆φminrequirement, in order to ensure statistical independence from the signal region. After subtracting non-multijet contributions, the data yield in the control region is taken as an estimate of the background in the monojet search regions. The rate of events with 30< pT<60 GeV is expected to be larger than that of events withpT<30 GeV, as the latter would require even larger detector response fluctuations. Closure tests on the simulation indicate a small overestimate. Never- theless, the multijet background is not expected to exceed 8% in any monojet search region.
JHEP10(2016)006
2-3j, 0b 2-3j, 1b 2-3j, 2b 4-6j, 0b 4-6j, 1b 4-6j, 2b 7j, 0b≥ 7j, 1b≥ 7j, 2b≥ 3b≥2-6j, 3b≥7j, ≥ 2-3j, 0b 2-3j, 1b 2-3j, 2b 4-6j, 0b 4-6j, 1b 4-6j, 2b 7j, 0b≥ 7j, 1b≥ 7j, 2b≥ 3b≥2-6j, 3b≥7j, ≥ 2-3j, 0b 2-3j, 1b 2-3j, 2b 4-6j, 0b 4-6j, 1b 4-6j, 2b 7j, 0b≥ 7j, 1b≥ 7j, 2b≥ 3b≥2-6j, 3b≥7j, ≥ 2-3j, 0b 2-3j, 1b 2-3j, 2b 4-6j, 0b 4-6j, 1b 4-6j, 2b 7j, 0b≥ 7j, 1b≥ 7j, 2b≥ 3b≥2-6j, 3b≥7j, ≥
Entries
−3
10
−2
10
−1
10 1 10 102
103
R&S prediction prediction
∆φ
(13 TeV) 2.3 fb-1
CMS
[450, 575] GeV
HT HT[575,1000] GeV HT[1000,1500] GeV HT> 1500 GeV
/R&Sφ∆
−1
10 1 10
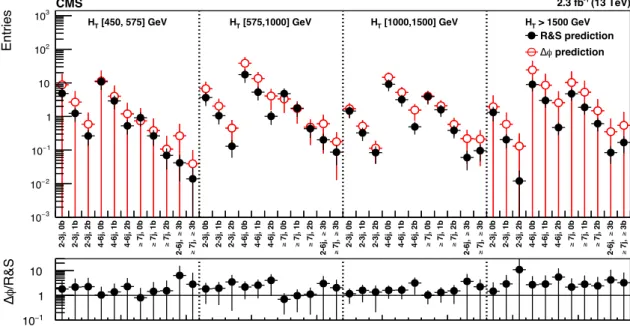
Figure 7. Comparison of the predictions of the multijet background in the topological regions (MT2 >200 GeV) from the R&S method and the ∆φminratio method. Both methods are described in ref. [55] and in the text, respectively. The uncertainties are combined statistical and systematic.
Within each of the fourHTcategories, the estimates from the ∆φmin ratio method are correlated as they are derived from the same fit to the ∆φmin ratio data. The lower plot shows the ratio of the estimates from the ∆φminand the R&S methods.
Statistical uncertainties due to the event yields in the control regions, where the rφ(MT2) fit is performed and the fj and rb values are measured, are propagated to the final estimate. The invariance of fj with MT2 and rb with MT2 and HT is evaluated in simulation, and residual differences are taken as additional systematic uncertainties, which are shown in figure6. An additional uncertainty is assigned to cover the sensitivity of the rφ value to variations in the fit window. These variations result in an uncertainty that increases with MT2 and ranges from 15 to 200%. The total uncertainty in the estimate covers the differences observed in closure tests based on simulation and in data control regions. The latter is performed in the 100< MT2<200 GeV sideband. For the monojet regions, the statistical uncertainty from the data yield in the dijet sideband is combined with a 50% systematic uncertainty in all bins.
6.4 Cross-check of multijet background estimation
As a cross-check of the ∆φmin ratio method described in section 6.3, the multijet back- ground is also estimated using the “rebalance and smear” (R&S) method described in ref. [55]. This method rebalances multijet events in data by adjusting the jet pT values to minimize ETmiss and then smears them multiple times in order to build a large sample of multijet events with nonzero ETmiss. During both the rebalance and the smearing steps, the jet pT values are varied according to a parameterization of the jet energy response.
The performance of the method has been tested on multijet simulation, as well as on data
JHEP10(2016)006
control regions defined by inverting the ∆φmin requirement or by selecting a sideband of MT2 (i.e. 100< MT2<200 GeV). Based on these studies, we assign total systematic un- certainties of 50% (low- and medium-HT regions) and 40% (high- and extreme-HTregions) in the background estimate based on R&S for MT2 > 200 GeV. These uncertainties also include a small (<7%) uncertainty due to contamination from W+jets and Z+jets events of the multijet data sample used in the R&S procedure.
In figure7, we compare the multijet predictions from the R&S method with those from the ∆φmin ratio method, i.e. the estimation method used in our analysis for multijet signal regions. This comparison is done separately for each topological region, integrating over MT2 bins. The level of agreement between the two methods serves to further increase our confidence in the multijet background estimation used for the final results of the analysis.
The R&S method cannot be applied to the very-low-HT region as not enough data are available in the relevant multijet control sample because of the small fraction of events accepted by the prescaled triggers with very low thresholds in HT.
7 Results and interpretation
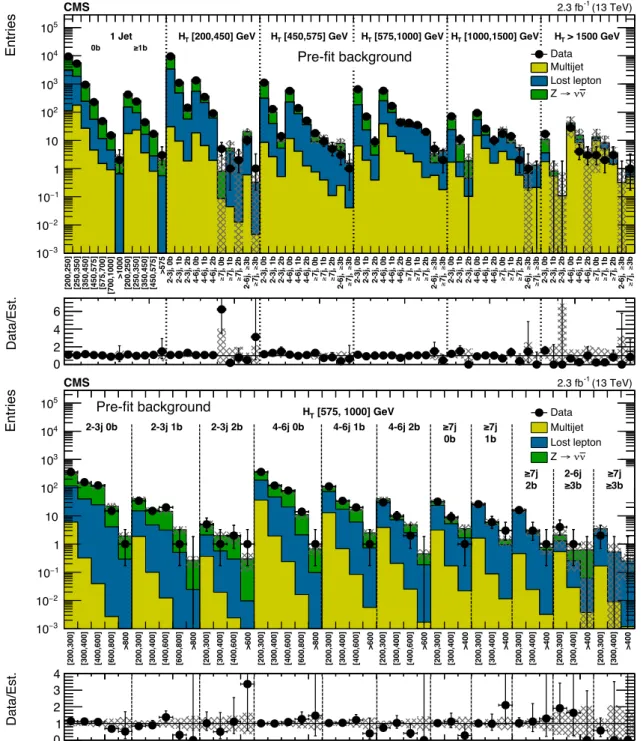
Figure8shows a summary of the observed event yields in data, together with the predicted total SM background. Each bin in the upper plot corresponds to a single (HT, Nj, Nb) search region integrated overMT2. The lower plot further breaks down the background es- timates and observed data yields into allMT2bins for the mediumHT region. The data are statistically compatible with the expected background contributions, providing no evidence for new physics: analyzing the 87 signal regions with a non-zero excess in the observed data, we see that three bins correspond to a p-value [56] approximately equal to 2σ, zero have a p-value larger than 3σ, and in general all p-values are compatible with a standard normal distribution. The background estimates and corresponding uncertainties shown in these plots rely exclusively on the inputs from control samples and simulation as described in section 6and are indicated in the rest of the text as “pre-fit background” results.
We also estimate the backgrounds in the signal regions performing a maximum- likelihood fit to the data in the signal regions themselves. These fits are carried out under either the background-only or background+signal hypotheses. The estimates from these fits, which still depend on the modeling of the backgrounds from the pre-fit procedure, are indicated as “post-fit” results and are utilized to constrain models of new physics as described below. Similar comparisons between data and background predictions, for both pre- and post-fit estimates, are shown for all the remaining HT regions in appendix A.
The results of the search are used to constrain specific models [21