JHEP03(2018)076
Published for SISSA by Springer Received: September 26, 2017 Revised: December 15, 2017 Accepted: February 25, 2018 Published: March 13, 2018
Search for new phenomena in final states with two opposite-charge, same-flavor leptons, jets, and missing transverse momentum in pp collisions at √
s = 13 TeV
The CMS collaboration
E-mail: [email protected]
Abstract: Search results are presented for physics beyond the standard model in final states with two opposite-charge, same-flavor leptons, jets, and missing transverse momen- tum. The data sample corresponds to an integrated luminosity of 35.9 fb−1 of proton- proton collisions at √
s = 13 TeV collected with the CMS detector at the LHC in 2016.
The analysis uses the invariant mass of the lepton pair, searching for a kinematic edge or a resonant-like excess compatible with the Z boson mass. The search for a kinematic edge targets production of particles sensitive to the strong force, while the resonance search targets both strongly and electroweakly produced new physics. The observed yields are consistent with the expectations from the standard model, and the results are interpreted in the context of simplified models of supersymmetry. In a gauge mediated supersymmetry breaking (GMSB) model of gluino pair production with decay chains including Z bosons, gluino masses up to 1500–1770 GeV are excluded at the 95% confidence level depending on the lightest neutralino mass. In a model of electroweak chargino-neutralino production, chargino masses as high as 610 GeV are excluded when the lightest neutralino is massless.
In GMSB models of electroweak neutralino-neutralino production, neutralino masses up to 500–650 GeV are excluded depending on the decay mode assumed. Finally, in a model with bottom squark pair production and decay chains resulting in a kinematic edge in the dilepton invariant mass distribution, bottom squark masses up to 980–1200 GeV are excluded depending on the mass of the next-to-lightest neutralino.
Keywords: Hadron-Hadron scattering (experiments), Supersymmetry, Beyond Standard Model, Lepton production
ArXiv ePrint: 1709.08908
JHEP03(2018)076
Contents
1 Introduction 1
2 Signal models 2
3 The CMS detector 4
4 Data sets, triggers, and object selection 5
5 Signal regions 7
6 Standard model background predictions 9
6.1 Flavor-symmetric backgrounds 10
6.2 Drell-Yan+jets backgrounds 12
6.3 Backgrounds with Z bosons plus genuine pmissT 14
7 Kinematic fit 14
8 Results 16
8.1 Results of the search in the on-Z signal regions 16
8.2 Results of the edge search 16
9 Interpretation 22
9.1 Systematic uncertainty in the signal yield 22
9.2 Interpretations using simplified models 23
10 Summary 27
A Correlation and covariance matrices for the background predictions 28
The CMS collaboration 36
1 Introduction
Supersymmetry (SUSY) [1–8] is a well-studied extension of the standard model (SM) and assumes a new fundamental symmetry that assigns a fermion (boson) to each SM boson (fermion). Supersymmetry resolves the hierarchy problem by stabilizing the Higgs boson (H) mass via additional quantum loop corrections from the top quark superpartner (top squark), which compensate for the large correction due to the top quark. IfR-parity [9] is conserved, the lightest SUSY particle (LSP) predicted by the theory is stable and poten- tially massive, providing a candidate for the observed dark matter. Many SUSY models also lead to the unification of the electroweak (EW) and strong forces at high energies [10,11].
JHEP03(2018)076
This paper presents a search for signatures of new physics in events with two opposite- charge, same-flavor (OCSF) leptons (electrons or muons), jets, and missing transverse momentum. Interpretations of the search results are given in terms of simplified super- symmetric model spectra. The data set of proton-proton collisions used for this search was collected in 2016 with the CMS detector at the CERN LHC at a center-of-mass energy of √
s = 13 TeV and corresponds to an integrated luminosity of 35.9 fb−1. Final states including an OCSF dilepton pair can occur in SUSY models via the decay of the super- partner of the SM neutral gauge bosons, the neutralino, when a heavier neutralino decays to a lighter neutralino LSP, or when the lightest neutralino is the next-to-lightest SUSY particle decaying to a gravitino LSP. Depending on the model parameters, the neutralino can decay into the LSP and either an on-shell Z boson or a virtual Z/γ∗ boson, with the boson decaying to two charged leptons. The neutralino can also possibly decay into a lep- ton and its supersymmetric partner (slepton), the latter decaying into another lepton and the LSP. Decays involving an on-shell Z boson are expected to produce an excess of events in which the dilepton invariant mass is compatible with the Z boson mass, referred to as the “on-Z signature”, while decays involving off-shell Z bosons or sleptons are expected to produce a characteristic edge shape in the invariant mass distribution of the dilepton system (m``) [12], denoted as the “edge signature”.
This search targets both the on-Z and edge signatures. For the on-Z signature, search regions are optimized separately depending on whether we target strong or EW SUSY production. In the case of strong production, the neutralino is part of a decay chain starting from a gluino or squark, while in the EW case, it is directly produced. The search for a kinematic edge is only performed under the assumption of strong SUSY production.
Searches for SUSY in these final states were performed previously by the CMS [13–18]
and ATLAS [19–21] Collaborations. The CMS Collaboration reported the presence of an excess with an edge shape located at m`` = 78.7±1.4 GeV and with a local significance of 2.4 standard deviations (s.d.) in the data set collected at a center-of-mass-energy of
√s= 8 TeV [13]. The ATLAS Collaboration did not confirm this excess in its √
s= 8 TeV dataset, but reported a resonant-like excess of events compatible with the Z boson mass and with a local significance of 3.0 s.d. [19]. Neither of these excesses were confirmed in the data sets collected at a center-of-mass-energy of√
s= 13 TeV during 2015 by the CMS Col- laboration [14] and during 2015 and the first half of 2016 by the ATLAS Collaboration [21].
2 Signal models
The results of this search are interpreted in the context of various simplified models of SUSY [22–26], as described below. In all models, the W, Z, and Higgs bosons are assumed to decay according to their SM branching fractions.
This search is designed to be sensitive to both strong and EW SUSY production leading to the on-Z signature. Most of the simplified models used for interpretation of the on-Z results represent gauge-mediated supersymmetry breaking (GMSB) models [27–29]. The first of these GMSB models assumes strong production of a pair of gluinos (eg) that each decays into a pair of quarks (u, d, s, c, or b) and the lightest neutralino, χe01. The χe01
JHEP03(2018)076
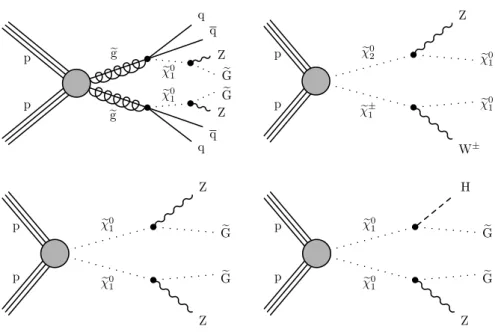
in turn decays into a massless gravitino (G) and an on-shell Z boson. The decay chaine corresponding to this gluino GMSB model is shown in figure1 (upper left).
The three other models used for the on-Z signature assume EW production. The upper right diagram in figure 1corresponds to chargino-neutralino (χe±1-χe02) production, with χe±1 decaying to a W boson and the LSP,χe01, while the next-to-lightest neutralino,χe02, decays to a Z boson andχe01. The production cross sections for this model are computed in a limit of mass-degenerate winoχe±1 and χe02, and light binoχe01, with all the other sparticles assumed to be heavy and decoupled. Gauge mediated supersymmetry breaking is not assumed for this WZ model, and theχe01 is allowed to be massive.
The remaining two models considered assume the production of neutralino-neutralino (χe01-χe01) pairs in GMSB. For bino- or wino-like neutralinos, the neutralino pair produc- tion cross section is very small, and thus we consider a specific GMSB model with mass- degenerate higgsinosχe±1,χe02, and χe01 as the next-to-lightest SUSY particles and a massless gravitino as the LSP [27–29]. In the production of any two of these, χe±1 orχe02 decays im- mediately to χe01 and low-momentum particles that do not impact the analysis, effectively yielding pair production of χe01χe01. Intermediate production of either χe±1 or χe02 is therefore not explicitly shown in the lower two diagrams of figure 1 representing these models. In the first model (lower left of figure 1), the only allowed decay of the lightest neutralino is to a Z boson and a massless gravitino. In the other model (lower two diagrams of figure1), the lightest neutralino is allowed to decay to a gravitino and either a Z boson or an SM-like Higgs boson, with a 50% branching fraction to each decay channel. The cross sections for higgsino pair production are computed in a limit of mass-degenerate higgsino states χe02, e
χ±1, andχe01, with all the other sparticles assumed to be heavy and decoupled. Following the convention of real mixing matrices and signed neutralino masses [30], we set the sign of the mass of χe01 (χe02) to +1 (−1). The lightest two neutralino states are defined as symmetric (anti-symmetric) combinations of higgsino states by setting the product of the elements Ni3 andNi4 of the neutralino mixing matrixN to +0.5 (−0.5) fori= 1 (2). The elements U12 and V12 of the chargino mixing matrices U and V are set to 1.
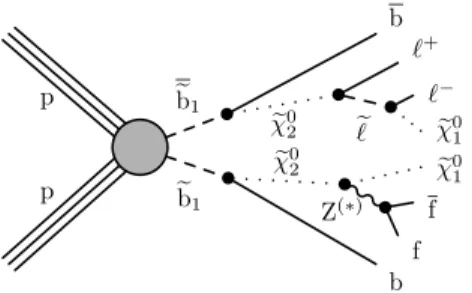
The signal model for the edge search, referred to as the slepton edge model, assumes the production of a pair of bottom squarks (eb), the superpartner of the bottom quark, where each decays to χe02 and a bottom quark. Two decay modes of the χe02 are considered, each with a 50% branching fraction; they are both illustrated in figure2. In the first mode, the χe02 decays to a Z boson and χe01, which is stable. The Z boson can be on- or off-shell, depending on the mass difference between the neutralinos. The second decay mode features sequential two-body decays with an intermediate slepton `e(ee,µ):e χe02 → e``→ ``χe01. The masses of the sleptons are assumed to be degenerate and equal to the average of theχe02 and e
χ01 masses. The masses of theeb andχe02 are free parameters, while the mass ofχe01 is fixed at 100 GeV. This scheme allows the position of the signal edge to vary in the invariant mass distribution depending on the mass difference between theχe02 andχe01. The mass of the χe01 is chosen in such a way that theχe02 mass is always greater by at least 50 GeV, setting the minimum possible edge position at 50 GeV.
JHEP03(2018)076
p
p eg
e g
e χ01 e χ01
qq Z
Ge Ge Z q q
p
p χe02
e χ±1
W± e χ01 e χ01 Z
p
p χe01
e χ01
Z Ge Ge Z
p
p χe01
e χ01
Z Ge Ge H
Figure 1. Diagrams for models with decays containing at least one dilepton pair stemming from an on-shell Z boson decay studied in this analysis. The model targeted by the strong-production search is shown in the upper left. The three other diagrams correspond to EW production of chargino- neutralino or neutralino-neutralino pairs. All the diagrams containing a gravitino (G) represente gauge-mediated SUSY breaking (GMSB) models.
p p
eb1
eb1
e χ02 e χ02
Z(∗) eℓ
b f
f e χ01 e χ01 ℓ− ℓ+ b
Figure 2. Diagram showing a possible decay chain in the slepton edge model. Bottom squarks are pair produced with subsequent decays that frequently contain dilepton pairs. This model features a characteristic edge in them`` spectrum given approximately by the mass difference between the e
χ02 andχe01 particles.
3 The CMS detector
The central feature of the CMS apparatus is a superconducting solenoid, 13 m in length and 6 m in diameter, that provides an axial magnetic field of 3.8 T. Within the solenoid volume are various particle detection systems. Charged-particle trajectories are measured by silicon pixel and strip trackers, covering 0 < φ < 2π in azimuth and |η|< 2.5, where the pseudorapidity η is defined as −log[tan(θ/2)], with θ being the polar angle of the trajectory of the particle with respect to the counterclockwise beam direction. A crys-
JHEP03(2018)076
tal electromagnetic calorimeter (ECAL) and a brass and scintillator hadron calorimeter (HCAL) surround the tracking volume. The calorimeters provide energy and direction measurements of electrons and hadronic jets. Muons are detected in gas-ionization detec- tors embedded in the steel flux-return yoke outside the solenoid. The detector is nearly hermetic, allowing for momentum balance measurements in the plane transverse to the beam direction. A two-tier trigger system selects events of interest for physics analysis. A more detailed description of the CMS detector, together with a definition of the coordinate system used and the relevant kinematic variables, can be found in ref. [31].
4 Data sets, triggers, and object selection
This analysis uses data samples of e±e∓and µ±µ∓ events for the signal region (SR) selec- tions and e±µ∓events for control regions (CRs). Events are collected with a set of dilepton (ee, µµ, or eµ) triggers that require the magnitude of the transverse momentum pT >17 or 23 GeV for the highest pT lepton, depending on the data taking period, except for the dimuon trigger where the requirement is always pT >17 GeV. These triggers impose loose isolation criteria on the leptons. For the next-to-highest pT electron (muon), pT > 12 (8) GeV is required, and electrons (muons) must satisfy |η|<2.5 (2.4). In order to retain high signal efficiency, in particular for highly boosted dilepton systems, dilepton triggers without an isolation requirement are also used. These require pT >33 GeV for both lep- tons in the dielectron case and pT > 30 GeV for both leptons in the electron-muon case.
In the dimuon case, they require either pT > 27 (8) or pT > 30 (11) GeV for the highest (next-to-highest)pTmuon depending on the data taking period. The trigger efficiencies are measured in data using events selected by a suite of jet triggers and are found to be 90–96%.
The particle-flow (PF) event algorithm [32] reconstructs and identifies particle candi- dates in the event, referred to as PF objects. To select collision events we require at least one reconstructed vertex. The reconstructed vertex with the largest value of summed physics- objectp2Tis taken to be the primary pp interaction vertex. The physics objects used for the primary vertex selection are the objects returned by a jet finding algorithm [33,34] applied to all charged tracks associated with the vertex, plus the corresponding associated missing transverse momentum. The missing transverse momentum vector ~pTmiss is defined as the projection onto the plane perpendicular to the beam axis of the negative vector sum of the momenta of all reconstructed PF objects in an event. Its magnitude is referred to aspmissT . Electrons, reconstructed by associating tracks with ECAL clusters, are identified using a multivariate approach based on information on the cluster shape in the ECAL, track reconstruction quality, and the matching between the track and the ECAL cluster [35].
Electrons from reconstructed photon conversions are rejected. Muons are reconstructed from tracks found in the muon system associated with tracks found in the tracker. They are identified based on the quality of the track fit and the number of associated hits in the tracking detectors. For both lepton flavors, the impact parameter with respect to the primary vertex is required to be within 0.5 mm in the transverse plane and less than 1 mm along the beam direction. The lepton isolation variable is defined as the scalar pT sum of all PF objects in a cone around the lepton (excluding those identified as electrons or
JHEP03(2018)076
muons). To mitigate the impact of additional pp interactions in the same or nearby bunch crossings (pileup), only charged PF objects compatible with the primary vertex are included in the sum, and the average expected pileup contribution is subtracted from the neutral component of the isolation. The isolation sum is required to be smaller than 10 (20)% of the leptonpTfor electrons (muons). The cone size varies with leptonpTand is chosen to be p(∆φ)2+ (∆η)2 = ∆R= 0.2 for pT <50 GeV, ∆R= 10 GeV/pT for 50< pT<200 GeV, and ∆R = 0.05 for pT >200 GeV. This shrinking cone size with increasing pT preserves high efficiency for leptons from Lorentz-boosted boson decays [36]. To identify events with three or more charged leptons, additional leptons beyond the first two are selected with the looser requirement for the isolation sum to be less than 40% of the lepton pT.
Photons are required to pass identification criteria based on the cluster shape in the ECAL and the fraction of energy deposited in the HCAL [37]. Photons must satisfy pT >25 GeV, and be within|η|<2.4, excluding the “transition region” of 1.4<|η|<1.6 between the ECAL barrel and endcap. Photons are required to be isolated from other PF objects within a cone of ∆R = 0.3. To ensure the photon is well measured, it is required that ∆φ(~pTmiss, ~pγT)>0.4. To distinguish photons from electrons, the photon is rejected if it can be connected to a pattern of hits in the pixel detector that indicate the presence of a charged particle track.
Isolated, charged-particle tracks identified by the PF algorithm are selected with looser requirements on a similar set of criteria to the leptons defined above and are used as a veto on the presence of additional charged leptons. When selecting charged PF objects, a track-based relative isolation is used. The relative track isolation is calculated using all charged PF objects within a cone ∆R = 0.3 and longitudinal impact parameter |∆z| <
0.1 cm relative to the primary vertex. Particle-flow objects identified as electrons or muons (charged hadrons) are required to have pT > 5 (10) GeV and an isolation value less than 20 (10)% of the object pT.
Jets are clustered from PF objects, excluding charged hadrons not associated with the primary vertex, using the anti-kT clustering algorithm [33] with a distance parameter of 0.4, implemented in the FastJet package [34,38]. Jets are required to satisfy |η|< 2.4 andpT >35 GeV, where thepT is corrected for nonuniform detector response and multiple collision (pileup) effects [39,40]. A jet is removed from the event if it lies within ∆R <0.4 of any of the selected leptons or the highest pT photon. The scalar sum of all jet pT is referred to asHT. Corrections to the jet energy are propagated topmissT using the procedure developed in ref. [39]. Identification of jets originating from b quarks is performed with the combined secondary vertex (CSVv2) algorithm [41], using the medium working point, for which the typical efficiency for b quarks is around 60–75% and the mistagging rate for light-flavor jets is around 1.5%. Jets with a lower threshold ofpT >25 GeV are considered, and selected jets are denoted as b-tagged jets.
Events are selected by requiring two OCSF leptons (e±e∓ or µ±µ∓) with pT > 25 (20) GeV for the highest (next-to-highest) pT lepton and |η|<2.4 for both leptons. The distance between the leptons must satisfy ∆R >0.1 to avoid reconstruction efficiency dif- ferences between electrons and muons in events with collinear leptons. To ensure symmetry in acceptance between electrons and muons, all leptons in the transition region between the
JHEP03(2018)076
barrel and endcap of the ECAL, 1.4<|η|<1.6, are rejected. A control sample of lepton pairs with opposite charge and different flavor (OCDF), e±µ∓, is defined using the same lepton selection criteria. All the parameters above have been chosen in order to maximize the lepton selection efficiency while keeping the efficiencies similar for electrons and muons.
Photon events are used to predict one of the main backgrounds of this analysis, and a data control sample is selected as described below in section6.2. To be consistent with the pho- tonpT threshold applied in this control sample, we require the pT of the dilepton system to be greater than 25 GeV.
While the main SM backgrounds are estimated using data control samples, simulated events are used to estimate systematic uncertainties and some SM background components as described below. Next-to-leading order (NLO) and next-to-NLO cross sections [42–47]
are used to normalize the simulated background samples, while NLO plus next-to-leading- logarithmic (NLL) calculations [48–50] are used for the signal samples. Simulated samples of Drell-Yan (DY) processes and photons produced in association with jets are generated with the MadGraph5 [email protected] event generator [42] to leading order (LO) preci- sion, with up to four additional partons in the matrix element calculations, using the MLM matching scheme [51]. Simulated ttV (V = W,Z) and VVV events are produced with the same generator to NLO precision. Other SM processes, such as VV, tt, and single top quark production, are simulated using powheg 2.0 [52]. The matrix element calculations performed with these generators are interfaced with pythia 8.212 [53] for the simulation of parton showering and hadronization. The NNPDF3.0 parton distribution functions (PDF) [54] are used for all samples. The detector response is simulated with a Geant4 model [55] of the CMS detector. The simulation of new-physics signals is performed using theMadGraph5 amc@nloprogram at LO precision, with up to two additional partons in the matrix element calculation. Events are then interfaced withpythia8.212 for fragmen- tation and hadronization, and further processed using the CMS fast simulation package [56].
Multiple pp interactions are superimposed on the hard collision, and the simulated samples are reweighted such that the number of collisions per bunch crossing accurately reflects the distribution observed in data. Corrections are applied to the simulated samples to account for differences between simulation and data in the trigger and reconstruction efficiencies.
5 Signal regions
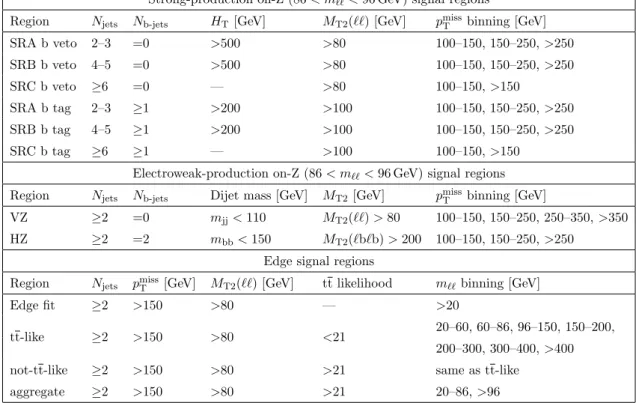
The selections for all SRs, described below, are summarized in table 1.
The on-Z search regions are designed to achieve low backgrounds from SM processes, while maintaining sensitivity to a variety of new-physics models, not only the processes described in section 2. The dilepton invariant mass is required to be in the range 86 <
m`` < 96 GeV, which is compatible with the Z boson mass. The events must contain at least two jets and satisfy pmissT > 100 GeV. The two highest pT jets in the event are required to have a separation inφfrom~pTmissof at least 0.4 to reduce backgrounds where the pmissT in the event comes from jet mismeasurements. Events containing additional electrons (muons) with pT >10 GeV, |η| <2.5(2.4), and passing the looser isolation criteria from section 4, are rejected, as are events containing an isolated, charged PF candidate passing
JHEP03(2018)076
the selections described in that section. Multiple on-Z SRs are defined using these selection criteria as a baseline: the first set for the strong production search and two additional regions for EW production searches.
For the on-Z strong-production SRs, we make selections requiring a large level of hadronic activity in the event, which we expect in the decays of strongly coupled new particles. We define three SR categories: “SRA” (2–3 jets), “SRB” (4–5 jets), and “SRC”
(≥6 jets). These categories are further divided as having either zero or at least one b- tagged jet. The kinematic variable MT2[57,58] is used to reduce the background from tt events. This variable was first introduced to measure the mass of pair-produced particles, each decaying to the same final state, consisting of a visible and an invisible particle. It is defined using~pTmiss and two visible objects (leptons, jets, or combinations thereof) as:
MT2= min
~
pTmiss(1)+~pTmiss(2)=~pTmiss
hmax
MT(1), MT(2)i
, (5.1)
where ~pTmiss(i) (i= 1, 2) are trial vectors obtained by decomposing ~pTmiss. The transverse masses MT(i) =p
2pvisT pmissT (i)[1−cos(∆φ)], where ∆φ is the angle between the transverse momentum of the visible object and p~Tmiss(i), are obtained by pairing either of these trial vectors with one of the two visible objects. The minimization is performed over all trial mo- menta satisfying thep~Tmissconstraint. When buildingMT2from the two selected leptons and
~
pTmiss, denotedMT2(``), its distribution exhibits a sharp decline around the mass of the W boson for tt events and is therefore well suited to suppress this background. A requirement ofMT2(``)>80 GeV (100 GeV for events with at least one b-tagged jet) is imposed in order to suppress tt backgrounds. Requirements are then placed onHTdepending on the number of jets and on the presence or absence of a b-tagged jet in the event, indicated by the labels
“b tag” and “b veto,” respectively. Finally, each SR is divided into multiple bins inpmissT , de- pending on the number of selected jets. The precise requirements are summarized in table1.
The first EW on-Z search region is denoted the “VZ” region and is designed to be sen- sitive to signatures where a hadronically decaying W or Z boson is produced in conjunction with the leptonically decaying Z boson. In order to reduce the tt background, events with a b-tagged jet are removed, and we require MT2(``) >80 GeV. The two jets in the event that are closest inφ are then required to have a dijet invariant massmjj <110 GeV to be consistent with the hadronic decay of a W or Z boson. The SR is then divided into four bins in pmissT : 100–150, 150–250, 250–350, and>350 GeV.
The second EW-production search region is denoted the “HZ” region and is designed to be sensitive to signatures where a Higgs boson is produced in conjunction with the leptonically decaying Z boson. We target Higgs bosons decaying to bb, due to its dom- inant branching ratio, and we therefore require events to have exactly two b-tagged jets with an invariant mass, mbb, less than 150 GeV. In order to reduce the tt background, a MT2 variable is calculated using two combinations of one lepton and one b-tagged jet as the visible objects. Each lepton is paired with a b-tagged jet, and all combinations of MT2 are calculated. The smallest value of MT2 is used, denoted MT2(`b`b). The distri- bution of MT2(`b`b) has an endpoint at the top quark mass for tt events, and we require MT2(`b`b)>200 GeV. The SR is then divided into three bins inpmissT : 100–150, 150–250,
JHEP03(2018)076
and > 250 GeV. Although the selections for the EW VZ and HZ regions are mutually exclusive, they are not necessarily exclusive with respect to the strong-production SR se- lections. For interpretations of the analysis results, either the strong-production or the EW regions are considered depending on the signal model.
The baseline SR in the edge search requires m`` >20 GeV, at least two jets, pmissT >
150 GeV,MT2(``)>80 GeV, and the two jets with the highestpT to have a separation inφ from~pTmiss of at least 0.4. A fit is performed in this baseline region to search for a kinematic edge in the m`` spectrum. A counting experiment is also performed in seven bins of m``, excluding the range used for the on-Z search. These are summarized in table 1.
A likelihood discriminant is used to distinguish between events originating from dilep- tonically decaying top quark pairs and other sources. The observables used for the likeli- hood discriminator are pmissT , the pT of the dilepton system, |∆(φ)| between the leptons, and an observable called Σm`b. The latter is the sum of the invariant masses of the two lepton and b-tagged jet systems, and should have an endpoint at 2p
M(t)2−M(W)2 for events resulting from top quark pairs. To calculate Σm`b, all pairings of a lepton with a jet are considered, and the pairing with the minimum invariant mass is selected. This process is repeated for the remaining lepton and jets, and the sum of the invariant masses of the two lepton-jet pairs is defined as Σm`b. If b-tagged jets are present, they are given priority in the calculation of both lepton-jet systems; i.e., if one or more b-tagged jets are present, Σm`b between the leptons and the b-tagged jet(s) is minimized first, and then the remaining (b-tagged) jets are considered for the minimization of the sum Σm`b of the second lepton. To calculate the likelihood discriminant, the probability density functions of the four observables are determined by fits in the different-flavor (DF) control sample using the same kinematic requirements as the same-flavor (SF) SR except removing the MT2(``) selection. The respective fit functions are a sum of two exponential functions for pmissT , a second-order polynomial for |∆(φ)|, and a Crystal Ball (CB) function [59] for both the dilepton pT and Σm`b distributions. A likelihood function is constructed, and its negative logarithm is taken as the discriminator value. Two categories of events are defined: “tt-like,” with a discriminator value less than 21 and an efficiency of 95% for tt events, and “not-tt-like,” which is composed of the remainder of the events.
In addition, two aggregate SRs are defined for the edge search, integrating the mass bins below and above the Z boson mass for the not-tt-like category.
6 Standard model background predictions
The backgrounds from SM processes are divided into three categories. Those that produce DF pairs (e±µ∓) as often as SF pairs (µ±µ∓, e±e∓) are referred to as flavor-symmetric (FS) backgrounds. Among them, the dominant contribution arises from top quark pair produc- tion; subleading contributions are also present from W+W−, Z/γ∗(→ τ τ), tW single-top quark production, and leptons from hadron decays. Data samples of DF events are used to predict the SF background.
The remaining background categories contain flavor-correlated sources of lepton pro- duction that only contribute events with OCSF leptons. The dominant contributions at
JHEP03(2018)076
Strong-production on-Z (86< m``<96 GeV) signal regions
Region Njets Nb-jets HT[GeV] MT2(``) [GeV] pmissT binning [GeV]
SRA b veto 2–3 =0 >500 >80 100–150, 150–250,>250
SRB b veto 4–5 =0 >500 >80 100–150, 150–250,>250
SRC b veto ≥6 =0 — >80 100–150,>150
SRA b tag 2–3 ≥1 >200 >100 100–150, 150–250,>250
SRB b tag 4–5 ≥1 >200 >100 100–150, 150–250,>250
SRC b tag ≥6 ≥1 — >100 100–150,>150
Electroweak-production on-Z (86< m``<96 GeV) signal regions Region Njets Nb-jets Dijet mass [GeV] MT2[GeV] pmissT binning [GeV]
VZ ≥2 =0 mjj<110 MT2(``)>80 100–150, 150–250, 250–350,>350 HZ ≥2 =2 mbb<150 MT2(`b`b)>200 100–150, 150–250,>250
Edge signal regions
Region Njets pmissT [GeV] MT2(``) [GeV] tt likelihood m`` binning [GeV]
Edge fit ≥2 >150 >80 — >20
tt-like ≥2 >150 >80 <21 20–60, 60–86, 96–150, 150–200, 200–300, 300–400,>400
not-tt-like ≥2 >150 >80 >21 same as tt-like
aggregate ≥2 >150 >80 >21 20–86,>96
Table 1. Summary of all SR selections.
lower pmissT are from DY production in association with jets, where pmissT arises from mis- measurement of the jet energies. Data samples of photon events are used to predict this DY+jets background.
The final category comes from events with prompt neutrinos in addition to an OCSF pair from a Z/γ∗ boson. This includes WZ and ZZ production and processes with lower cross section such as ttZ among others. These backgrounds are referred to as “Z+ν” and can be important in the high-pmissT signal bins.
6.1 Flavor-symmetric backgrounds
The method of estimating the FS backgrounds relies on the fact that, for such processes, SF and DF events are produced at the same rate. This allows for prediction of the background yields in the SF sample from those in the DF sample by application of an appropriate correction factor, which is estimated from CRs in data. This factor corrects for differ- ent flavor-dependent reconstruction and identification efficiencies and for flavor-dependent trigger efficiencies, which can be different for electrons and muons.
For cases where the DF contribution is of sufficient statistical power to make an accu- rate prediction in the SF channel, a background estimate in the SF channel can therefore be obtained by applying a multiplicative correction factor, RSF/DF, to the DF channel yield. The correction is determined in two independent ways, both based purely on con- trol samples in the data. The two results are then combined using the weighted average according to their uncertainties to obtain the final factor. The first approach uses a direct
JHEP03(2018)076
measurement of this correction factor in a data CR independent of the baseline SR, and the second method involves a factorized approach of measuring the effects of reconstruction, identification, and trigger efficiencies separately and then combining them assuming the overall efficiency equal to the product of the individual components.
The direct measurement is performed in a CR requiring exactly two jets and 100 <
pmissT < 150 GeV, excluding the dilepton invariant mass range 70 < m`` < 110 GeV to reduce contributions from DY+jets backgrounds. Here, RSF/DF is computed using the observed yield of SF and DF events, RSF/DF = NSF/NDF. Data and simulation agree within 2% in this region. In simulation we find thatRSF/DF differs by 1% when computed in the SR instead of the CR. We check the dependence of RSF/DF on the main kinematic variables used for the analysis in both data and simulation. Since the statistical power in data is limited, a systematic uncertainty of 4% is assigned based on the variations observed in simulation. The measured value of RSF/DF is 1.107±0.046.
For the factorized approach, the ratio of muon to electron reconstruction and identifi- cation efficiencies, rµ/e, is measured in a DY+jets-enriched CR requiring at least two jets, pmissT <50 GeV, and 60< m`` <120 GeV. This results in a large sample of e±e∓andµ±µ∓ events with similar kinematic distributions to those of the SR. Assuming the factorization of lepton efficiencies in an event, the efficiency ratio is measured asrµ/e=√
Nµ+µ−/Ne+e−. This ratio depends on the leptonpTdue to trigger and reconstruction efficiency differences, especially at low leptonpT. A parameterization as a function of thepT of the less energetic lepton is used, and the functional form below is found to empirically describe the data:
rµ/e=C+ α pT.
Here C and α are constants that are determined from a fit to data and checked using simulation. These fit parameters are determined to be C = 1.140±0.005 andα = 5.20± 0.16 GeV. In addition to the fit uncertainty, a 10% systematic uncertainty is assigned to account for remaining variations observed when studying the dependence ofrµ/eon thepT of the more energetic lepton,pmissT , and the jet multiplicity.
The trigger efficiencies for the three flavor combinations are used to define the factor RT = q
Tµ±µ∓Te±e∓/Te±µ∓, which takes into account the difference between SF and DF channels. The efficiencies are estimated from a control sample of events collected with a set of nonoverlapping triggers and range between 90–96%, yielding a final value of RT = 1.052±0.043.
The final correction is RSF/DF = (1/2)(rµ/e+r−1µ/e)RT. The correction relies on the assumption that the number of produced DF events is twice the number of produced events in each SF sample. Thus, the number of observed DF events needs to be multiplied by 0.5rµ/eRT and 0.5r−1µ/eRT to predict the number of dimuon and dielectron from FS processes, respectively. Summing rµ/e with its inverse leads to a large reduction in the associated uncertainty. Sincerµ/edepends on the lepton kinematic variables, this correction is performed on an event-by-event basis. A separate correction is determined for each SR and combined with the correction from the direct measurement using the weighted average.
In the method described above, the statistical uncertainty in the predicted number of events is driven by the statistical uncertainty in the number of data events in the DF
JHEP03(2018)076
CR. Since RSF/DF is approximately one, the CR yield will be comparable to that of the FS background in the corresponding SR. In the on-Z SRs, the FS background is signifi- cantly reduced by the requirement that m`` lies within 5 GeV of the Z boson mass. The expected FS background yields in the SRs are often of the order of a few events or less. We therefore modify the prediction method to obtain greater statistical power by relaxing the requirement onm`` for DF events, thereby increasing the number of events in the DF CR.
An additional multiplicative factor, κ, is calculated and multiplied together with RSF/DF in order to translate this into a prediction for the SF SR. The factor κ is defined as the number of DF events with |mZ−m``|<5 GeV divided by the number of DF events with m`` > 20 GeV. It is determined from an DF control sample in simulation and validated in the DF data CRs. A value of κ = 0.065 is measured from simulation. A systematic uncertainty of 30% is assigned by computingκin simulation for both the various on-Z SRs and bins ofpmissT . The largest observed difference from the nominal κvalue is taken as the systematic uncertainty. The value of κ derived in data agrees with the result derived from simulation within the assigned uncertainty, and the statistical uncertainty in the derivation of κ is negligible in comparison with the systematic uncertainty.
6.2 Drell-Yan+jets backgrounds
The pmissT from the DY+jets background is estimated from a sample of photon events in data using thepmissT “templates” method [13–16]. The main premise of this method is that pmissT in DY+jets events originates from the limited detector resolution when measuring the objects making up the hadronic system that recoils against the Z boson. The shape of the pmissT distribution can be estimated from a control sample of γ+jets events where the jet system recoils against a photon instead of a Z boson. In addition to capturing the same resolution effects present in DY+jets events, theγ+jets sample contains more events because of the branching fraction of Z → `+`−, and it does not have any contamination from signal events in the models considered. For SRs requiring at least one b-tagged jet, some of the observedpmissT can originate from neutrinos in semileptonic b-quark decays. To account for this effect, the pmissT templates are extracted from a control sample of γ+jets events with the same b-tagging requirements as in each SR.
The γ+jets events in data are selected with a suite of single-photon triggers with pT
thresholds varying from 22 to 165 GeV. The triggers with thresholds below 165 GeV are prescaled such that only a fraction of accepted events are recorded, and the events are weighted by the trigger prescales to match the integrated luminosity collected with the signal dilepton triggers. In order to account for kinematic differences between the hadronic systems in the γ+jets and the DY+jets samples, the γ+jets sample is reweighted such that the photon pT distribution matches the Z pT distribution in the DY+jets sample. A separate photon CR is defined for each of the on-Z SRs in table1, where the same kinematic requirements are applied to the γ+jets samples as in each SR. The reweighting in boson pT is performed for each SR. Contributions to the photon sample from other SM processes with genuinepmissT from prompt neutrinos are subtracted as described below. The resulting pmissT distribution in each SR is then normalized to the observed dilepton data yield in the
JHEP03(2018)076
range 50< pmissT <100 GeV, where DY+jets is the dominant background, after subtracting other background components.
The variableMT2used in the SR requires two visible objects as input and thus cannot be calculated in the same way in the photon sample. Instead, we emulate this requirement in γ+jets by simulating the decay of the photon to two leptons. The decay is performed assuming the mother particle has the mass of a Z boson and the momentum of the pho- ton reconstructed from data. We first consider a system of reference in which the mother particle is at rest. The decay to the leptons is performed in this system accounting for the angular dependence of spin correlations in the matrix element. Then a Lorentz transforma- tion is applied to the emulated dilepton system in order to match the original momentum of the photon. The analysis requirements onpTandηfor leptons are applied to the simulated decay products. The variable MT2(``) is constructed using these leptons, showing good agreement with the distribution of MT2(``) in genuine DY+jets events, and a selection is applied to this variable matching each SR requirement.
After selecting events with a high-pTphoton and largepmissT , events from EW processes with genuine pmissT , e.g. Wγ where the W boson decays to `ν, can be present in the tail of the pmissT distribution. To reduce the contamination from these EW processes, events in the photon sample are removed if they contain a lepton fulfilling the veto selections for the on-Z regions described in section 5. We then subtract the residual EW contamination using simulation. The relative size of the subtraction grows with increasing pmissT to be as large as around 50% of the prediction or 1 predicted event in the highest pmissT bins.
To validate the modeling of the subtracted EW processes, we define a data CR by selecting events with exactly one muon and one photon, requiring pmissT >50 GeV and the transverse mass MT of the muon and pmissT to be greater than 30 GeV. The muon must satisfypT>25 GeV, and the events are selected using a trigger that requires at least one isolated muon with pT > 24 GeV. This region consists of about 50% Wγ events with the remainder coming primarily from ttγ events. Agreement is observed between data and the prediction from simulation. Based on the level of agreement between data and simulation in the kinematic distributions of photon pT and pmissT , we assign a systematic uncertainty of 30% in the subtraction of these EW processes.
The systematic uncertainty in the prediction takes into account the statistical uncer- tainty in theγ+jets sample in each bin of pmissT , which is the dominant uncertainty in the highest pmissT bins. The statistical uncertainty in the normalization region of 50< pmissT <
100 GeV is included and ranges from 7–30%. A closure test of the method is performed in simulation, using γ+jets to predict the yield of DY+jets in each analysis bin. An uncer- tainty is assigned from the results of this test as the larger of the difference between the γ+jets prediction and the DY+jets yield for each pmissT region or the simulation statistical uncertainty. The values vary between 10 and 80% depending on the pmissT region, with the larger values coming from regions with low statistics in simulation.
The template method is also used to provide a prediction for the background from DY+jets in the edge SRs, where this background is significantly smaller due to the m``
requirements. We define the ratio rout/in in a DY+jets-dominated sample as the number of SF events in a given bin of m`` divided by the SF yield within 86< m`` <96 GeV. The
JHEP03(2018)076
ratio is measured in a DY+jets-dominated CR requiring at least two jets, pmissT <50 GeV, andMT2(``)>80 GeV. Different-flavor yields in both the numerator and denominator are subtracted from the respective SF yields in order to correct for small FS contributions in the region where rout/in is measured. The value ofrout/in ranges from 0.001 to 0.16 for the different bins in m``. The DY+jets background contribution to each m`` bin is computed by multiplying the on-Z prediction by rout/in. The dependence of rout/in on pmissT and the jet multiplicity are studied in the data CR. Based on the statistical precision of this check, and the observed variations as a function of these variables, we assign an uncertainty of 50 (100)% torout/in in the m`` bins below (above) 150 GeV.
6.3 Backgrounds with Z bosons plus genuine pmissT
ThepmissT template method only predicts instrumentalpmissT from jet mismeasurement and thus does not include the genuine pmissT from prompt neutrinos expected in processes like W(`ν)Z(``), Z(``)Z(νν), or lower cross section processes such as ttZ. These processes can be a substantial fraction of the background at highpmissT and are estimated using simulation.
The prediction from simulation is validated by comparing to data in CRs requiring three or four leptons. A region enriched in WZ events is selected by requiring exactly three leptons, at least two jets, no b-tagged jets, pmissT >60 GeV, and an OCSF lepton pair with 86< m``<96 GeV. Another three-lepton CR is defined targeting ttZ by requiring at least two jets, at least two b-tagged jets,pmissT >30 GeV, and an OCSF lepton pair as in the WZ region. A four-lepton CR targeting ZZ is constructed by requiring four leptons with two OCSF pairs satisfyingm``>20 GeV, to remove low-mass resonances, and at least two jets.
After subtracting the other processes using simulation in each region, simulation-to- data scale factors of 0.98±0.11, 1.58±0.49, and 1.31±0.29 are observed for WZ, ZZ, and ttZ backgrounds respectively. We use the scale factor values to correct the prediction from simulation for each process. Based on the statistical uncertainty in these CRs, and the agreement between data and simulation in distributions of kinematic variables such as pmissT and the number of jets, we assign systematic uncertainties of 30% for the WZ and ttZ background predictions and 50% for the ZZ prediction. As all other effects are subdominant, we do not assign further uncertainties to these backgrounds.
7 Kinematic fit
A simultaneous extended unbinned maximum likelihood fit is performed in the m`` dis- tributions of e+e−, µ+µ−, and e±µ∓ events to search for a kinematic edge. The fit is performed after the kinematic selection labeled “Edge fit” in table1. The likelihood model contains three components: an FS background component, a DY+jets background com- ponent, and a signal component. The Z+ν background is contained within the DY+jets component in this method, as both have the samem`` shape.
The FS background component is described using a CB function PCB(m``):
PCB(m``) =
exph
−(m``2Γ−µ2CB)2 CB
i
if m``Γ−µCB
CB < α A(B+m``Γ−µCB
CB )−n if m``Γ−µCB
CB > α (7.1)
JHEP03(2018)076
where
A= n
|α|
n
exp
−|α|2 2
and B = n
|α|− |α|. (7.2) The FS background model has five free parameters: the overall normalization, the mean µCBand width ΓCBof the Gaussian part, the transition pointαbetween the Gaussian part and the power law tail, and the power law parameter n.
The DY+jets background component is modeled with the sum of an exponential func- tion, which describes the low-mass rise, and a Breit-Wigner function with a mean and width set to the nominal Z boson values [60], which accounts for the Z boson lineshape.
To account for the experimental resolution, the Breit-Wigner function is convolved with a double-sided CB function
PDSCB(m``) =
A1(B1−m``Γ−µDSCB
DSCB )−n1 if m``Γ−µDSCB
DSCB <−α1 exph
−(m``−µDSCB)2
2Γ2DSCB
i if −α1 < m``Γ−µDSCB
DSCB < α2 A2(B2+m``Γ−µDSCB
DSCB )−n2 if m``Γ−µDSCB
DSCB > α2
(7.3)
where µDSCB and ΓDSCB are the mean and width, respectively, of the CB function, and α1 andα2 are the transition points. The full model for the on-Z DY+jets background line shape is thus
PDY,on-Z(m``) = Z
PDSCB(m``)PBW(m``−m0)dm0, (7.4) where PBW is the Breit-Wigner function. The complete DY+jets background model has nine free parameters.
The signal component is described by a triangular shape, convolved with a Gaussian distribution to account for the experimental resolution:
PS(m``)∝ 1
√2πΓ``
Z medge``
0
yexp
−(m``−y)2 2Γ2``
dy. (7.5)
The signal model has two free parameters: the fitted signal yield and the position of the edge, medge`` .
As the first step, a fit is performed separately for e+e−andµ+µ−events in a DY+jets- enriched CR requiring at least two jets and pmissT < 50 GeV, to determine the shape of backgrounds containing a Z boson. The parameters of the DY+jets background shape are then fixed and only the normalizations of these backgrounds are free parameters in the subsequent fit. The final fit is performed simultaneously to the dilepton invariant mass distributions in the e+e−,µ+µ−, and e±µ∓ samples. The model for the FS background is the same for the SF and DF events. TheRSF/DFfactor is treated as a nuisance parameter, parameterized by a Gaussian distribution with a mean value and standard deviation given by the value of RSF/DF and its uncertainties (see section 6.1). The final fit has ten free parameters: a normalization for each of the three fit components, four parameters for the shape of the FS background,RSF/DF, the relative fraction of dielectron and dimuon events in the FS prediction, and the position of the signal edge.
JHEP03(2018)076
8 Results
The observed number of events in the SRs are compared with the background estimates for the on-Z strong- and EW-production and the edge searches. The covariance and correlation matrices of the background predictions in the different SRs are also provided in appendixA to facilitate reinterpretation of these results. For the edge search, the fit is performed to search for a kinematic edge in the m`` spectrum.
8.1 Results of the search in the on-Z signal regions
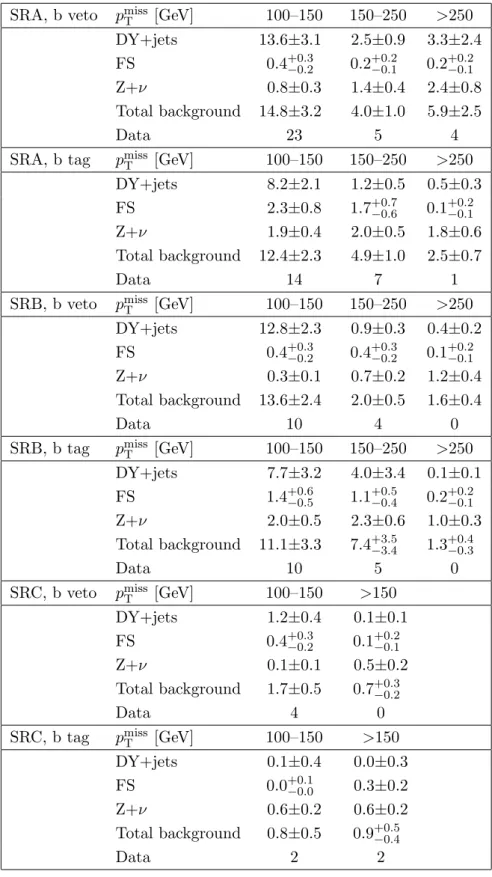
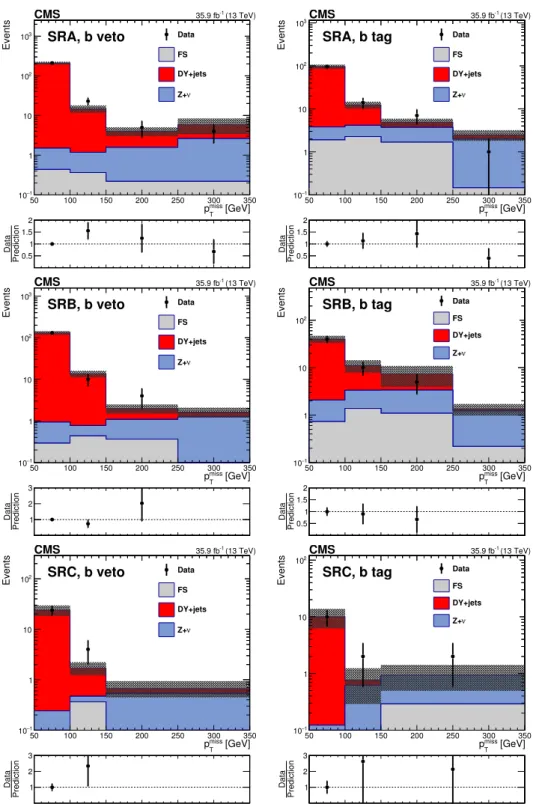
The results for the SRs of the on-Z strong-production search are presented in table 2.
The corresponding pmissT distributions are shown in figure 3. No significant deviations are observed with respect to SM expectations.
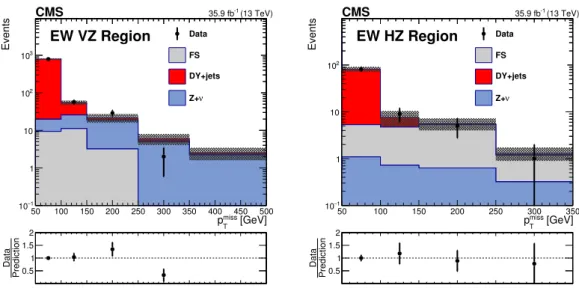
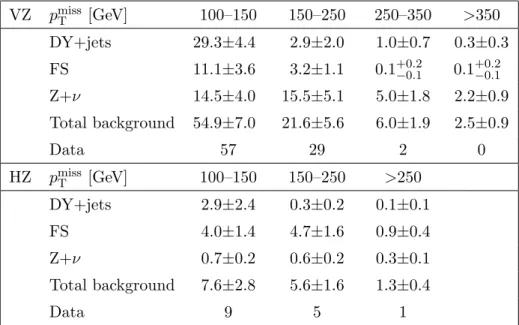
The results for the EW SRs in the on-Z search are shown in table3. The corresponding pmissT distributions are shown in figure 4. The observed data are also consistent with the background prediction.
8.2 Results of the edge search
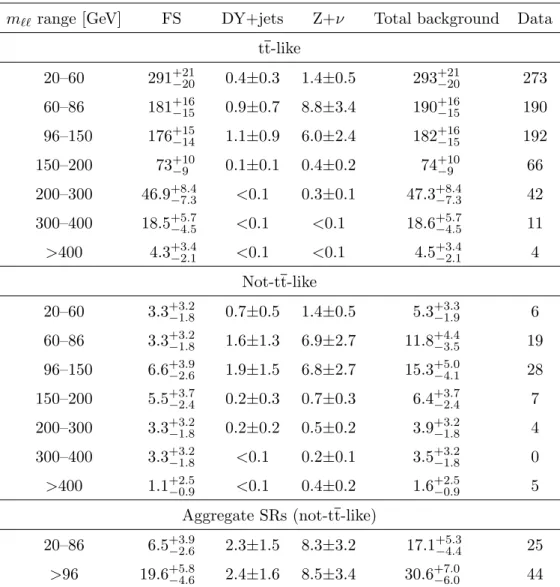
The edge search features seven distinct m`` regions, each of which is divided into two bins using the likelihood discriminant, resulting in fourteen SRs. In addition, two aggregate regions integrating the SRs below and above the Z boson mass have been considered in the not-tt-like case. Table4 summarizes the SM predictions and the observations in these SRs. A graphical representation of these results is shown in figure5, including the relative contributions of the different backgrounds.
At high mass and in the not-tt-like regions, the uncertainty in the background pre- diction is driven by the statistical uncertainty in the number of events in the DF control sample. There is good agreement between prediction and observation for all SRs. The largest deviation is observed in the not-tt-like region for masses between 96 and 150 GeV, with an excess corresponding to a local significance of 2.0 standard deviations.
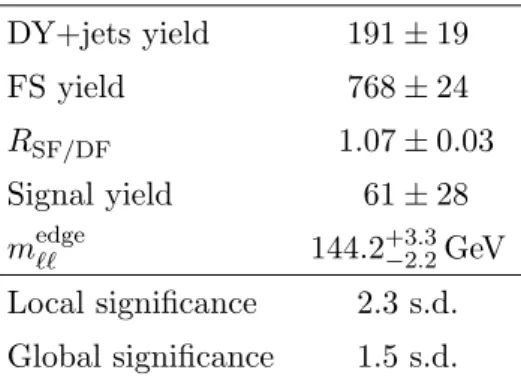
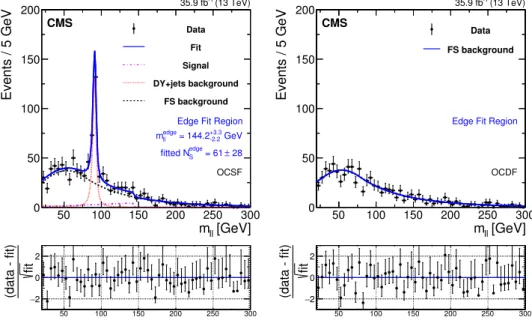
The dilepton mass distributions and the results of the kinematic fit are shown in fig- ure 6. Table 5 presents a summary of the fit results. A signal yield of 61 ±28 events is obtained when evaluating the signal hypothesis in the baseline SR, with a fitted edge position of 144.2+3.3−2.2GeV. This is in agreement with the upwards fluctuations in the mass region between 96 and 150 GeV in the counting experiment and corresponds to a local significance of 2.3 standard deviations. To estimate the global p-value [61] of the re- sult, the test statistic −2 lnQ, where Q denotes the ratio of the fitted likelihood value for the signal-plus-background hypothesis to the background-only hypothesis, is evaluated on data and compared to the respective quantity on a large sample of background-only pseudo-experiments where the edge position can have any value. The resulting p-value is interpreted as the one-sided tail probability of a Gaussian distribution and corresponds to an excess in the observed number of events compared to the SM background prediction with a global significance of 1.5 standard deviations.
JHEP03(2018)076
SRA, b veto pmissT [GeV] 100–150 150–250 >250 DY+jets 13.6±3.1 2.5±0.9 3.3±2.4 FS 0.4+0.3−0.2 0.2+0.2−0.1 0.2+0.2−0.1
Z+ν 0.8±0.3 1.4±0.4 2.4±0.8
Total background 14.8±3.2 4.0±1.0 5.9±2.5
Data 23 5 4
SRA, b tag pmissT [GeV] 100–150 150–250 >250
DY+jets 8.2±2.1 1.2±0.5 0.5±0.3
FS 2.3±0.8 1.7+0.7−0.6 0.1+0.2−0.1
Z+ν 1.9±0.4 2.0±0.5 1.8±0.6
Total background 12.4±2.3 4.9±1.0 2.5±0.7
Data 14 7 1
SRB, b veto pmissT [GeV] 100–150 150–250 >250 DY+jets 12.8±2.3 0.9±0.3 0.4±0.2 FS 0.4+0.3−0.2 0.4+0.3−0.2 0.1+0.2−0.1
Z+ν 0.3±0.1 0.7±0.2 1.2±0.4
Total background 13.6±2.4 2.0±0.5 1.6±0.4
Data 10 4 0
SRB, b tag pmissT [GeV] 100–150 150–250 >250
DY+jets 7.7±3.2 4.0±3.4 0.1±0.1
FS 1.4+0.6−0.5 1.1+0.5−0.4 0.2+0.2−0.1
Z+ν 2.0±0.5 2.3±0.6 1.0±0.3
Total background 11.1±3.3 7.4+3.5−3.4 1.3+0.4−0.3
Data 10 5 0
SRC, b veto pmissT [GeV] 100–150 >150
DY+jets 1.2±0.4 0.1±0.1
FS 0.4+0.3−0.2 0.1+0.2−0.1
Z+ν 0.1±0.1 0.5±0.2
Total background 1.7±0.5 0.7+0.3−0.2
Data 4 0
SRC, b tag pmissT [GeV] 100–150 >150
DY+jets 0.1±0.4 0.0±0.3
FS 0.0+0.1−0.0 0.3±0.2
Z+ν 0.6±0.2 0.6±0.2
Total background 0.8±0.5 0.9+0.5−0.4
Data 2 2
Table 2. Predicted and observed event yields are shown for the on-Z strong-production SRs, for eachpmissT bin defined in table 1. The uncertainties shown include both statistical and systematic components.
JHEP03(2018)076
[GeV]
T
pmiss
50 100 150 200 250 300 350
Events
1 10−
1