JHEP08(2016)029
Published for SISSA by Springer
Received: March 7, 2016 Revised: July 4, 2016 Accepted: July 13, 2016 Published: August 3, 2016
Measurement of the t¯ t production cross section in the eµ channel in proton-proton collisions at √
s = 7 and 8 TeV
The CMS collaboration
E-mail: [email protected]
Abstract:The inclusive cross section for top quark pair production is measured in proton- proton collisions at√
s= 7 and 8 TeV, corresponding to 5.0 and 19.7 fb−1, respectively, with the CMS experiment at the LHC. The cross sections are measured in the electron-muon channel using a binned likelihood fit to multi-differential final state distributions related to identified b quark jets and other jets in the event. The measured cross section values are 173.6±2.1 (stat)+ 4.5−4.0(syst)±3.8 (lumi) pb at √
s= 7 TeV, and 244.9±1.4(stat)+ 6.3−5.5(syst)±
6.4 (lumi) pb at √
s = 8 TeV, in good agreement with QCD calculations at next-to-next- to-leading-order accuracy. The ratio of the cross sections measured at 7 and 8 TeV is determined, as well as cross sections in the fiducial regions defined by the acceptance requirements on the two charged leptons in the final state. The cross section results are used to determine the top quark pole mass via the dependence of the theoretically predicted cross section on the mass, giving a best result of 173.8+1.7−1.8GeV. The data at √
s= 8 TeV are also used to set limits, for two neutralino mass values, on the pair production of supersymmetric partners of the top quark with masses close to the top quark mass.
Keywords: Hadron-Hadron scattering (experiments), Top physics ArXiv ePrint: 1603.02303
JHEP08(2016)029
Contents
1 Introduction 1
2 The CMS detector 3
3 Event simulation and theoretical calculations 3
4 Event selection 5
5 Cross section definitions 7
6 Analysis methods for the measurement of the cross section 9
6.1 Binned likelihood fit 9
6.2 Event counting method 13
7 Systematic uncertainties 16
7.1 Experimental uncertainties 16
7.2 Theoretical uncertainties 17
7.3 Correlations between systematic uncertainties for the measurements at 7
and 8 TeV 18
7.4 Final uncertainties 19
8 Cross section measurement 20
8.1 Fiducial cross section 20
8.2 Full phase space cross section 21
9 Determination of the top quark pole mass 22
10 Limits on top squark pair production 25
11 Summary 26
The CMS collaboration 35
1 Introduction
The study of top quark pair (tt) production in proton-proton (pp) collisions at the CERN LHC provides an important test of the standard model (SM). The total production cross section,σtt, can be accurately predicted by quantum chromodynamics (QCD) calculations at next-to-next-to-leading order (NNLO). A measurement of σtt can thus provide con- straints on essential ingredients in the calculation, such as the top quark mass, the proton
JHEP08(2016)029
parton distribution functions (PDFs), and the strong couplingαs. Furthermore, deviations from these predictions can be an indication of physics beyond the SM. For example, in supersymmetric (SUSY) models, tt pairs may appear as decay products of heavier new particles, increasing the tt yields.
Studies of the tt production cross section, as well as dedicated searches for deviations from the SM predictions, have been performed in recent years by the ATLAS and CMS collaborations using a variety of production and decay channels [1–22]. So far, all results are consistent with the SM.
This paper presents a new measurement of σtt in pp collisions at centre-of-mass ener- gies of 7 and 8 TeV. The measurement is performed in the eµchannel, where each W boson from the top quark decays into a charged lepton and a neutrino. Compared to the previous CMS analyses in the dilepton channel at 7 TeV [8] and 8 TeV [1], the new measurement is performed using the complete CMS data samples recorded in the years 2011 and 2012, with integrated luminosities of 5.0 and 19.7 fb−1 at √
s = 7 and 8 TeV, respectively. The restriction to the eµ channel provides a pure tt event sample owing to the negligible con- tamination from Z/γ∗ processes with same-flavoured leptons in the final state. The event selection is based on the kinematic properties of the leptons. An improved cross section extraction method is used, performing a template fit of the signal and background con- tributions to multi-differential binned distributions related to the multiplicity of b quark jets (referred to as b jets in the following) and the multiplicity and transverse momenta of other jets in the event. The results obtained with this method (referred to as the “ref- erence method” in the following) are cross-checked with an analysis performed using an event counting method.
The cross section is first determined in a fiducial (“visible”) range, σttvis, defined by requirements on the transverse momentum and pseudorapidity of the electron and muon.
The results are then extrapolated to obtain the cross section in the full phase space, σtt, with an additional assessment of the extrapolation uncertainties. The ratio of the cross sections at the two centre-of-mass energies is also presented. The measurements of σtt at 7 and 8 TeV are used to determine, together with the NNLO prediction [23], the top quark pole mass. Following a previous CMS analysis [24], the mass is determined via the dependence of the theoretically predicted cross section on the top quark mass.
The data are also used to constrain the cross section of pair production of the lightest supersymmetric partner of the top quark, the top squark, in the context of SUSY models withR-parity conservation [25]. The study focuses on models predicting the decay of top squarks into a top quark and a neutralino,et →teχ
0
1, and the three-body decay,et →bWeχ
0 1, with the neutralino assumed to be the lightest supersymmetric particle (LSP) [26]. The pair production and the subsequent decays of the top squarks can lead to a final state that is very similar to the SM tt events. The search is performed with the 8 TeV data, looking for an excess of the observed event yields of tt events with respect to the SM predictions. Exclusion limits are set with 95% confidence level (CL) for the SUSY signal strength as a function of the top squark mass for two neutralino mass hypotheses. Previous measurements setting exclusion limits in a similar regime can be found in [14,27].
This paper is structured as follows. Section 2 contains a brief description of the CMS detector, followed by details of the event simulation and theoretical calculations for the tt
JHEP08(2016)029
cross section are given in section 3. The event selection and the definitions of the visible and total cross sections are given in sections 4 and 5, respectively. The methods used to measure the cross section are explained in section 6 and the systematic uncertainties are described in section7. The measured tt production cross sections are reported in section8, with the extraction of the top quark mass presented in section 9. The search for SUSY is described in section10 and a summary is provided in section11.
2 The CMS detector
The central feature of the CMS apparatus is a superconducting solenoid of 6 m internal diameter, providing a magnetic field of 3.8 T. Within the solenoid volume are a silicon pixel and strip tracker, a lead tungstate crystal electromagnetic calorimeter (ECAL), and a brass and scintillator hadron calorimeter (HCAL), each composed of a barrel and two endcap sections. Extensive forward calorimetry complements the coverage provided by the barrel and endcap detectors. Muons are measured in gas-ionisation detectors embedded in the steel flux-return yoke outside the solenoid. A more detailed description of the CMS detector, together with a definition of the coordinate system used and the relevant kinematic variables, can be found in ref. [28].
The particle-flow (PF) [29,30] event algorithm reconstructs and identifies each individ- ual particle with an optimised combination of information from the various elements of the CMS detector. The energy of photons is directly obtained from the ECAL measurement.
The energy of electrons is determined from a combination of the electron momentum at the primary interaction vertex as determined by the tracker, the energy of the corresponding ECAL cluster, and the energy sum of all bremsstrahlung photons spatially compatible with originating from the electron track. The energy of muons is obtained from the curvature of the corresponding track. The energy of charged hadrons is determined from a combi- nation of their momentum measured in the tracker and the matching ECAL and HCAL energy deposits, corrected for zero-suppression effects and for the response function of the calorimeters to hadronic showers. Finally, the energy of neutral hadrons is obtained from the corresponding corrected ECAL and HCAL energy.
3 Event simulation and theoretical calculations
Experimental effects, related to the event reconstruction and choice of selection criteria, together with the detector resolution, are modelled using Monte Carlo (MC) event gener- ators interfaced with a detailed detector simulation. Unless specified, the same generators and parton shower models are used for the samples at 7 and 8 TeV.
The tt sample is simulated using the MadGraph event generator (v. 5.1.5.11) [31], which implements the relevant matrix elements at tree level with up to three additional partons. The MadSpin [32] package is used to incorporate spin correlation effects. The value of the top quark mass is fixed to 172.5 GeV and the proton structure is described by the CTEQ6L1 [33] PDF set. The generated events are subsequently processed withpythia (v. 6.426) [34] for parton showering and hadronisation, and the MLM prescription [35] is
JHEP08(2016)029
used for matching of matrix-element jets to parton showers. Decays ofτ leptons are handled with tauola (v. 2.75) [36]. An additional tt signal sample, which is used to determine specific model uncertainties of the measurement, is obtained with the next-to-leading-order (NLO) generatorpowheg(v. 1.0 r1380) [37] and also interfaced withpythia. Inpowheg, the value of the top quark mass is also set to 172.5 GeV, and the CT10 [38] PDF set is used to describe the proton structure. The pythia Z2* tune, derived from the Z1 tune [39], is used to characterise the underlying event in the tt samples at 7 and 8 TeV. The Z1 tune uses the CTEQ5L PDF set, whereas Z2* adopts CTEQ6L. The propagation of the generated particles through the CMS detector and the modelling of the detector response is performed using Geant4(v. 9.4) [40].
Only tt pair decays into e±µ∓+X in the final state are considered signal, including intermediate leptonicτ decays. The remaining tt decay modes are considered background processes and referred to as “tt bkg.”.
The other SM background samples are simulated withMadGraph(without theMad- Spin package), powheg, or pythia, depending on the process. The main background contributions originate from the production of W and Z/γ∗ bosons with additional jets (referred to in the following as W+jets and Drell-Yan (DY), respectively), single top quark tW channel, diboson (WW, WZ, and ZZ, referred to as VV in the following), tt produc- tion in association with a Z, W, orγ boson (referred to as ttV in the following), and QCD multijet events. The W+jets, DY, and ttV samples are simulated withMadGraph with up to two additional partons in the final state. The powheg[41,42] generator is used for simulating single top quark production, whilepythiais used to simulate diboson and QCD multijet events. Parton showering and hadronisation are also simulated withpythiain all the background samples. ThepythiaZ2* tune is used to characterise the underlying event in the background samples at √
s= 8 TeV, while the Z2 tune [43] is used at √
s= 7 TeV.
The simulated samples are normalised according to their expected total cross sections for integrated luminosities of 5.0 (19.7) fb−1for√
s= 7 (8) TeV. The expected cross sections are obtained from NNLO calculations for W+jets [44] and DY [45] processes, NLO+next- to-next-to-leading-log (NNLL) calculations for top quark tW or ¯tW channel [46], NLO calculations for VV [47], tt+W [48], and tt+Z [49] processes, and leading-order (LO) calculations for QCD multijet events [34].
A number of additional pp simulated hadronic interactions (pileup) are added to each simulated event to reproduce the multiple interactions in each bunch crossing in the data taking. The pileup events are generated using pythia. Scale factors (SFs) described in section4are applied when needed to improve the description of the data by the simulation.
Calculations of the σtt at full NNLO accuracy in perturbative QCD, including the resummation of NNLL soft-gluon terms [50], are used to normalise the tt simulated samples and to extract the top quark pole mass. Assuming a top quark mass of 172.5 GeV, the predicted cross sections are:
σtt = 177.3+ 4.7−6.0(scale)± 9.0 (PDF+αs) pb, at√
s= 7 TeV and σtt = 252.9+ 6.4−8.6(scale)±11.7 (PDF+αs) pb, at√
s= 8 TeV.
JHEP08(2016)029
The first uncertainty is an estimate of the effect of missing higher-order corrections and is determined by independent variations of the factorisation and renormalisation scales, µF
andµR, by factors of two, up and down from their default values (the top quark mass). The second uncertainty is associated with variations inαsand the PDF, following the PDF4LHC prescription with the MSTW2008 68% CL NNLO, CT10 NNLO, and NNPDF2.3 5f FFN PDF sets (as detailed in refs. [51, 52] and references therein, as well as in refs. [53–55]).
These values were calculated using the Top++2.0 program [50]. The ratio of the cross sections at 7 and 8 TeV computed with NNPDF2.3, RNNLOtt = σtt(8 TeV)/σtt(7 TeV), is 1.437±0.001 (scale)±0.006 (PDF)±0.001 (αs) [56].
4 Event selection
At trigger level, events are required to have one electron and one muon. For the 8 TeV data set one of the two leptons is required to havepT >17 GeV and the otherpT>8 GeV.
For the 7 TeV data set both leptons are required to have pT >10 GeV or to fulfil the same criterion as for the 8 TeV data set. The eµ trigger efficiency is measured in data with a method based on triggers that are uncorrelated with those used in the analysis [1, 57].
In particular, the triggers require jets or missing transverse energy, which is defined as the magnitude of the projection, on the plane perpendicular to the beam direction, of the vector sum of the momenta of all reconstructed particles in an event. The trigger efficiency for events containing an eµpair passing all selection criteria is approximately 96% at 7 TeV and 93% at 8 TeV. Using the eµ trigger efficiency measured in data, the corresponding efficiencies in the simulation are corrected by η-dependent SFs, which have an average value of 0.99 at 7 TeV and 0.97 at 8 TeV.
An interaction vertex [58] is required within 24 cm of the detector centre along the beam line direction, and within 2 cm of the beam line in the transverse plane. Among all such vertices, the primary vertex of an event is identified as the one with the largest value of the scalar sum of the p2T of the associated tracks.
Leptons are required to have pT >20 GeV and|η|<2.4. The lepton-candidate tracks are required to originate from the primary vertex.
Lepton candidates are required to be isolated from other PF candidates in the event.
For each electron [59] or muon [60] candidate, a cone with ∆R = 0.3 or 0.4, respectively, is constructed around the track direction at the primary vertex. Here ∆R is defined as ∆R =
√
(∆η)2+ (∆φ)2, where ∆η and ∆φ are the differences in pseudorapidity and azimuthal angle (in radians) between any PF candidate and the lepton track direction.
The scalar sum of the pT of all PF candidates contained within the cone is calculated, excluding the contribution from the lepton candidate itself. All charged PF candidates not associated with the chosen primary vertex are assumed to arise from pileup events, and are excluded from the calculation of thepT deposited in the cone. The neutral component is also corrected for pileup effects. The relative isolation discriminant, Irel, is defined as the ratio of this sum to the pT of the lepton candidate. An electron candidate is selected ifIrel <0.10; the corresponding requirement for muons isIrel <0.12.
The efficiency of the lepton selection is measured using a “tag-and-probe” method in dilepton events enriched with Z boson candidates [8, 61]. The measured values for the
JHEP08(2016)029
combined identification and isolation efficiencies are typically 80% for electrons and 90%
for muons. The lepton identification efficiencies in simulation are corrected to the measured values in data bypT andηdependent SFs, which have values in the range 0.97–0.99. From all events that contain oppositely charged lepton pairs, events are selected if the lepton pair with the largest value of the scalar sum of the pT corresponds to an eµ pair. Candidate events with eµ invariant masses meµ < 20 GeV are removed to reduce the contamination from QCD multijet processes. This selection is referred to as “eµ selection”.
Jets are reconstructed using the anti-kT clustering algorithm [62] with a distance pa- rameterR = 0.5. The algorithm uses the PF candidates as input objects. To minimise the impact of pileup, charged particle candidates not associated with the primary vertex are excluded. The jet energy is corrected for pileup in a manner similar to the correction of the total energy inside the lepton isolation cone. Additional jet energy corrections are also applied as a function of the jet pT and η [63]. Jets are selected if they have pT >30 GeV and |η| < 2.4 and the angular distance between them and the selected leptons satisfies
∆R(jet,lepton)>0.5.
As the tt events are expected to contain mainly jets from the hadronisation of b quarks, requiring the presence of b jets can reduce background from events without b quarks. Jets are identified as b jets (b-tagged) using the combined secondary vertex algorithm [64].
The discriminator threshold chosen for the reference method to extract the cross section corresponds to an identification efficiency for b jets of about 50% and a misidentification (mistag) probability of about 10% for c quark jets and 0.1% for light-flavour jets (u, d, s, and gluons). A looser discriminator threshold is chosen for the event counting method such that the efficiency is about 70% for jets originating from b quarks and 20% for c quark jets, while the probability of mistagging for jets originating from light flavours is around 1% [64]. For the reference method there are no constraints on the number of jets and b-tagged jets in the event.
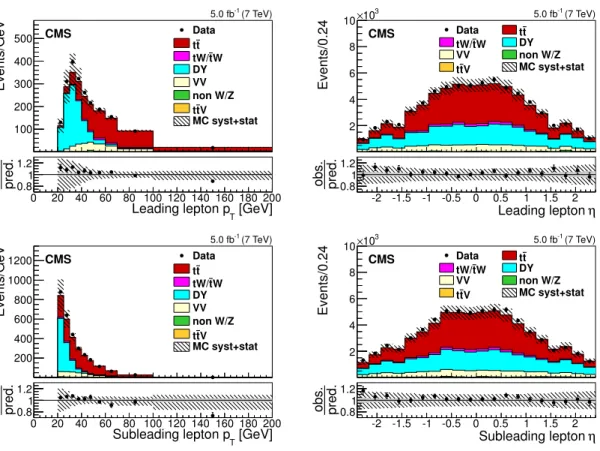
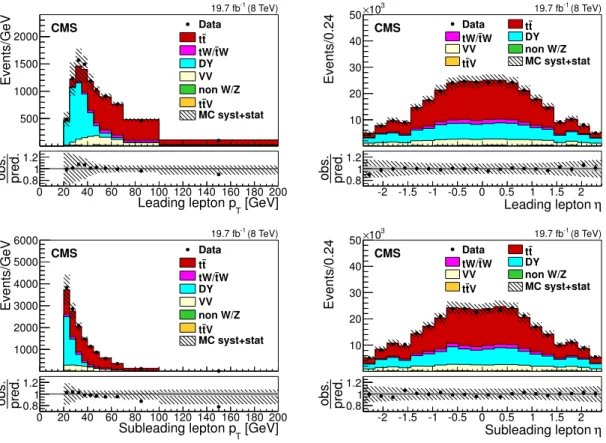
Figures1and2show for the 7 and 8 TeV data and simulations, respectively, thepT and ηdistributions of the highest (leading) and second-highest (subleading)pT lepton from the selected eµ pair, after the eµ selection is applied. The data are compared to the expected distributions for the tt signal and individual backgrounds, which are derived from MC simulated samples. The contributions from QCD multijet, W + jets, and tt background processes arise from events where at least one jet is incorrectly reconstructed as a lepton or a lepton that does not originate from a prompt W or Z boson decay fulfils the selection criteria. These contributions are referred to as “non W/Z” background.
In general, the sum of the estimated contributions provides an adequate description of the data, within uncertainties. However, as observed previously [57], the simulation is seen to have a somewhat harder pT spectrum than measured. The impact on the measurement is accounted for by including an additional modelling uncertainty.
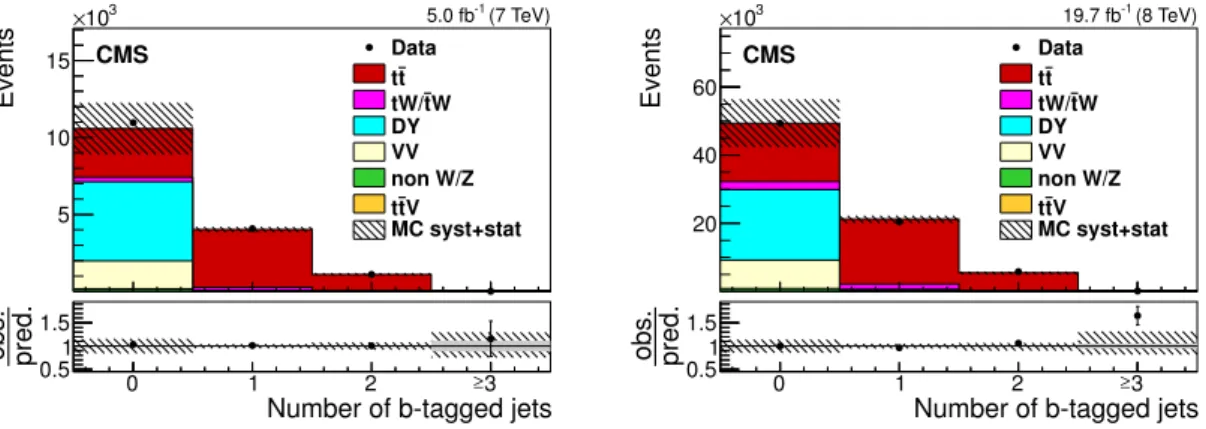
Figure 3shows the number of b-tagged jets in events passing the eµ selection at 7 and 8 TeV. It should be noted that the size of the uncertainties in figures 1–3 does not reflect those in the final measurements, which are constrained by the likelihood fit described in section6.1. Good agreement is observed between data and the sum of the expected yields.
JHEP08(2016)029
Events/GeV
100 200 300 400
500 Data
t t
W t tW/
DY VV non W/Z
V t t
MC syst+stat
[GeV]
Leading lepton pT
0 20 40 60 80 100 120 140 160 180 200
pred.obs. 0.81
1.2 CMS
(7 TeV) 5.0 fb-1
Events/0.24
2 4 6 8 10
103
×
Data tt W t
tW/ DY
VV non W/Z
V t
t MC syst+stat
Leading lepton η -2 -1.5 -1 -0.5 0 0.5 1 1.5 2
pred.obs. 0.81
1.2 CMS
(7 TeV) 5.0 fb-1
Events/GeV
200 400 600 800 1000
1200 Data
t t
W t tW/
DY VV non W/Z
V t t
MC syst+stat
[GeV]
Subleading lepton pT
0 20 40 60 80 100 120 140 160 180 200
pred.obs. 0.81
1.2 CMS
(7 TeV) 5.0 fb-1
Events/0.24
2 4 6 8 10
103
×
Data tt W t
tW/ DY
VV non W/Z
V t
t MC syst+stat
Subleading lepton η -2 -1.5 -1 -0.5 0 0.5 1 1.5 2
pred.obs. 0.81
1.2 CMS
(7 TeV) 5.0 fb-1
Figure 1. Distributions of pT (left) and η (right) of the leading (top) and subleading (bottom) leptons, after the eµselection, for the 7 TeV data. The last bin of thepTdistributions includes the overflow events. The hatched bands correspond to the total uncertainty in the sum of the predicted yields. The ratios of data to the sum of the predicted yields are shown at the bottom of each plot.
Here, an additional solid gray band represents the contribution from the statistical uncertainty in the MC simulation. The contributing systematic uncertainties are discussed in section 7.
5 Cross section definitions
The tt production cross sections are first measured in a fiducial range, defined within the kinematic acceptance of the tt decay particles that are reconstructable in the detector.
This avoids the need for extrapolating the cross sections into the unmeasured kinematic phase space of these particles. In this analysis the fiducial range is defined by the pT and η requirements on the electron and muon in the final state. The visible cross section, σttvis, is defined for events containing an oppositely charged eµ pair from the decay chain t→Wb→`νb (including W→τ ν →`ννν) and with both leptons satisfyingpT>20 GeV and|η|<2.4. This visible cross section is then extrapolated to obtain the cross section for tt production at parton level in the full phase space using the formula
σtt = σttvis
Aeµ. (5.1)
Here, Aeµ denotes the acceptance defined as the fraction of all tt events fulfilling the above selection criteria for the visible cross section. The acceptance is determined from the
JHEP08(2016)029
Events/GeV
500 1000 1500 2000
Data t t
W t tW/
DY VV non W/Z
V t t
MC syst+stat
[GeV]
Leading lepton pT
0 20 40 60 80 100 120 140 160 180 200
pred.obs. 0.81
1.2 CMS
(8 TeV) 19.7 fb-1
Events/0.24
10 20 30 40 50
103
×
Data tt W t
tW/ DY
VV non W/Z
V t
t MC syst+stat
Leading lepton η -2 -1.5 -1 -0.5 0 0.5 1 1.5 2
pred.obs. 0.81
1.2 CMS
(8 TeV) 19.7 fb-1
Events/GeV
1000 2000 3000 4000 5000
6000 Data
t t
W t tW/
DY VV non W/Z
V t t
MC syst+stat
[GeV]
Subleading lepton pT
0 20 40 60 80 100 120 140 160 180 200
pred.obs. 0.81
1.2 CMS
(8 TeV) 19.7 fb-1
Events/0.24
10 20 30 40 50
103
×
Data tt W t
tW/ DY
VV non W/Z
V t
t MC syst+stat
Subleading lepton η -2 -1.5 -1 -0.5 0 0.5 1 1.5 2
pred.obs. 0.81
1.2 CMS
(8 TeV) 19.7 fb-1
Figure 2. Distributions of pT (left) and η (right) of the leading (top) and subleading (bottom) leptons, after the eµselection, for the 8 TeV data. The last bin of thepTdistributions includes the overflow events. The hatched bands correspond to the total uncertainty in the sum of the predicted yields. The ratios of data to the sum of the predicted yields are shown at the bottom of each plot.
Here, an additional solid grey band represents the contribution from the statistical uncertainty in the MC simulation. The contributing systematic uncertainties are discussed in section 7.
Events
5 10 15
103
×
Data t t
W t tW/
DY VV non W/Z
V t t
MC syst+stat
Number of b-tagged jets
0 1 2 3
pred.obs.
0.5 1 1.5
CMS
(7 TeV) 5.0 fb-1
≥
Events
20 40 60
103
×
Data t t
W t tW/
DY VV non W/Z
V t t
MC syst+stat
Number of b-tagged jets
0 1 2 3
pred.obs.
0.5 1 1.5
CMS
(8 TeV) 19.7 fb-1
≥
Figure 3. Number of b-tagged jets after the eµ selection for 7 TeV (left) and 8 TeV (right). The hatched bands correspond to the total uncertainty in the sum of the predicted yields. The ratios of data to the sum of the predicted yields are shown at the bottom of each plot. Here, an additional solid grey band represents the contribution from the statistical uncertainty in the MC simulation.
The contributing systematic uncertainties are discussed in section7.
JHEP08(2016)029
simulated tt signal sample, and includes the leptonic branching fraction of the W bosons of 10.86% [65].
6 Analysis methods for the measurement of the cross section
Two methods are used to measure the tt production cross section. The reference method is a binned likelihood fit to multi-differential final state distributions, performed in categories of number of additional and b-tagged jets, as described in section 6.1. In addition, an analysis is performed using an event counting technique, as explained in section 6.2.
6.1 Binned likelihood fit
An extended binned likelihood fit is applied to determine σvistt . The expected signal and background distributions are modelled in the fit by template histograms constructed from the simulated samples. The free parameters in the fit areσvistt , the background normalisation parameters ~ω = (ω1, ω2, . . . , ωK) for the K sources of backgrounds, and the M nuisance parameters ~λ = (λ1, λ2, . . . , λM), representing sources of systematic uncertainties other than the background normalisation, such as the jet energy scale and the trigger efficiency.
The likelihood functionL, based on Poisson statistics, is given by L=Y
i
(exp [−µi]µnii/ni!)
K
Y
k=1
π(ωk)
M
Y
m=1
π(λm). (6.1)
Here, i denotes the bin index of the chosen final state distribution, and µi and ni are the expected and observed event numbers in bin i. The terms π(ωk) and π(λm) denote prior probability density functions for the background and the other nuisance parameters, representing the prior knowledge of these parameters. The Poisson expectation values µi
can be further decomposed as
µi =si(σttvis, ~λ) +
K
X
k=1
bMCk,i (~λ) (1 +γkωk). (6.2) Here, si denotes the expected number of tt signal events, which depends on σttvis and the nuisance parameters ~λ. The quantity bMCk,i represents the nominal template prediction of background events from sourcekin bini, andγkits estimated relative global normalisation uncertainty. In this analysis the background normalisation parameters ωk and the other nuisance parameters λm are defined such that each prior can be represented by a unit normal distribution, unless mentioned otherwise.
A suitable differential distribution for the likelihood fit is the number of selected b- tagged jets in the event. The probability to reconstruct and identify one of the two b jets from the decaying tt pair is nearly independent of the probability to reconstruct and identify the other b jet. Because of the large mass of the top quark, the kinematic properties of the two b jets are determined to a large extent by the nearly independent decay topologies of the t and ¯t, and strong kinematic acceptance correlations arise only for extreme production topologies, such as for tt pairs with a large Lorentz boost.
JHEP08(2016)029
Under the assumption of the independence of the probabilities to identify the b jets, it is possible to express the number of expected signal events with exactly one (s1), and exactly two (s2) b-tagged jets using binomial probabilities [14]:
s1=seµ2b(1−Cbb), (6.3)
s2=seµ2bCb. (6.4)
Here, seµ is the total number of events after the eµ selection and can be written as seµ = Lσttviseµ, with L being the integrated luminosity and eµ the efficiency for events to pass the eµ selection. The parameter b comprises the total efficiency that a b jet is reconstructed within the kinematic acceptance and b-tagged. The quantity Cb corrects for the small correlations between the tagging of the two b jets and can be expressed asCb= 4seµs2/(s1+ 2s2)2.
The remaining signal events with zero or more than two b-tagged jets are considered in a third category:
s0=seµ
h
1−2b(1−Cbb)−Cb2bi
. (6.5)
In ref. [14], two equations similar to eqs. (6.3), (6.4) are directly solved for the tt production cross section and b. In the present analysis, eqs. (6.3), (6.4) are used together with eq. (6.5) in the template fit. The quantitieseµ, b, and Cb are directly determined from the tt signal simulation, expressing b as (s1+ 2s2)/2seµ, and parametrised as a function of the nuisance parameters ~λ. The nominal values for the 8 TeV simulated tt signal are eµ = 0.51, b = 0.36, and Cb = 0.99, and the values for the 7 TeV sample are similar. The use of these equations facilitates an accurate modelling of the expected signal rates as a function of the nuisance parameters, i.e. avoiding mismodelling effects that could arise from approximating the dependences as linear functions.
In order to improve the sensitivity of the fit, the events are further categorised into four classes of multiplicity of additional jets in the event (zero, one, two, and three or more additional jets). This leads, together with the three classes of b-tagged jets, to 12 different categories in total. Additional jets must be non-b-tagged jets. In case there is no additional jet, the corresponding event yields are directly used in the likelihood fit, otherwise events are further categorised into bins of thepT of the least energetic additional jet in the event.
The signal subcategory probabilities, background rates, and values of eµ, b, and Cb are obtained from simulation and depend on the nuisance parameters~λ. Each relevant dependency of a quantity on a parameterλmis modelled by a second-order polynomial, that is constructed from evaluating the quantity at three values λm = 0,1,−1, corresponding to the nominal value of the parameter and to ±1 standard deviation (σ) variations. For a few sources of uncertainty, only one exact variation is possible, e.g. when there are only two variants of signal generators available that differ in a certain uncertainty source such as the matrix element calculation; in such cases, a linear function is chosen to model the dependence of the quantity on the respective λm. For several nuisance parameters representing systematic modelling uncertainties in the measurement, a box prior is chosen instead of the standard unit normal prior, with a value of 0.5 between−1 and +1 and zero elsewhere. Such priors are chosen for the following uncertainties (discussed in section 7.2):
JHEP08(2016)029
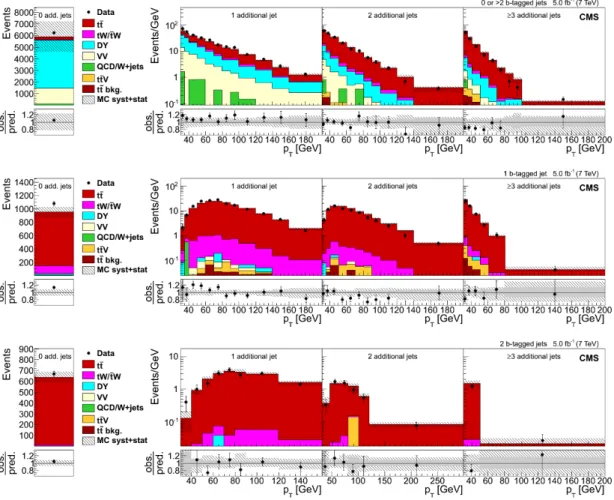
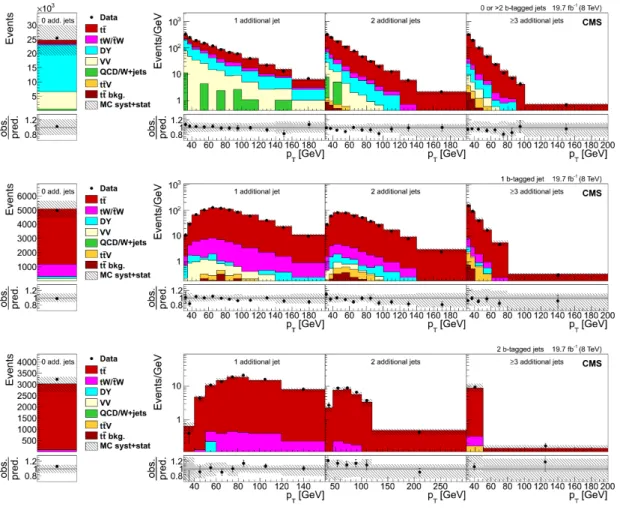
Figure 4. Total event yield for zero additional non-b-tagged jets (left) andpTof the non-b-tagged jet with the lowestpTin the event (right) for events with one, two, and at least three additional non- b-tagged jets, and with zero or more than two (top row), one (middle row), and two (bottom row) b-tagged jets at√
s= 7 TeV. The last bin of thepTdistributions includes the overflow events. The hatched bands correspond to the sum of statistical and systematic uncertainties in the event yield for the sum of signal and background predictions. The ratios of data to the sum of the predicted yields are shown at the bottom of each plot. Here, an additional solid grey band represents the contribution from the statistical uncertainty in the MC simulation.
renormalisation and factorisation scales, jet-parton matching scale, top quarkpTmodelling, colour reconnection, underlying event, and matrix element generator.
The likelihood fit is finally performed using the function χ2 =−2 lnL, whereL is the likelihood function given in eq. (6.1). Theminuit[66] program is used to minimise this χ2 as function of the free fit parametersσtt,~ω, and~λ. The fit uncertainty inσtt is determined usingminos, the profile likelihood algorithm which is part of minuit. Figures4and5show the multi-differential distributions used in the fit. A reasonably good agreement is found between data and expectations before the fit.
Figures 6 and 7 compare the data with the simulation after the simultaneous fit at 7 and 8 TeV. The uncertainty bands are calculated taking into account the full correlation matrix. The description of the data by the simulation has improved with the fit. The best
JHEP08(2016)029
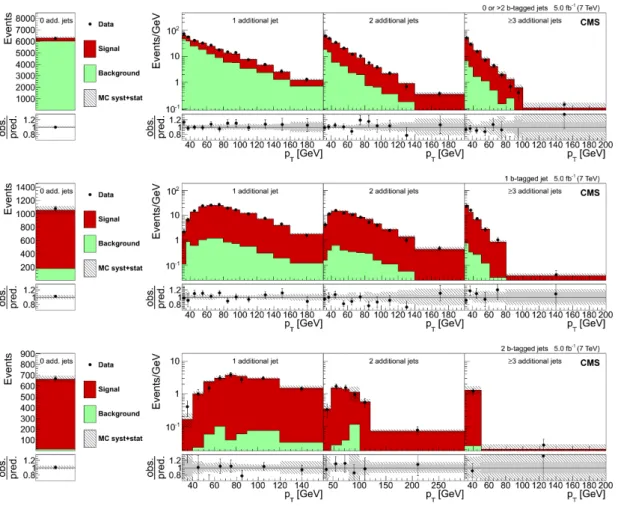
Figure 5. Total event yield for zero additional non-b-tagged jets (left) and pT of the additional non-b-tagged jet with the lowestpTin the event (right) for events with one, two, and at least three additional non-b-tagged jets, and with zero or more than two (top row), one (middle row), and two (bottom row) b-tagged jets at√
s= 8 TeV. The last bin of thepTdistributions includes the overflow events. The hatched bands correspond to the sum of statistical and systematic uncertainties in the event yield for the sum of signal and background predictions. The ratios of data to the sum of the predicted yields are shown at the bottom of each plot. Here, an additional solid grey band represents the contribution from the statistical uncertainty in the MC simulation.
fit values of the nuisance parameters correspond to variations that are for most cases within 1σ of the prior uncertainties, about 98% of the cases. The maximum observed variation is about 1.9σ, corresponding to the uncertainty in the mistag SFs, see section 7. Other uncertainties with variations between 1 and 1.5σ are two components of the jet energy scale corrections and the statistical component of the b tagging SFs.
The fiducial tt production cross sections at √
s= 7 and 8 TeV are determined simul- taneously. For each centre-of-mass energy, a likelihood is defined as in eq. (6.1), respective χ2 functions are constructed, and the sum of both χ2 functions is minimised. Correlations between systematic uncertainties are fully taken into account (see section 7.3).
JHEP08(2016)029
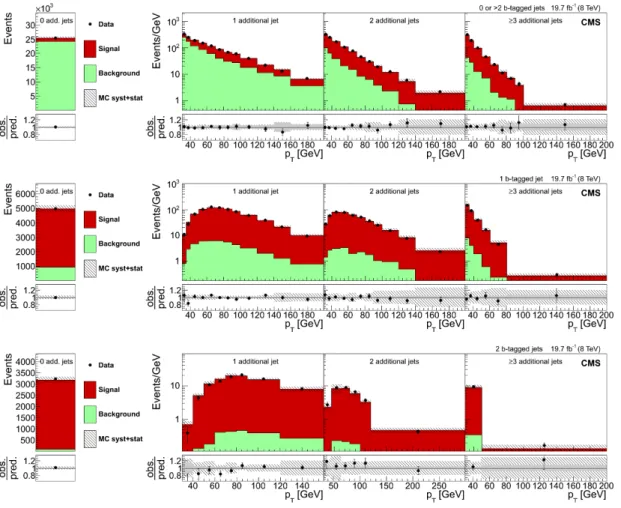
Figure 6. Fitted total event yield for zero additional non-b-tagged jets (left) and pT of the non- b-tagged jet with the lowest pT in the event (right) for events with one, two, and at least three additional non-b-tagged jets, and with zero or more than two (top row), one (middle row), and two (bottom row) b-tagged jets at√
s= 7 TeV. The last bin of thepTdistributions includes the overflow events. The hatched bands correspond to the sum of statistical and systematic uncertainties in the event yield for the sum of signal and background predictions after the fit, and include all correlations.
The ratios of data to the sum of the predicted yields are shown at the bottom of each plot. Here, an additional solid grey band represents the contribution from the statistical uncertainty in the MC simulation.
6.2 Event counting method
The tt production cross section is also measured by applying an event counting method similar to the one used in a previous measurement [1]. This method provides a cross-check of the reference method.
In this analysis, events are counted after applying the eµselection described in section4 with additional requirements that help to further suppress the background contribution:
the presence of at least two jets is required, of which at least one has to be b-tagged.
Compared with ref. [1], tighter requirements on lepton isolation and identification, as well as on b tagging, are applied to further reduce the background contribution.
Techniques based on control samples in data are used to estimate the background contribution arising from DY and from non W/Z events. The contributions of the remaining
JHEP08(2016)029
Figure 7. Fitted total event yield for zero additional non-b-tagged jets (left) and pT of the non- b-tagged jet with the lowest pT in the event (right) for events with one, two, and at least three additional non-b-tagged jets, and with zero or more than two (top row), one (middle row), and two (bottom row) b-tagged jets at√
s= 8 TeV. The last bin of thepTdistributions includes the overflow events. The hatched bands correspond to the sum of statistical and systematic uncertainties in the event yield for the sum of signal and background predictions after the fit, and include all correlations.
The ratios of data to the sum of the predicted yields are shown at the bottom of each plot. Here, an additional solid grey band represents the contribution from the statistical uncertainty in the MC simulation.
background processes are estimated from simulation. The DY contribution is estimated using the “Rout/in” method [1], in which events with e+e−and µ+µ− final states are used to obtain a normalisation factor. This is estimated from the number of events within the Z boson mass window in data, and extrapolated to the number of events outside the Z mass window with corrections based on control regions in data enriched in DY events.
The contribution to the background originating from non W/Z boson events is estimated by subtracting the same-sign prompt-lepton contributions from the same-sign event yields in data and multiplying by the ratio of opposite-sign over same-sign events. This ratio, originating from non-prompt lepton backgrounds, is taken from simulation.
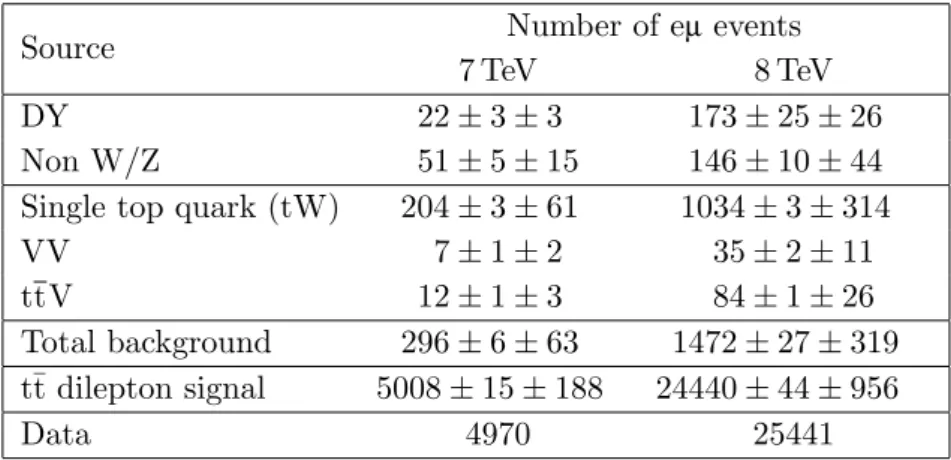
Table1shows the total number of events observed in data and the numbers of expected signal and background events fulfilling all selection criteria. For both data sets, a good agreement between data and expected number of events is observed.
JHEP08(2016)029
Source Number of eµ events
7 TeV 8 TeV
DY 22±3±3 173±25±26
Non W/Z 51±5±15 146±10±44
Single top quark (tW) 204±3±61 1034±3±314
VV 7±1±2 35±2±11
ttV 12±1±3 84±1±26
Total background 296±6±63 1472±27±319 t¯t dilepton signal 5008±15±188 24440±44±956
Data 4970 25441
Table 1. Number of selected events for the event counting method for the 7 and 8 TeV data sets. The results are given for the individual sources of background, tt signal, and data. The two uncertainties quoted correspond to the statistical and systematic components (cf. section 7), respectively.
Events
2000 4000 6000
Data tt W t
tW/ DY
VV non W/Z
V t
t MC syst+stat
Number of b-tagged jets
0 1 2
pred.obs. 0.91
1.1 CMS
(7 TeV) 5.0 fb-1
≥
Events
10 20 30
103
×
Data tt W t
tW/ DY
VV non W/Z
V t
t MC syst+stat
Number of b-tagged jets
0 1 2
pred.obs. 0.91
1.1 CMS
(8 TeV) 19.7 fb-1
≥
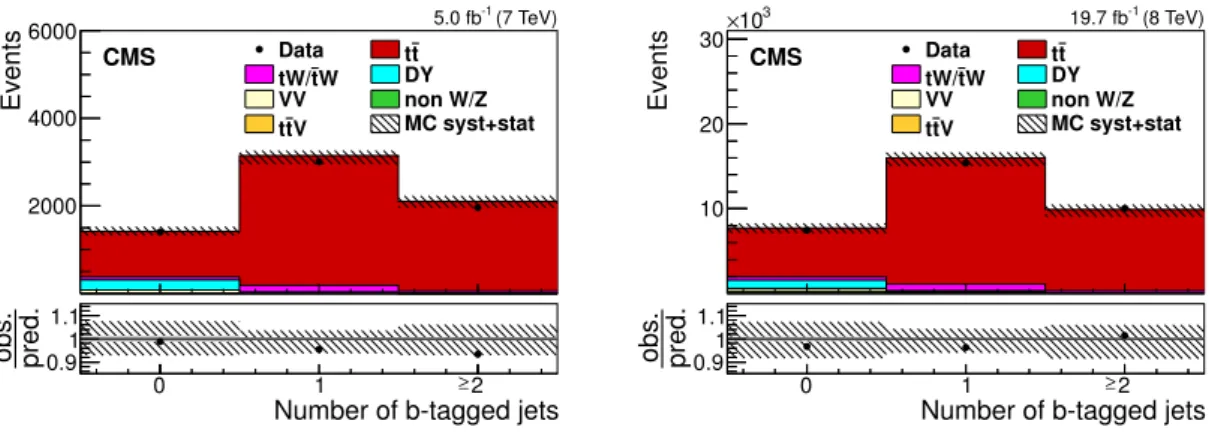
Figure 8. Comparison of the b jet multiplicity distributions in the eµchannel for 7 (left) and 8 (right) TeV between the data and simulation for events fulfilling the eµselection and the requirement of having at least two jets. The hatched bands correspond to the sum of statistical and systematic uncertainties in the event yield for the signal and background predictions. The ratios of data to the predicted yields are shown at the bottom of each plot. Here, an additional solid grey band represents the contribution from the statistical uncertainty in the MC simulation.
Figure8shows the b jet multiplicity in events passing the full event selection, except for the b jet requirement, for data collected at 7 and 8 TeV. In both cases the total predicted yields provide a good description of the measured distributions.
The cross section σtt is determined from the number of data events after background subtraction, and dividing by the integrated luminosity of the data sample and by the product of detector and kinematical acceptance, selection efficiency, as estimated from simulation for a top quark mass of 172.5 GeV, and branching fraction of the selected tt dilepton final state.
JHEP08(2016)029
7 Systematic uncertainties
The measurement of the top quark pair production cross section is affected by systematic uncertainties that originate from detector effects and from theoretical assumptions. Each source of systematic uncertainty is assessed individually by suitable variations of the MC simulations or by varying parameter values within their estimated uncertainties in the analysis. Each source is represented by a nuisance parameter, which is fitted together with σttvis, as described in section 6. For the event counting method, the same sources of systematic uncertainty are evaluated following the procedure in ref. [1].
7.1 Experimental uncertainties
The uncertainty in the dilepton trigger (“Trigger”) and lepton identification efficiencies (“Lepton ID/isolation”) are estimated by varying the SFs within their uncertainties, which are in the range of 1–2%.
The lepton energies (“Lepton energy scale”) are corrected separately for electrons [59]
and for muons [67]. Their scales are varied by 0.15% for electrons and 0.3% for muons.
The uncertainty due to the limited knowledge of the jet energy scale (“JES”) is deter- mined by variations of the jet energy in bins of pT and η [63]. For the reference method, these variations are divided into 27 sources and the effect of each source is evaluated in- dividually. For the event counting method, the total variation is used to determine the uncertainty.
The uncertainty due to the limited accuracy of the jet energy resolution (“JER”) is determined by changing the simulated JER by ±2.5%, ±4%, and ±5%, for jets with
|η|<1.7, 1.7<|η|<2.3, and|η|>2.3, respectively [63].
For the normalisation of each background source, an uncertainty of ±30% is assumed.
In the case of the single top quark background (“tW/tW”), the variation covers the uncer- tainty in the absolute rate, including uncertainties due to PDFs. The same global variation is applied to the other dominant background contribution, DY. The predicted cross sec- tion has an uncertainty of ≈5%, including PDF uncertainties. The variation used here additionally covers the observed differences in heavy-flavour composition between data and simulation in dedicated CMS analyses and is also suggested by estimates based on data [4,8].
The uncertainties due to the b tagging efficiency (“b tag”) and misidentification rate (“Mistag”) are determined by varying the b tagging SFs of the b jets or the light-flavour jets, respectively, by the uncertainties quoted in ref. [64]. For the reference method, the b tagging uncertainties are divided into 19 individual sources, some of them are corre- lated to other systematic uncertainties, such as JER or pileup. The remaining sources are evaluated individually.
The effect of pileup events (“Pileup”) is evaluated by weighting the inelastic pp cross section in simulation to the minimum bias cross section determined in data. The pileup model estimates the mean number of additional pp interactions to be about 9 events for the data collected at 7 TeV and 21 for the data collected at 8 TeV. These estimates are based on the total inelastic pp cross sections at√
s= 7 (8) TeV, which are determined to be 73.5
JHEP08(2016)029
(69.4) mb, following the measurement described in ref. [68]. The systematic uncertainty is determined by varying the cross sections within their uncertainty, ±8% at 7 TeV and±5%
at 8 TeV.
The uncertainty in the luminosity (“Luminosity”) measurement is 2.2% [69] at 7 TeV and 2.6% [70] at 8 TeV.
7.2 Theoretical uncertainties
The impact of theoretical assumptions in the modelling is determined by repeating the analysis and replacing the standard MadGraph tt simulation by dedicated simulation samples with varied parameters.
The uncertainty in modelling of the hard-production process (“Q2 scale”) is assessed through a simultaneous variation of renormalisation and factorisation scales in the Mad- Graph sample by factors of 2 and 0.5 relative to their common nominal value, which is set to the µ2F = µ2R = Q2 scale of the hard process. In MadGraph, it is defined by Q2 = m2t + Σp2T, where the sum is over all additional final state partons in the matrix element calculations.
The impact of the choice of the scale that separates the description of jet production through matrix elements or parton shower (“ME/PS matching”) inMadGraphis studied by changing its reference value of 20 GeV to 40 GeV and to 10 GeV.
The effect of the matrix-element generator choice on the measurement is evaluated by usingpowheg [37,41,42] for the tt simulation instead of MadGraph (“MadGraph vs powheg”).
The flavour-dependent hadronisation uncertainty (“Hadronisation (JES)”) is part of the JES uncertainty and comes from differences in the jet energy response for different jet flavours. It is estimated by the differences between using simulations with the Lund fragmentation model in pythia and cluster fragmentation model in herwig++ [71] and is evaluated for each jet flavour independently. An additional uncertainty included in this source is the uncertainty in the b quark fragmentation tune. This is evaluated by vary- ing the Bowler-Lund b quark fragmentation model in tune Z2* to describe the results by ALEPH [72] and DELPHI [73] for the b quark fragmentation functions. Another uncer- tainty included in this source is the uncertainty in the semileptonic branching fraction of B hadrons, varied between 10.05% and 11.27%, which is the range of the measurements from B0/B+ decays and their uncertainties [65].
Differential cross section measurements [57] have shown that thepT of the top quark is softer than predicted by the nominal MadGraph simulation used to measure the cross section. To account for this effect, the difference between the result obtained with the nom- inal simulation and using theMadGraph prediction reweighted to describe the measured top quark pT spectrum is taken as a systematic uncertainty (“Top quark pT modelling”).
The uncertainties from ambiguities in modelling colour reconnection effects (“Colour reconnection”) are estimated by comparing simulations of an underlying event tune in- cluding colour reconnection to a tune without it, the Perugia 2011 (P11) and P11 noCR tunes [74].
JHEP08(2016)029
The uncertainty in the modelling of the underlying event (“Underlying event”) is esti- mated by evaluating the relative variations of two different P11pythiatunes with respect to the standard P11 tune: the mpiHi and the TeV tunes with higher and lower underlying event activity, respectively.
The uncertainty from the choice of PDFs (“PDF”) is determined by reweighting the sample of simulated tt events according to the 52 CT10 error PDF sets [38], scaled to 68% CL.
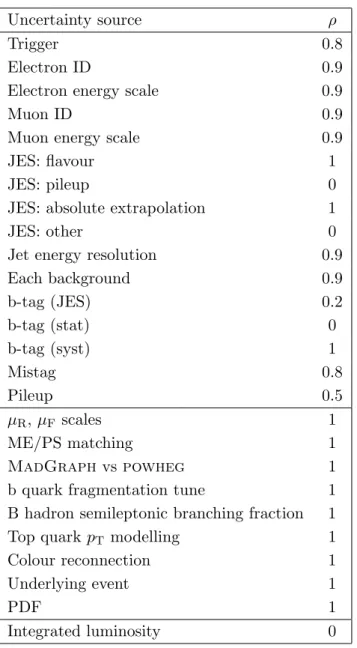
7.3 Correlations between systematic uncertainties for the measurements at 7 and 8 TeV
A number of systematic uncertainties affect the measurements at √
s= 7 and 8 TeV sim- ilarly, while others are completely decoupled. In this analysis, systematic uncertainties are treated as either uncorrelated, partially correlated, or fully correlated between the two measurements. For fully correlated systematic uncertainties, common nuisance parame- ters are used in the simultaneous likelihood fit to the two data sets. For each partially correlated systematic uncertainty source, three nuisance parameters are introduced, one for each data set for the uncorrelated part and one common parameter for the correlated part. The degree of correlation is modelled by the parameter ρ. The uncertainties of the correlated and the two uncorrelated parameters are taken to be fractions ρ and
√ 1−ρ2, respectively, of the uncertainty of the original nuisance parameter. The ρ values assumed for this analysis are listed in table 2.
For experimental sources, the same procedures are usually employed at the two centre- of-mass energies for calibration and determination of uncertainties. Also, the same MC generators are used for the modelling of background processes. Hence, these uncertainties are treated as 100% correlated, however for each source a (usually small) uncorrelated component arises from statistical fluctuations in the data or simulated samples. The re- sulting correlation coefficients are estimated to be 0.9 for several sources and 0.8 for the
“Trigger” and “Mistag” sources. For the “Pileup” source a relatively small correlation of 0.5 is assumed because of the largely different beam conditions at the two energies.
From the uncertainties related to the JES, the flavour components (“JES: flavour”), owing to the comparison between different hadronisation models, and components related to the extrapolation from Z → ``kinematic acceptance to the full phase space using MC simulation (“JES: absolute extrapolation”) are taken as fully correlated. The JES sources related to pileup (“JES: pileup”) are treated as uncorrelated, because of different proce- dures used for the uncertainty assessment at the two energies, as well as the remaining terms (“JES: other”). The JES component of the b tagging uncertainties is fitted indepen- dently, assigning a correlation coefficient of 0.2 that reflects the amount of correlated JES uncertainty sources.
All modelling uncertainties are assumed to be fully correlated between the two centre- of-mass energies, including the three remaining JES parts. The integrated luminosity uncertainties are treated as fully uncorrelated, to account for the different beam conditions and specific effects associated to each measurement. It has been checked that variations of the assumed correlations within reasonable ranges lead to negligible changes of the extracted cross sections.
JHEP08(2016)029
Uncertainty source ρ
Trigger 0.8
Electron ID 0.9
Electron energy scale 0.9
Muon ID 0.9
Muon energy scale 0.9
JES: flavour 1
JES: pileup 0
JES: absolute extrapolation 1
JES: other 0
Jet energy resolution 0.9
Each background 0.9
b-tag (JES) 0.2
b-tag (stat) 0
b-tag (syst) 1
Mistag 0.8
Pileup 0.5
µR,µF scales 1
ME/PS matching 1
MadGraph vs powheg 1
b quark fragmentation tune 1
B hadron semileptonic branching fraction 1
Top quark pT modelling 1
Colour reconnection 1
Underlying event 1
PDF 1
Integrated luminosity 0
Table 2. Assumed correlationsρbetween systematic uncertainties for the 7 and 8 TeV data sets.
Ifρ= 0, the uncertainties are treated as uncorrelated between the two sets.
7.4 Final uncertainties
The total uncertainties in the fiducial cross sections, as obtained with the binned likelihood fit (section 6.1), are +3.6−3.4% at 7 TeV and +3.7−3.4% at 8 TeV. The impact of the sources of systematic uncertainties in this total uncertainty are listed in table3. These are estimated by removing groups of uncertainties one at a time and gauging the difference in quadrature on the total uncertainty. Significant contributions to the total uncertainty spread over many different sources of experimental and modelling uncertainties with “Lumi”, “Lepton ID/isolation”, “Trigger”, and “DY” being the four largest sources. The observed shifts of the fitted background or other nuisance parameters compared to their assumed uncertainty before the fit are in general small, indicating a consistent fit.
JHEP08(2016)029
Source Uncertainty [%]
7 TeV 8 TeV
Trigger 1.3 1.2
Lepton ID/isolation 1.5 1.5 Lepton energy scale 0.2 0.1
Jet energy scale 0.8 0.9
Jet energy resolution 0.1 0.1
tW/tW 1.0 0.6
DY 1.4 1.3
tt bkg. 0.1 0.1
ttV 0.1 0.1
Diboson 0.2 0.6
W+jets/QCD 0.1 0.2
b-tag 0.5 0.5
Mistag 0.2 0.1
Pileup 0.3 0.3
µR,µF scales 0.3 0.6
ME/PS matching 0.1 0.1
MadGraph vspowheg 0.4 0.5 Hadronisation (JES) 0.7 0.7 Top quarkpT modelling 0.3 0.4 Colour reconnection 0.1 0.2
Underlying event 0.1 0.1
PDF 0.2 0.3
Integrated luminosity 2.2 2.6
Statistical 1.2 0.6
Table 3. Illustrative summary of the individual contributions to the total uncertainty in the visible tt cross section measurements.
8 Cross section measurement
The results of the tt cross section measurements in pp collisions at 7 and 8 TeV are presented in the fiducial range and in the full phase space.
8.1 Fiducial cross section
The fiducial cross sections are defined for tt production with events containing an oppositely charged eµ pair with both leptons having pT >20 GeV and |η|<2.4. The measured cross sections, using the binned likelihood fit extraction method (section 6) and assuming a top
JHEP08(2016)029
Source Uncertainty [%]
7 TeV 8 TeV Total (visible) +3.6−3.4 +3.7−3.4 Q2 scale (extrapol.) +0.1−0.4 +0.2−0.1 ME/PS matching (extrapol.) +0.1−0.1 +0.3−0.3 Top quarkpT (extrapol.) +0.5−0.3 +0.6−0.3 PDF (extrapol.) +0.1−0.1 +0.1−0.1
Total +3.6−3.5 +3.7−3.5
Table 4. Individual contributions to the systematic uncertainty in the total tt cross section mea- surements. The total systematic uncertainties in the fiducial cross sectionsσvistt are given in the row
“Total (visible)”, and those in the full phase space cross sectionσtt in the row “Total”.
quark mass of 172.5 GeV, are
σvistt = 3.03±0.04 (stat)+ 0.08−0.07(syst)±0.07 (lumi) pb, at√
s= 7 TeV and σvistt = 4.23±0.02 (stat)+ 0.11−0.09(syst)±0.11 (lumi) pb, at√
s= 8 TeV.
The uncertainties are due to statistical fluctuations, combined experimental and theoretical systematic effects on the measurement, and the uncertainty in the measurement of the integrated luminosity. A summary of the systematic uncertainties is presented in table 3.
8.2 Full phase space cross section
The full phase space (total) cross sections for tt production are calculated from the fiducial cross section results by dividingσvistt by the acceptance, as in eq. (5.1). The quantityAeµ is determined from the tt signal MC simulation. As it depends on the exact theoretical model used in the event generation part of the simulation, it is parametrised as a function of the same nuisance parameters that were used for the modelling uncertainties (section7) in the binned likelihood fit extraction of the fiducial cross sections. The fitted values of these nuisance parameters are used to obtain the best estimates of Aeµ, 1.745×10⁻² at 7 TeV and 1.728×10⁻² at 8 TeV, which are used for the determination of the nominal values of σtt. In order to determine the uncertainty in the phase space extrapolation modelled by Aeµ, each relevant nuisance parameter is iteratively varied from the fitted value by the±1σ values before the fit, while all other nuisance parameters are kept at their fitted values.
The resulting variations of Aeµ are taken as an additional extrapolation uncertainty. The sources that are considered here are “µR andµF scales”, “ME/PS matching”, “Top quark pT modelling”, and “PDF” (see section 7), and the individual uncertainties in σtt from these sources are added in quadrature. The resulting systematic uncertainties are listed in table 4.
JHEP08(2016)029
The measurements of σttat the two centre-of-mass energies are σtt = 173.6±2.1 (stat)+ 4.5−4.0(syst)±3.8 (lumi) pb, at√
s= 7 TeV and σtt = 244.9±1.4 (stat)+ 6.3−5.5(syst)±6.4 (lumi) pb, at√
s= 8 TeV.
After adding the uncertainties in quadrature, the resulting total uncertainties are 6.2 pb (3.6%) at√
s= 7 TeV and 9.1 pb (3.7%) at √
s= 8 T