1 KEEI Research Report 17-17
Analysis of the Problems of and Alternatives to the Asian Marker Crude Oil
Dalseok Lee
2
Research Staff
Head Researcher: Dalseok Lee, Senior Research Fellow of KEEI
Research Associates: Dong-uk Park, Postdoctoral Researcher of KEEI
Sunghee Choi, Professor of Keimyung University
Jeongseok Oh, Head Researcher of KCIF
3 ABSTRACT
This study examines the characteristics of a marker crude which plays an important role in the international oil market, and analyzes the problems of and alternatives to Dubai oil, which is the marker crude in Asia. One such alternative is to improve the price assessment method for Dubai oil performed by the price reporting agencies(PRA) to prevent price distortion. The other is to find a new benchmark that can replace Dubai oil. Additionally, this paper proposes a strategy to promote each alternative through international cooperation. The study can be summarized as follows.
The fundamental problem of the Asian marker crude, which is Dubai oil, is that it does not meet the basic requirements of a benchmark, such as adequate production volumes, stability of supply, and a variety of sellers and buyers. Despite these inadequacies, Dubai oil remains a marker crude because Platts, a price reporting agency, evaluates and publishes its prices. However, the current assessment of the price of Dubai oil carries with it several problems.
First, there is little transparency in the pricing process engaged in by a PRA. Many problems are likely to occur in evaluation: PRA evaluators may be subjective in their pricing in the absence of sufficient information;
information providers may selectively offer distorted information favorable to them; and market participants may act in collusion with a PRA.
Second, a broadening of the kinds of oil tradable through Platts eWindow(Platts' price evaluation system), made to improve the liquidity of Dubai oil, has not greatly increased trading volumes. Since January 2016, Platts has added two more crude oils(Al-Shaheen and ALS, Murban) to the existing three crude oils(Dubai, Upper Zakum, and Oman) in the basket for Dubai benchmark. However, this broadening of the number of deliverable oils has not brought about a significant impact on market liquidity, and has simply undermined stability of the benchmark since crude oils with different characteristics are now included in the benchmark basket.
Third, some issues in Platts’ Market-on-Close(MOC) price assessment methodology can be pointed out. If the last transaction just before the close of the trading market is not a normal one, the price will be seriously distorted.
Of course, a more fundamental reason for possible price distortion is that a small number of companies are participating in the transaction.
Fourth, there is a time lag in the pricing of Dubai oil. The closing price is determined at 4:30 pm Singapore time, making for a 10-hour difference with the time of the closing price of Brent, or the price of ICE futures (2:30 am Singapore time, the following morning). As a result, Dubai oil prices reflect major market events one day later
4 than those of other benchmark crudes.
Despite these problems, Dubai oil prices remain a benchmark for long-term crude oil contracts in Asia, and are also linked to the prices of various petroleum products and derivatives markets. It will not be easy to change the market order centering on Dubai oil. Therefore, in the short term, improvement of the price evaluation process performed by Platts is desirable, while in the long term, finding a more suitable alternative to Dubai oil is the goal.
In order to improve the logic in PRA price evaluation in the short term, it is necessary to monitor PRA valuation activities, increase liquidity, and create an environment in which PRAs are held in check.
Above all, as there is still a possibility of price distortion due to opacity in the qualitative evaluation methodology and the possibility of subjective judgment in the PRA evaluation, continuous monitoring is essential.
However, it should be noted that if regulations and oversight are too tight, quality market participants and information will leave the market, thereby impairing the reliability of price evaluation. Inclusion of an offshore crude oil that is similar in quality to Dubai’s in the basket of tradable oils, and allowing reselling, would help to increase liquidity in the price evaluation system.
Next, the creation of an environment that will assist in holding PRAs in check is a way to respond to the information monopoly that they, and some market participants, presently hold and induce reasonable market pricing. To do this, it will be necessary to examine the establishment of an Energy Data Hub (EDH), which allows all market participants access to all information for minimal cost. Another option is to open a futures market for crude oil that reflects the characteristics of Middle Eastern crude oil traded in Asia. If crude oils in the Asian futures market are traded through an all-day trading system as are WTI and Brent, the problem of a price lag due to the time difference can be avoided.
New marker crudes likely to replace Dubai oil as a long-term alternative include Russia’s ESPO, Oman oil futures listed in the Dubai Commodity Exchange(DME), the crude oil futures of the Shanghai International Energy Exchange(INE) to be made in China, and Brent, which is an existing European marker crude. However, these oils are not sufficient to function as an Asian marker crude. The existing oil pricing methodology in Asian countries, using Dubai crude oil as the benchmark, is expected to persist for a considerable period of time. Noteworthy is the recent move by Iraq to convert its marker crude, applied to the sale of its domestic crude oil, to the futures prices of Omani oil listed on the DME.
There are a few strategies, achievable through international cooperation, in relation to the matters reviewed and presented as alternatives in this study. Regarding comprehensive improvements to a PRA pricing assessment, the framework of the existing international coordination system established through the G20 Summit is expected to
5
be utilized. In other words, IOSCO, IEA, OPEC, and IEF, centering on the G20 meeting, form the framework of cooperation. With regard to improvement in Platts' Dubai oil price assessment, it is necessary to utilize a regional multilateral energy cooperation bodies.
Regarding replacement of the existing marker crude, which is a long-term alternative, the Omani futures listed on the Dubai Commodity Exchange(DME) are likely to be partially used, despite their several weaknesses. It is more advantageous for oil importing countries to have diversified marker crudes that are used in the calculation of export prices by oil producing countries in the Middle East. This is because competition between these oil- producing countries can increase when different prices are applied rather than a single price. Therefore, it is more appropriate for Asian oil importers to discuss issues related to substitution of the marker crude through bilateral negotiations, rather than multilateral, with nations in the Middle East.
6
Table of Contents
Chapter 1. Introduction ···10
Chapter 2. Crude Oil Pricing Methods and Marker Crude Oils ···12
1. Crude Oil Pricing Methods ···12
A. Changes in Crude Oil Pricing Methods ···12
B. Price Formula for Term-Contract Crude Oil ···14
2. Marker Crude Oils by Region (and Market) ···16
A. Types of Crude Oils and Roles of Marker Crude Oils ···16
B. U.S. Market’s Marker Crude Oil: West Texas Intermediate (WTI) ···18
C. European Market’s Marker Crude Oil: Brent···20
D. Asian Market’s Marker Crude Oil: Dubai ···21
3. PRAs ···22
Chapter 3. Volatility of and Correlations Among Marker Crude Oil Prices ···24
1. Overview ···24
2. Volatility of Marker Crude Oil Prices ···24
A. Price Volatility Measurement Model and Results ···24
B. Identification of Structural Changes in Price Volatility ···29
3. Synchronicity Between Prices of Marker Crude Oils ···33
A. Correlation Analysis ···33
B. Cointegration Test ···36
4. Causality Between Prices of Marker Crude Oils ···39
Chapter 4. Problems of the Asian Marker Crude Oil ···41
1. Overview ···41
2. Pricing Method of Dubai Crude Oil ···42
7
A. Priority in Data Use ···42
B. Transactions of Dubai Oil on Platts eWindow ···43
3. Problems with Dubai Oil Price Assessment ···44
A. Opacity of PRAs’ Price-Assessment Process ···44
B. Doubt Regarding the Usefulness of Alternative Deliveries···45
C. Problems with the MOC Methodology ···47
D. Time Lag in Pricing ···48
4. Influence of the Price Distortion of Marker Crude Oils ···49
Chapter 5. Alternative Measures to the Asian Marker Crude Oil ···50
1. Improvement of Price Assessment of PRAs ···50
A. Improvements Made Through G20 Summit Meetings ···50
B. Plans to Increase the Reasonability of Pricing ···52
2. Search for a New Marker Crude Oil ···54
A. Qualifications of Marker Crude Oils ···54
B. Review of New Marker Crude Oils ···55
3. Strategy for Policy Implementation through International Cooperation ···65
Chapter 6. Conclusion ···67
References ···70
8 List of Tables
Table 2-1. Components of Price formula for Term-Contract Crude Oil of Each Region ···15
Table 2-2. Marker Crude Oil Used in Price Formula of Each Exporter ···15
Table 2-3. Properties of Major Marker Crude Oils ···17
Table 2-4. Properties of ASCI Oils ···19
Table 2-5. Properties of BFOE Oils ···20
Table 3-1. Structural Changes in GARCH (1,1)-Based Volatility of Dubai Crude Oil Prices ···31
Table 3-2. Structural Changes in GARCH (1,1)-Based Volatility of Oman Crude Oil Prices ···31
Table 3-3. Results of Dickey-Fuller Unit Root Test ···36
Table 3-4. Results of Johansen Cointegration Test (Entire Period) ···37
Table 3-5. Result of Johansen Cointegration Test (Four Sub-Divided Periods) ···38
Table 3-6. Test of Causality between the Prices of Dubai Oil and Other Marker Crude Oils ···39
Table 4-1. Properties of eWindow Dubai Basket Crude Oils ···46
Table 5-1. SWOT Analysis of ESPO ···58
Table 5-2. Details of Oman Futures Contract ···58
Table 5-3. SWOT Analysis of Oman Crude Oil Futures ···60
Table 5-4. Details of INE Crude Oil Futures···62
Table 5-5. SWOT Analysis of Chinese Crude Oil Futures ···63
Table 5-6. SWOT Analysis of Dated Brent ···64
9 List of Figures
Figure 2-1. Crude Oil Production in Texas and Oklahoma ···18
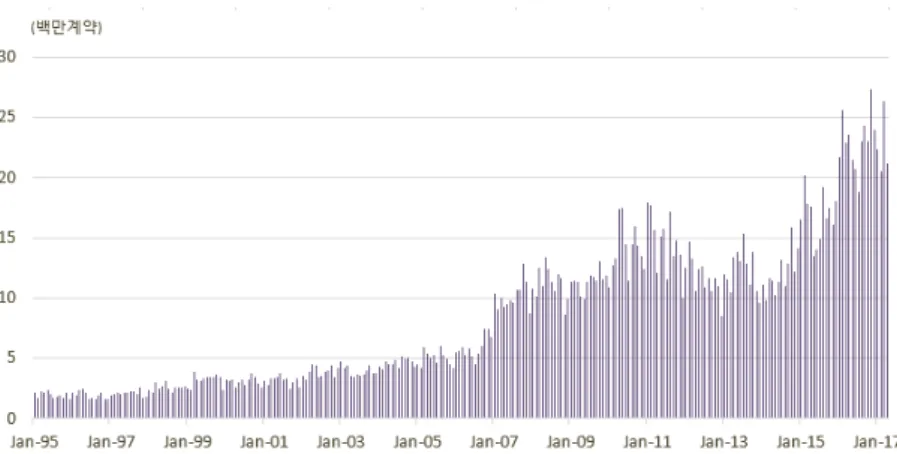
Figure 2-2. WTI Futures Trading Volume Trend on NYMEX ···19
Figure 3-1. Daily Price Volatility of Dubai and Oman Crude Oils ···25
Figure 3-2. Daily Price Volatility of WTI and Brent Crude Oils ···26
Figure 3-3. Price Volatilities of Dubai and Oman Oils Based on GARCH (1,1) Model and Rate of Change ···28
Figure 3-4. Price Volatilities of WTI and Brent Oils Based on GARCH (1,1) Model and Rate of Change ···29
Figure 3-5. Structural Changes in GARCH (1,1)-Based Volatility of Oman Crude Oil Prices···32
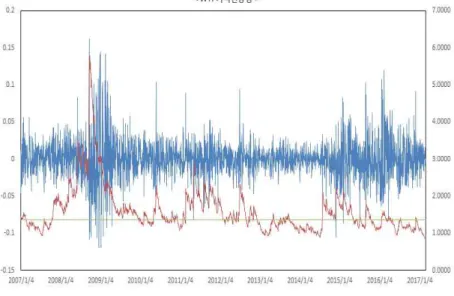
Figure 3-6. Six-Month Rolling Correlation Coefficients of Prices of Dubai Oil and Other Marker Crude Oils ···34
Figure 3-7. Twelve-Month Rolling Correlation Coefficients of Prices of Dubai Oil and Other Marker Crude Oils ···35
Figure 4-1. Change in Dubai Crude Oil Production···41
Figure 4-2. Screen Layout of Platts eWindow ···42
Figure 4-3. Difference in Daily Fluctuations of Brent and Dubai Oil Closing Prices ···48
Figure 5-1. ESPO Pipeline ···56
Figure 5-2. ESPO Crude Oil Exports by Country (2016) ···57
Figure 5-3. Daily Volume of Traded Oman Crude Oil Futures Contracts ···60
Figure 5-4. China’s Dependence on Imported Crude Oil ···61
10
Chapter 1. Introduction
International crude oil prices are determined by supply and demand in the market, as with the prices of general goods. However, this is not the case with various types of crude oil that have different quality levels and are produced and consumed in different areas. Most crude oils, which lack liquidity, are traded at discounted or premium prices based on the price of a “marker crude oil”1 that is actively traded in spot and futures markets.
West Texas Intermediate (WTI) in the United States, Brent Blend in Europe, and Dubai crude in Asia are marker crude oils that serve as standards for determining the prices of crude oils produced in or exported to each of the world’s largest oil-consuming regions.
Since the late 1980s, when the pricing system administered by the Organization of the Petroleum Exporting Countries (OPEC) collapsed, the prices of all crude oils traded on spot, forward, and term contracts have been based on the prices of marker crude oils. Even for crude oils traded over periods of one year or more, only their volumes are fixed, and the prices are calculated based on the price formula linked to the price of the given marker crude oil. The prices of marker crude oils play both direct and indirect roles as reference points in determining the prices of various petroleum products and derivatives, in addition to crude oil prices.
However, Dubai crude, which is the Asian marker crude oil, is not traded in the futures market, unlike other marker crude oils. And with the decreasing production volume and resulting reductions in spot trading, Dubai crude’s price-discovery function has been found to be quite limited. According to the statistics provided by Energy Intelligence (EI), Dubai oil production exceeded 400,000 b/d in the late 1980s, when it began serving as a marker crude oil, before declining to about 100,000 b/d in 2005 and 25,000 b/d in January 2017. Naturally, there is doubt as to whether the price of Dubai crude, with its insignificant production and trade volumes, can serve as a reference.
In addition, the absence of large numbers of buyers and suppliers in the Dubai crude transaction market means that there is a high likelihood that its prices will be manipulated by specific market participants.
Even under these circumstances, Dubai crude continues to function as the Asian marker crude oil because Platts, one of the pricing-reporting agencies (PRAs), evaluates and makes public the price of Dubai crude. However, the lack of transparency in its valuation process and the possibility of price distortion has caused considerable controversy over the appropriateness of PRA-evaluated Dubai crude prices. Distortion of the price of the Asian marker crude oil could lead to a wide range of unreasonable gains and losses. In particular, if the Dubai crude price rises significantly more than other marker crude oils, the prices of Middle East crude oil sold to Asia would rise as well. This, in turn, would lead to increased costs and weaker competitiveness of refineries in the Asian region, including South Korea. It is therefore necessary to analyze the problems of the Asian marker crude oil and present corrective measures.
Despite the importance of marker crude oil prices, it seems that only one study on the issue has been conducted in Korea, jointly by the Ministry of Strategy and Finance and the Korea Energy Economics Institute (2013).
However, this study covers only the “functions of oil PRAs” in relation to the “mitigation of energy price volatility,” which was one of the energy sector agendas of the G20 Summit. That is, instead of addressing the price of the Asian marker crude oil, the study looks at the problems of the overall evaluation process of the PRAs and the improvement efforts made at the G20 level.
This study analyzes the problems of Dubai crude, the Asian marker crude oil, and seeks to identify alternative measures for achieving two goals: improving the current method of assessing the Dubai crude price to prevent price distortions and finding a new marker crude oil capable of replacing Dubai crude. Furthermore, this study suggests strategies for implementing each of the alternatives based on international cooperation.
This study is organized as follows. Chapter 2 examines the role and importance of marker crude oils in determining international oil prices, while Chapter 3 analyzes the volatility of and correlations among the prices of major marker crude oils. The volatility of marker crude oil prices is then estimated using the GARCH (1,1) model, and the correlations among marker crude oil prices are identified by analyzing synchronicity and causality.
1 Marker crude oils, also referred to as reference crude oils and benchmark crude oils, are the standards for determining crude oil prices. In this study, mainly the term “marker crude oil” is used.
11
Synchronicity is examined by estimating the correlation coefficient and conducting the cointegration test, while causality is examined by conducting the grandeur-causality test. Chapter 4 discusses Dubai crude’s lack of liquidity and specific problems related to its price assessment, while Chapter 5 suggests alternative solutions to the problems discussed above. Chapter 5 first suggests measures for enhancing the rationality of the Dubai crude price assessment, which is carried out by PRAs, and then reviews the characteristics and advantages and disadvantages of each of the crude oils that are seen as having the potential to replace Dubai crude in the long term. In addition, the chapter presents strategies for implementing the previously suggested alternative solutions through multilateral and bilateral international cooperation frameworks. Finally, Chapter 6 summarizes the main contents of this study and presents policy proposals.
12
Chapter 2. Crude Oil Pricing Methods and Marker Crude Oils 1. Crude Oil Pricing Methods
A. Changes in Crude Oil Pricing Methods
It has not been long since international crude oil prices started being decided by market forces. If the determination of oil prices by market forces is considered to have started in the late-1980s, when the OPEC- administered pricing system collapsed, the current system has thus been in place for only 30 of the 160 years of the modern oil industry’s history. Prior to that, crude oil prices were determined in a number of different ways.
So far, however, the market’s oil-pricing methods have undergone numerous changes. Considering the continuous controversy over the lack of transparency, information asymmetry, and potential for price distortion under the current oil-pricing methods, it is expected that the international crude oil-pricing methods will continue improving and developing in the future. This chapter aims to examine the changes that have occurred in the international crude oil-pricing methods in order to identify the process through which the marker crude oils, which play an important role in current oil pricing, came into existence.
1) Posted Price System of the Oil Majors (1920s to early 1970s)
The era of the oil majors, often referred to as the “Seven Sisters,”2 began after Standard Oil, founded by J.
Rockefeller, was dissolved into 34 entities in 1911 by the Sherman Antitrust Act. The oil majors are large oil companies with a coherent operating system across all sectors of the industry, spanning exploration, development, transportation, storage, refining, and sales, in the upstream, midstream, and downstream sectors. The governments of the oil-producing countries granted long-term crude oil concessions to the oil majors in exchange for fees.
These fees were determined by the posted prices of the oil majors. As the posted prices were not generated by the market, they lacked transparency and did not properly reflect market conditions. Nonetheless, the system was viewed as having contributed to increasing oil consumption, as the oil majors kept oil prices low so that they could pay less in fees to the governments involved.3
The Achnacarry Agreement of 1928 played a pivotal role in the oil majors’ efforts to dominate the world oil market. The agreement established the first oil cartel,4 through which the oil companies divided the entire world, except the United States, into several regions and assigned oil sales quotas for each. Initially, three companies participated: the Anglo-Persian Oil Company (predecessor of BP), Royal Dutch Shell, and Standard Oil Company (predecessor of Exxon). After the Second World War, four more companies joined, completing the formation of the Seven Sisters. Under the Achnacarry Agreement, oil prices were determined according to a one-base pricing formula, which added shipping costs to the free-on-board (FOB) price of the oil of U.S. Gulf of Mexico.5
In the mid-1950s, the market entry of independent oil companies, which had previously operated only in the upstream sector, created signs of change. These companies acquired oil concessions in Venezuela, Libya, Iran, and Saudi Arabia, targeting the markets dominated by the oil majors, and underwent rapid growth, coming to occupy 15% of Venezuela’s oil production by the mid-1960s.6 However, their share of global crude oil production and trade was insufficient to have a significant effect on the world oil market. With the advent of OPEC, however, the market dominance of the oil majors has weakened, which will be explained in more detail later.
2 This refers to Exxon, Mobil, Texaco, Socal (predecessor of Chevron), Gulf, BP, and Royal Dutch Shell.
3 Energy Charter Secretariat (2007), p.53.
4 Because the Achnacarry Agreement was in violation of the anti-trust law, it did not apply to the United States.
5 Energy Charter Secretariat (2007), p.54. After the Second World War, the price of oil in the Persian Gulf region was also reflected in the price formula.
6 Requoted from Parra, F. (2004) and Fattouh, B. (2011), p.15.
13 2) OPEC-administered Pricing System (Early 1970s to 1986)
The Organization of the Petroleum Exporting Countries (OPEC) was established in September 1960 as an intergovernmental organization in response to the oil majors’ price (posted price) reduction.7 Initially, it concentrated on protecting the interests of its member states against the oil majors. Since the mid-1960s, however, with the dramatic increase in global oil demand, it began taking control of its member states’ oil industries by excluding the oil majors.
Fattouh (2011) views the 1970 agreement between Libya and Occidental, one of the independent oil companies, as a turning point in OPEC’s efforts to take control of the oil major’s international oil market dominance. At the time, Libya agreed with Occidental regarding the payment of income taxes based on the increased posted price and a retroactive payment to compensate for lost revenue since 1965. The contract was soon applied to all oil companies operating in Libya and spread to other Middle Eastern oil-producing countries as well.
In addition, OPEC pursued the nationalization of oil companies. Instead of granting oil concessions to Western oil companies, it began engaging them as shareholders. In October 1972, after a series of negotiations, six Middle Eastern OPEC members and Western oil companies agreed on a 25% equity participation agreement (which later increased to 51% in 1983). Afterward, Iraq, Kuwait, and Qatar expelled Western oil companies and nationalized their oil industries.8
OPEC, which achieved a hegemony in the international oil market, replaced the posted price system with the administered pricing system. This new system was centered on the concept of a marker crude oil. Individual oil- producing countries determined the official selling price (OSP) in consideration of supply and demand, crude oil quality, and petroleum product prices, with Arabian Light of Saudi Arabia as a reference.
Amid this change, the first oil crisis was a crucial event that gave OPEC the opportunity to become an oil powerhouse. In October 1973, six Middle Eastern OPEC member states raised the posted price of Arabian Light from USD 3.65 per barrel to USD 5.119 per barrel while announcing a production cut of 5% and a further cut of 5% per month until the total evacuation of Israeli forces from all Arab territories.9 In December of that year, the price was raised further to USD 11.651 per barrel.10 Although these measures seemed to have been taken in retaliation for the Third Middle East War, they were in fact a response to the breakdown in price negotiations with Western oil companies. In this way, OPEC replaced the oil majors and came to power in the international oil market.
The second oil crisis, from 1979 to 1980, once again reinforced the status of OPEC, but ultimately, it was the beginning of OPEC’s decline and fragmentation and the collapse of the OPEC-administered pricing system. The price of Saudi Arabia’s Arabian Light soared from USD 14 per barrel in early 1979 to USD 26 per barrel by the end of the year and reached a record high of USD 30 per barrel in April the following year.11
OPEC’s market share shrank dramatically, from 51% in 1973 to 28% in 1985, as non-OPEC oil producers emerged as a strong competitor amid the sharp decline in oil demand and subsequent global economic recession.12 The production quota system that had been introduced in 1982 to prevent a fall in oil prices was ineffective due to the observation-related failures of most of the member countries, except Saudi Arabia. In addition, the disagreements among member countries concerning oil prices and production drastically weakened the market influence of OPEC. Under these circumstances, Saudi Arabia introduced the netback-pricing method13 to replace the existing OPEC-administered pricing system in 1986 and started increasing production, which led to a dramatic
7 Iran, Iraq, Kuwait, Saudi Arabia, and Venezuela are the founding members. In 2017, more countries—Algeria, Angola, Ecuador, Gabon, Libya, Nigeria, Qatar, the UAE, and Equatorial Guinea—joined, adding up to 14 members.
8 Fattouh (2011), p.16.
9 Fattouh (2011), p.16.
10 Fattouh (2011), p.16.
11 Bloomberg’s time-series data on international crude oil prices (www.bloomberg.com (retrieved March 25, 2017)).
12 Fattouh (2011), p.18.
13 The netback-pricing method inversely calculates crude oil price by subtracting the refining, transportation, and other costs.
In this way, the market risk is shifted from the refiner to the producer.
14
fall in international oil prices. The price of Arabian Light declined to USD 8.6 per barrel in July 1986 from USD 28 per barrel in December 1985,14 resulting in the collapse of the OPEC-administered pricing system and the emergence of a market-related pricing system.
3) Market-related Pricing System (1987- today)
Paradoxically, the crude oil spot trading market was created in the wake of the first and second oil crises, at a time when the influence of OPEC was growing rapidly. As the OPEC embargo and Iranian Revolution increased the difficulty of securing crude oil through term contracts, buyers crowded into spot markets. At the same time, non-OPEC oil production in the North Sea regions increased sharply. These circumstances led to a dramatic rise in crude oil spot trading. According to the estimation of the 2007 Energy Charter Secretariat, the share of spot trading in the oil market expanded from 5 to 8% in the 1970s to 10 to 15% in the mid-1970s and further to 40 to 50% in the mid-1980s.
Given that the spot market handles any excess supply and demand that was not met through term contracts, the trend of spot trading growth well illustrated the market conditions of those years. The prices generated in the spot market serve as an important indicator of oil price determination. Since the collapse of the OPEC-administered pricing system, international oil prices have been decided using a market-related method that reflects the prices generated in the spot market. However, as not all of the hundreds of types of crude oils worldwide are traded on the market, the price of any given type is usually set at a discount or a premium in relation to a marker crude oil representing the given region. This is referred to as the market-related formula pricing system. The premium and discount rates are determined by the state-owned oil company of the given oil-producing country or a PRA, in consideration of the quality of the crude oil, value of petroleum products, export area, and market conditions.
Today, oil prices are typically set by this method. However, since the oil market is segmented into the real and derivative markets, market participants are divided into end users, suppliers, and financial investors, and the oil price-determination method has become much more complex. After the futures trading market was vitalized through the New York Mercantile Exchange (NYMEX), futures prices came to represent international oil prices, holding sway over spot prices.
B. Price Formula for Term-Contract Crude Oil
Since the late 1980s, when the OPEC-administered pricing system collapsed, the prices of all crude oils traded on spot, forward, and term contracts have been based on the prices of marker crude oils. Crude oils traded over periods of one year or more are fixed only in terms of their volume, and prices are calculated by applying the regional (market) price formula15 related to the price of the given marker crude oil.
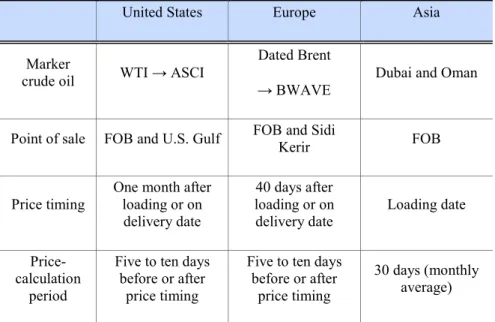
Basically, the price formula involves adding or subtracting adjustment factors to or from the prices of the regional marker oils, as shown in the following equation. However, the point of sale, price timing, and calculation period of marker crude oil prices depend on the exporting country or sales area of the crude oil (United States, Europe, or Asia).
Pij = PMj ± ij (P: sale price of crude oil, PM: price of marker crude oil, : adjustment factor, i: type of crude oil, and j: sales area)
The representative marker crude oils are WTI (West Texas Intermediate) in the U.S. market, Brent in the European market, and Dubai in the Asian market. In addition, the Argus Sour Crude Index (ASCI), West Texas
14 Bloomberg’s time-series data on international crude oil prices (www.bloomberg.com (retrieved March 25, 2017)).
15 The market price formula was adopted by PEMEX, Mexico’s national oil company, in 1986 and has been the most commonly used pricing method to date (Fattouh (2011), p.20).
15
Sour (WTS), Brent weighted average (BWAVE), and prices of Oman crude oil and other petroleum products are used as marker prices as well (refer to Tables 2-1 and 2-2). The marker crude oil of each market will be described in more detail in Section 2 of Chapter 2.
The adjustment factors are determined in consideration of the quality of the crude oil, value of the petroleum products produced from the crude oil, market conditions, and sales strategy. Major oil exporters, including Saudi Arabia, usually announce adjustment factors early in the month for application in the following month.16
Table 2-1. Components of Price Formula for Term-Contract Crude Oil of Each Region
United States Europe Asia
Marker
crude oil WTI → ASCI
Dated Brent
→ BWAVE
Dubai and Oman
Point of sale FOB and U.S. Gulf FOB and Sidi
Kerir FOB
Price timing
One month after loading or on delivery date
40 days after loading or on delivery date
Loading date
Price- calculation
period
Five to ten days before or after
price timing
Five to ten days before or after
price timing
30 days (monthly average)
Noted: Based on Saudi Arabia crude oil (BWAVE, Brent weighted average; WTI, West Texas Intermediate; and ASCI, Argus Sour Crude Index).
Source: Dalseok Lee & Namjin Roh (2010), p.79; and Energy Intelligence (February 13, 2017), p.4.
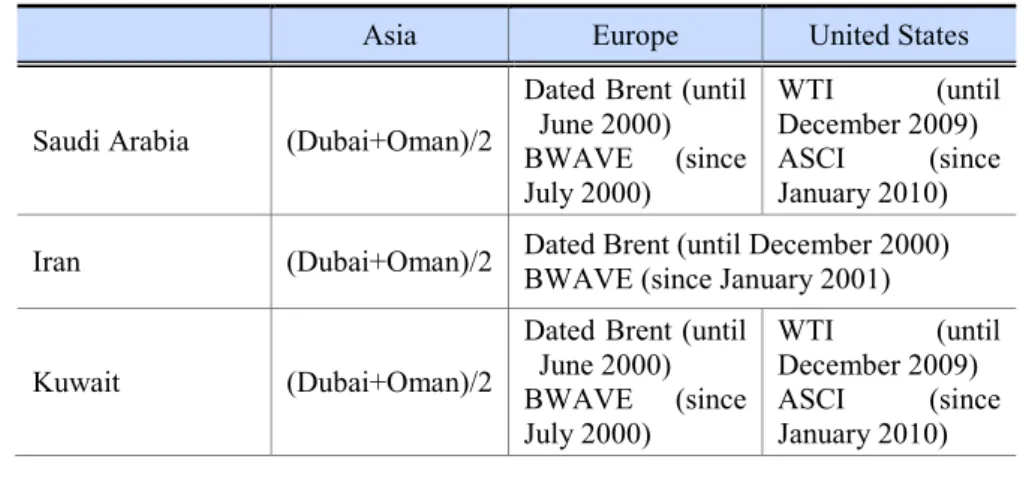
Table 2-2. Marker Crude Oil Used in Price Formula of Each Exporter
Asia Europe United States
Saudi Arabia (Dubai+Oman)/2
Dated Brent (until June 2000) BWAVE (since July 2000)
WTI (until
December 2009) ASCI (since January 2010) Iran (Dubai+Oman)/2 Dated Brent (until December 2000)
BWAVE (since January 2001)
Kuwait (Dubai+Oman)/2
Dated Brent (until June 2000) BWAVE (since July 2000)
WTI (until
December 2009) ASCI (since January 2010)
16 These adjustments, which are set by the crude oil exporters, are also referred to as the OSP, based on the term “Official Selling Price (OSP)” used for the past OPEC-administered pricing system.
16
Iraq (Dubai+Oman)/2 Dated Brent
WTI (until March 2010)
ASCI (since April 2010)
Nigeria Dated Brent
Libya Dated Brent
Mexico (Maya-
22) (Dubai+Oman)/2
(Dated Brent⨯0.527) +
(3.5%FO⨯0.467) - (0.25⨯
(1%FO- 3.5%FO)))
(0.4⨯
(WTS+3%FO)) + (0.1⨯ (LLS+
Dated Brent)) Ecuador (Oriente-
24) WTI
Note: BWAVE, Brent weighted average; WTI, West Texas Intermediate; ASCI, Argus Sour Crude Index; WTS, West Texas Sour; LLS, Light Louisiana Sweet; and FO, Fuel Oil.
Source: excerpted and summarized from Energy Intelligence (February 13, 2017), p.4.
Using marker crude oil prices as a reference avoids the risk of sudden price fluctuations on specific days or at specific points in time by applying the average for a certain period.17 As for marker crude oil price calculations, the average market price over 5 to 10 days is usually applied to crude oil bound for the European and U.S. markets, which are sensitive to market conditions, and the monthly average price for the given shipment month is applied to that bound for Asia. Price timing is set based on the day of shipment, a certain time after the shipment, or the day of delivery. This is done to reduce the risk imposed on buyers by price fluctuations that could occur during the time the oil is being shipped to the refiner.18 For example, it takes about 42 days to travel from Ras Tanura Port of Saudi Arabia, around the Cape of Good Hope, and to Corpus Port of Texas, in the United States. Therefore, among the components of the price formula, the calculation period and price timing ofthe marker crude oil take market risk into consideration.
2. Marker Crude Oils by Region (and Market)
A. Types of Crude Oils and Roles of Marker Crude Oils
Crude oil is an organic material composed of oxygen, sulfur, nitrogen, and helium, in addition to its main components of carbon and hydrogen. There are hundreds of crude oils of different levels of quality around the world, each of which is usually named based on the region in which it is produced. Crude oils are divided into light, medium, and heavy oils, according to their density, and sweet and sour crude oils, according to their sulfur content. The density of a crude oil can be gauged by its specific gravity, which is calculated using the API gravity formula of the American Petroleum Association. The API gravity formula provides the specific gravity of crude oil at a temperature of 60℉ (15.6℃) compared to water at the same temperature.19 Light crude oil has an API of 31.1 or higher; medium oil, 22.3 to 31.1; heavy oil, 22.3 or less; and extra heavy, 10.0 or less.20 As for the sulfur content, crude oil with a sulfur content of 0.5% or less is classified as sweet (low-sulfur) crude oil, while crude
17 Descriptions of the marker crude oil price calculation period and price timing are extracted from the paper by Dalseok Lee and Namjin Roh (2010), pp.77-78.
18 Energy Intelligence Research (2009), p. A60 / Requoted from Dalseok Lee and Namjin Roh (2010), p.78
19 Water has an API gravity of 10.
20 http://www.petroleum.co.uk/api (retrieved April 14, 2017).
17
oil with a sulfur content of more than 0.5% is classified as sour (high-sulfur) crude oil.21,22
Generally, crude oil with higher API gravity and lower sulfur content is more expensive. Because light crude oil is relatively simple to refine, it can be used to produce petroleum products with high value added such as gasoline. In addition, sweet crude oil requires relatively fewer desulfurization processes. Heavy crude oil, which is also called “tar sand,” is considered to be of low quality due to its high sulfur content and nickel and other metal components, which is why it is used to produce low value-added products such as Bunker-C oil. However, as it is cheaper, refineries have been steadily upgrading their facilities in order to reprocess Bunker C oil into gasoline and other higher value-added products.
As such, crude oils have a wide variety of physical properties, and production costs and demand vary widely by region. In addition, not all crude oils are traded in volumes sufficient to enable market price formation.
Therefore, it is reasonable that the price of an individual crude oil is determined based on a specific crude oil or marker crude oil with abundant liquidity and relatively transparent pricing.
Accordingly, international oil prices have been determined based on the prices of marker crude oils. For a long time, from the oil majors to OPEC, U.S. West Texas crude and Saudi Arabia’s Arabian Light served as markers.
Since the mid-1980s, WTI, Brent, and Dubai have been the representative markers for the U.S., European, and Asian markets, respectively. In addition to these three types, Light Louisiana Sweet (United States), Ural (Russia), Tapis (Malaysia), Minas (Indonesia), Bonny Light (Nigeria), and Isthmus Light (Mexico) also play the role of marker crude oils in limited areas and scopes. The formula for determining the prices of term-contract crude oils includes Oman (Oman) along with Mars, Poseidon, and Southern Green Canyon, all of which make up the Argus Sour Crude Index (ASCI), which will be explained more in detail later.
The price of an individual crude oil is generally calculated by adding or subtracting the price differential specified by the exporter or PRA to or from the price of the given marker crude oil. The price differential is determined in consideration of the quality of the crude oil, shipping cost, value of refined petroleum products, and market conditions. As we have seen before, oil-producing countries use different marker crude oils, depending on the export region (market), even for the same crude oil.
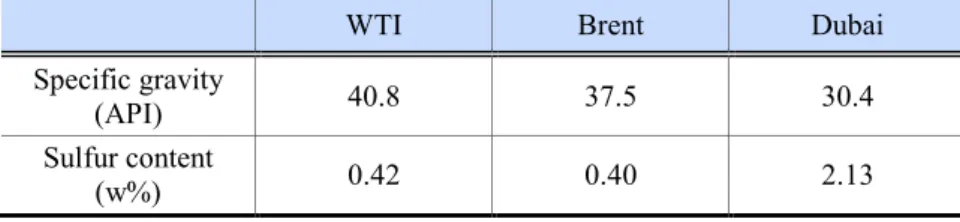
Table 2-3. Properties of Major Marker Crude Oils
WTI Brent Dubai
Specific gravity
(API) 40.8 37.5 30.4
Sulfur content
(w%) 0.42 0.40 2.13
Source: Energy Intelligence (2015).
B. U.S. Market’s Marker Crude Oil: West Texas Intermediate (WTI)
WTI, the marker crude oil of the U.S. market, is a low-sulfur light oil with an API of 40.8 and a sulfur content
21 http://www.petroleum.co.uk/sweet-vs-sour (retrieved April 14, 2017).
22 The U.S. Environmental Protection Agency (EPA) classifies crude oils into four categories (Class A to D) depending on the degree of toxicity to humans and the environment. Class A is a light, volatile, liquid oil that easily penetrates into the soil, groundwater, and ocean water. In addition, due to its strong odor and rapid evaporation, light oil is generally more harmful to humans and the environment than others. Class B is non-sticky oil that is less toxic than Class A and easily absorbed into the soil at higher temperatures, making it difficult to remove. Class C is heavy sticky oil that is not easily absorbed into the soil due to its stickiness and is less toxic than the two preceding oils. However, it is very difficult to remove, and because of its low specific gravity, it can endanger marine ecosystems when it sinks down into the water. Class D is non-fluid oil that is not absorbed into the soil and is the least toxic of the four categories of oil. This oil is dissolved by heating and includes residual oils and bitumen (www.epa.gov/emergency-response/types-crude-oil (retrieved April 14, 2017).
18
of 0.42w% (Table 2-3) that is produced in Texas, New Mexico, Oklahoma, and Kansas. As the most widely recognized crude oil in the global oil market, WTI has long served as a reference for the prices of crude oils imported into the United States, the world’s largest oil consumer. In addition, WTI influences the pricing of local U.S. marker crude oils, such as Louisiana Light Sweet (LLS), Mars, Poseidon, and Southern Green Canyon.
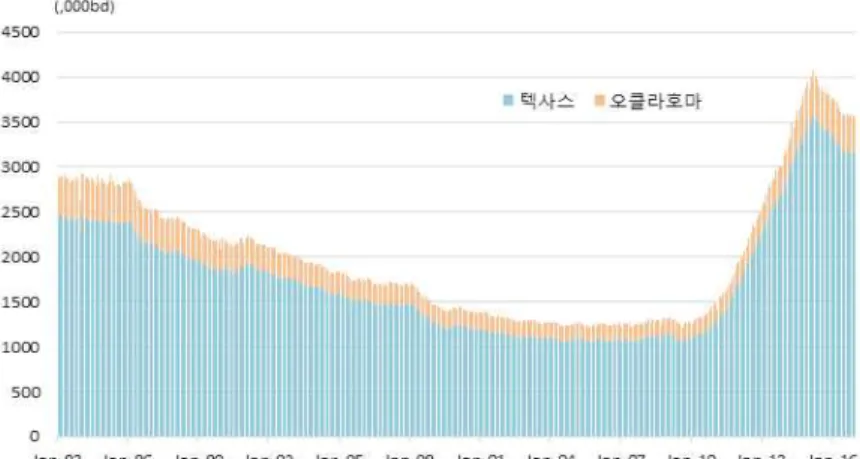
Figure 2-1. Crude Oil Production in Texas and Oklahoma
Source: EIA (https://www.eia.gov/petroleum/ (retreived April 1, 2017).
원문 번역문
텍사스 오클라호마
Texas Oklahoma
WTI emerged as a global marker crude oil following a series of incidents, including the commencement of crude oil futures trading in 1983. Considering WTI’s advantage of being produced in the center of the world’s largest oil industry (United States) and the rapid development of the spot market, WTI has an important influence on the price formation of various crude oils.
WTI has come to secure a solid position, owing to the vitalization of futures trading. A low-sulfur, light crude oil futures contract was launched with WTI as an underlying asset on NYMEX in March 1983. It is a representative crude oil futures contract that adopts a physical delivery settlement method23 and has contributed to the development of the international crude oil market with its price-discovery and risk-transfer functions. In particular, as the crude oil futures market became financialized in the 2000s, a large number of financial investors, in addition to end users and suppliers, became increasingly involved, which significantly enhanced the transparency and efficiency of pricing.
Figure 2-2. WTI Futures Trading Volume Trend on NYMEX
23 The physical delivery settlement location is Cushing, Oklahoma. It is possible to deliver other crude oils of similar quality, such as Low Sweet Mix, New Mexican Sweet, and North Texas Sweet, as well as imported crude oils, such as the United Kingdom’s Brent, Nigeria’s Bonny Light, and Colombia’s Cusiana (http://www.cmegroup.com (retrieved April 1, 2017)).
19
Source: Bloomberg (https://www.bloomberg.com (retrieved April 1, 2017)).
원문 번역문
백만계약 One million contracts
Meanwhile, some have taken a critical view toward WTI as a marker crude oil. WTI prices have long been underestimated compared not only to Brent, a light oil, but also to Dubai, a medium oil, due to the excessive overstock caused by the increase in shale oil production. WTI also has difficulty fulfilling its role as a marker crude because it does not properly reflect the supply and demand situation in the United States and the global market. Although the ban on U.S. crude oil exports was abolished in 2016, the shortage of export infrastructure restricts WTI’s capacity to respond to any excess or shortage in supply and demand in the global market. In addition, since WTI crude oil is transported mainly through pipelines, transactions are limited, and bottlenecks occur frequently. Moreover, as a result of excessive speculative trading through the futures market, volatility in oil prices has increased dramatically, and the sharp fluctuations in oil prices cannot be explained by changes in supply and demand only.
Since WTI prices lost stability with the dramatic declines that occurred due to the surge in U.S. shale oil production, oil-producing countries in the Middle East have been using ASCI as a substitute for WTI in their formula for calculating the price of crude oil for export to the United States. ASCI is a weighted-average price for the three medium sour oils—Mars, Poseidon, and Southern Green Canyon—and has been compiled and announced since May 2009 by Argus, one of the PRAs. At the end of 2009, a futures contract with ASCI as an underlying asset was launched on the InterContinental Exchange (ICE). As transactions of medium sour oil increased in the U.S. Gulf of Mexico, the oil-producing countries in the Middle East, including Saudi Arabia, chose ASCI as an alternative to WTI. Though ASCI has emerged as a reference for medium oils, it is difficult to see it as an independent marker crude oil, as its prices are basically formed based on WTI. And WTI is still widely performing the role and function of a marker crude oil.
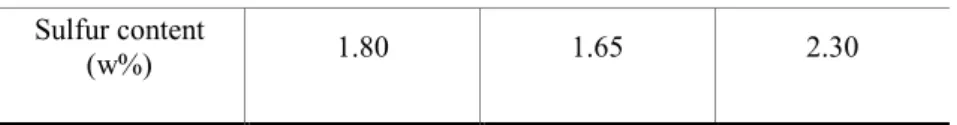
Table 2-4. Properties of ASCI Oils
Mars Poseidon Southern Green
Canyon Specific gravity
(API) 28.8 29.7 28.2
20 Sulfur content
(w%) 1.80 1.65 2.30
Source: Energy Intelligence (2015).
C. European Market’s Marker Crude Oil: Brent
Brent, the European market’s marker crude oil, is a light sweet oil with an API of 37.5 and sulfur content of 0.40w% (Table 2-3) that is produced in the North Sea. Though its quality is similar to that of WTI, it serves as a reference for many more varieties and volumes of oil. According to ICE, 70% of crude oil transactions worldwide are directly or indirectly affected by Brent prices.24 Brent has covered a wider range of oil types and regions than WTI, thanks to factors such as a tax system favorable to spot transactions and competitive production system. The main reason, however, is that Brent is produced by offshore oilfields. Crude oils that are produced by offshore oilfields and transported by ship can be used to make swift responses to any excesses or shortages in regional markets and are inexpensive because they can be shipped in large volumes. Crude oils produced on land are difficult to transport to areas with the proper transportation infrastructure, such as oil pipelines and railroads, which limits their capacity to reflect the overall market supply and demand. The construction of oil pipelines is costly, and railroad transportation is expensive as well. Such factors hinder the competitiveness of crude oils produced by land-based oilfields.
Brent was first discovered in the Brent oil field in the North Sea in the 1960s, and its production expanded continuously until the mid-1980s. After Brent production entered a rapid decline, however, its position as a marker crude oil was weakened.25 To solve this problem, the PRAs added Forties and Oseberg in 2002 and Ekofisk in 2007 to the Brent crude group as deliverables.26 Thus, Brent is also called BFOE, which is a combination of the first letter of each newly included variety. However, as the lack of liquidity caused by declining production has not been resolved, many have suggested that new measures should be put in place. To increase the liquidity of Brent, the PRAs decided to add Norwegian Troll to the Brent benchmark basket from January 2018.27
Table 2-5. Properties of BFOE Oils
Brent Forties Oseberg Ekofisk Troll Specific
gravity (API) 37.5 38.7 38.5 38.5 35.9
Sulfur
content (w%) 0.40 0.79 0.24 0.19 0.15
Source: Energy Intelligence (http://www.energyintel.com)
Brent pricing is more complicated than that of WTI, because its pricing comprehensively reflects the prices in the spot, forward, and futures markets. First, the price of Brent in the spot market, which is referred to as Dated Brent, is most commonly applied to physical transactions. Although it is a spot transaction, it has the nature of a forward transaction, as it usually takes about 10 to 25 days to ship the crude oil after the contract is signed.
24 ICE (2011), p.14.
25 Brent production decreased from 885,000 b/d in 1986 to 366,000 b/d in 1990 (Horsnell and Mabro, 1993).
26 Bossely (2017), p.3.
27 HIS (2017), p.3.
21
Accordingly, the PRAs evaluate the Dated Brent prices on the basis of the forward price.
Forward Brent, also referred to as 25-day Brent, specifies the delivery month but not the particular delivery date. The term “25-day” indicates that the buyer will be notified of the delivery date 25 days in advance. Forward Brent takes longer to deliver than Dated Brent. Typically, three-month forward transactions are common, and the PRAs evaluate prices accordingly. Forward prices are reflected in Dated Brent prices through contract-for- difference (CFD),28 which is a kind of short-term swap.
Brent futures prices resolve the price distortion problems caused by the lack of liquidity in forward trading.
Brent futures, which were launched by the International Petroleum Exchange (IPE, now ICE) in the 1980s, became the world’s largest futures, along with WTI futures, on NYMEX when its trading volume and open interests underwent significant growth in the 2000s. Brent futures are basically cash settled. But, with agreement between the parties involved, exchange for physicals (EEP) is also possible, and EEP is reflected in Forward Brent pricing along with Brent futures.
As mentioned above, Dated Brent prices are generally applied to spot transactions. More recently, however, prices of Brent futures with high transparency and liquidity have been used as a reference more frequently. For the crude oils exported from Middle Eastern countries, such as Saudi Arabia and Kuwait, to Europe, BWAVE, the weighted-average price calculated based on trade volumes, is used. BWAVE is calculated by applying weighted averaging to the price of nearby-month contracts traded on ICE and the volume of month contracts traded on the day.
Meanwhile, Russia’s Urals was listed on the St. Petersburg International Mercantile Exchange (SPIMEX) in November 2016, creating the expectation that pricing transparency would improve and transaction volumes would increase.29 Some predict that Urals may be emerging as a new marker crude for Europe, replacing Brent. The Russian government is also making efforts to have its Urals crowned as an international marker. However, Urals crude oil has too many demerits to be a marker crude, including the fact that its production is controlled by state- owned enterprises.
D. Asian Market’s Marker Crude Oil: Dubai
Dubai, the Asian market’s marker crude oil, is a medium sour oil with an API of 30.4 and sulfur content of 2.13w% (Table 2-3). It is produced in the Fateh oilfield in Dubai, one of the seven emirates of the United Arab Emirates (UAE). The Fateh oilfield is an offshore oilfield located about 60 miles from Dubai that was discovered in 1966 and began production in 1969. The production of Dubai oil has increased rapidly with the establishment of more oilfields in South West Fateh in 1970, Falah in 1972, and Rashid in 1973. The Fateh and South West Fateh oilfields were classified as “giant” oilfields when their cumulative production exceeded 2 billion barrels in 1988.30
Dubai crude oil has been used as an Asian marker crude oil since the mid-1980s. Since the trading of Arabian Light, the marker crude at the time, in the spot market was suspended, Dubai oil, which was one of the few spot- tradable oils in the Middle East, naturally attracted attention. And as more Japanese brokers and U.S. oil refineries have participated in Dubai oil transactions, its liquidity has increased as well. When OPEC abandoned its administered-pricing system and decided to set the price of crude oil exported to Asia based on Dubai oil in 1988, Dubai crude oil became the “Brent of the East.”31 Most of the sour oils traded in the eastern Suez region, the crude oils sold by several state-owned oil companies in the Middle East, and Russia’s Sokol, Sakhalin Blend, and
28 CFDs are swap contract that exchanges the prices of Dated Brent (variable) and forward Brent (fixed).
29 Energy Intelligence (November 21, 2016), p.6. (Urals has an API of 31.7 and sulfur content of 1.35w% (Energy Intelligence, 2015)).
30 Dubai Petroleum Establishment (http://www.dubaipetroleum.ae/timeline.php (retrieved Apr. 15, 2017)).
31 Requoted from Horsnell and Mabro (1993) and Fattouh (2011), p.61.
22 ESPO have all adopted Dubai oil as their marker.32
Unlike WTI and Brent, Dubai oil is not traded on the futures market. In the early 1990s, attempts were made to launch Dubai crude oil futures in London and Singapore, but they resulted in failure. Dubai futures on the Tokyo Commodity Exchange (TOCOM), which began in 2001, went only as far as local crude futures, as their trade details, such as units and currencies, are different from the global standard. Dubai Crude Oil Financial Futures traded on NYMEX and Dubai 1st Line Futures listed on ICE are different from WTI futures and Brent futures in terms of price formation and settlement type.33
Over-the-counter (OTC) Dubai is traded relatively actively, particularly with Brent/Dubai Exchange of Futures for Swaps (EFS) and Dubai inter-month swaps. Brent/Dubai EFS is a differential between the Dubai oil price and ICE Brent futures price, allowing market participants to hedge their risks against Dubai oil prices. Dubai inter- month swaps are the differentials between two swaps with different delivery months and are thus used by market participants to hedge their positions from one month to the next. Dubai inter-month swaps are actively traded in London and Singapore and, coupled with Brent/Dubai EFS, have a significant influence on the pricing of Dubai crude oil.34
Although the Dubai OTC trade volume is not officially compiled, Fattouh (2011) estimated that the Brent/Dubai EFS trade volume ranged from 1,000 to 2,000 contracts (1 to 2 million barrels) a day, and that the Dubai inter- month swap was 2,000 contracts (2 million barrels) a day. OTC participants encompass a variety of entities, including Asian refineries, global investment banks such as JP Morgan, other international oil companies such as BP, and brokers such as Vitol.
On the other hand, as discussed in the section about the formula for calculating the term-contract prices of crude oil, the average prices of Dubai and Oman crude oils are used as a reference for the term-contract sales prices of Middle Eastern oil-producing countries. The average prices of Dubai and Oman crude oils began to be used as a reference to solve the liquidity problem that was caused by the sharp decline in Dubai oil production after the mid-1990s. This measure was taken because international oil companies such as Royal Dutch Shell owned shares in the Petroleum Development Oman (PDO) and other state-owned companies of Oman, which is not a member country of OPEC, and produced and sold Oman oil to the spot market themselves. Although Oman crude oil prices are used in the formula for calculating term-contract prices, Oman oil is not accepted as an independent marker oil because its spot price in the past was traded based on the differential between and the official selling price of Dubai crude (OSP) that the government retroactively applied. Currently, it is known that the spot price of Oman oil is based on Oman Crude Oil Futures, which have been traded on the Dubai Mercantile Exchange (DME) since 2007.
3. PRAs
A price-reporting agency (PRA) is a private entity that collects information on various types of transactions in the international oil market and evaluates and announces spot prices, petroleum product prices, and derivative prices of crude oils, including marker crude oils.35 It is difficult to standardize the prices of crude oils because of the various physical characteristics and trading methods involved. In particular, crude oils and petroleum products differ in price depending on their physical characteristics, such as their sulfur content, specific gravity, boiling point, viscosity, and impurity content, as well as transportation method and time of delivery. Also, crude oil
32 Platts (2015), “FAQ: Dubai Crude.”
33 The Dubai futures on NYMEX and ICE are settled in cash based on Platts prices.
34 For example, when Asian demand increases, the EFS price declines and the Brent and Dubai oil price differential narrows.
Traders view this price decline as a signal suggesting the strength of Dubai oil. Argus refers to the EFS prices for its Dubai oil price estimation.
35 The PRAs generally valuate and announce the prices of low-liquidity products. They are active in various fields, including oil, metals, agricultural products, petrochemical products, and transportation, with each field having several PRAs. Platts and Argus Media are two of the largest PRAs, as they are active in almost every field.
23
transactions are carried out in the form of face-to-face deals.36 These factors led to the emergence of PRAs, which estimate market prices by collecting and analyzing information on crude oil and petroleum product trades.
The prices of crude oil and petroleum products valuated by PRAs are used as references in various oil transactions, and thus have a great influence on the market. Since the PRAs’ valuated prices serve as references for huge volumes of oils traded in term-contract, spot, and derivates transactions, even a small price difference may have a profound effect on the profits and losses of buyers and sellers. Furthermore, the timing and method of pricing and announcement also influence the strategies of market participants. For example, participants may create new contracts and new markets as means of hedging against the risks arising from the pricing of the PRAs.
Therefore, although the PRAs only perform the task of valuating the prices of oil, a product that lacks liquidity, the role they play is far more significant than that of a simple observer in the oil market.
Platts, Argus Media, APPI, and ICIS are the representative PRAs that evaluate and disclose oil prices, but Platts holds a monopolistic position with a market share of 80%.37 Platts valuates the price of Dubai oil, which is the Asian marker crude oil.
Each PRA has its own methodology that underlies pricing, meaning that it is possible for different prices to be calculated and announced for the same subject. The PRAs understand oil prices in a variety of ways, such as the weighted average of trade volume, high- and low-price method, and market-on-close (MOC, or closing price).
Platts and Argus Media, the two giant oil PRAs, use the MOC method and volume weighted-average method, respectively (Platts, 2017, and Argus, 2015).
In its MOC method, Platts sets a time range in the Platts eWindow and valuates the price based on the transactions carried out in this range. The price assessment uses not only the prices of concluded transactions but also bids and offers of non-concluded transactions. It also uses the spread of other products and information on the derivatives market to help with the price assessment. As such, eWindow is a system by which Platts collects information to serve as evidence for valuating the daily prices of major markers. The eWindow system is similar to the futures exchange system, where traders make bids and offers, but it is different in two major ways: the parties behind the bids and offers are known, and Platts decides what information is to be considered in the valuation.
The volume weighted-average method involves taking the weighted average of transactions occurring at a certain point in time, usually just before the close of trading, based on volume. However, both the volume weighted-average and MOC methods have advantages and disadvantages. The volume weighted-average method takes a number of deals into account and is thus more representative, but it is criticized for possibly not reflecting the actual market price prevailing at the close of the day. This would be the case especially on days with high volatility. On the contrary, the MOC method effectively reflects the actual market price at the time of market closing, but it is highly likely to result in distorted prices if there are unusual transactions at that time.
The transparency and accuracy of the price assessments of the oil PRAs have been given great importance in relation to “oil volatility mitigation,” which was one of the agendas of the G-20 Summit for the 2010-2013 period.
The details and problems of the price-assessment method for Dubai oil, the Asian marker crude oil, will be discussed in more detail in Chapter 4.
36 Ministry of Strategy and Finance and the Korea Energy Economics Institute (2013), p.68.
37 http://www.blplaw.com/expert-legal-insights/articles/benchmark-manipulation-price- oil-spotlight (retrieved Apr. 20, 2017).
24
Chapter 3. Volatility of and Correlations Among Marker Crude Oil Prices 1. Overview
The prices of marker crude oils, which represent the major oil-consuming regions (as in Chapter 2), serve as a reference for the trading of crude oils and petroleum products. Although the prices of these regionally divided marker crude oils reflect the characteristics of each regional market, there are some interdependencies with the prices of offshore marker crude oils. In this section, the price volatilities of marker crude oils are compared, and the correlations among them (synchronicity and causality) are empirically analyzed to identify the interdependence of the marker crude oils. The subjects of analysis are the WTI, Brent, Dubai, and Oman crude oils. Though Oman oil is not recognized as an independent marker crude oil, as mentioned above, it is included in the analysis because it is used in the formula to calculate the selling prices of crude oil under term contracts in Asia. The price data used for the analysis are the daily spot prices from January 1, 2007 to December 30, 2016.
To measure price volatility, most existing studies use the simple price change rate or standard deviation. This study, however, uses the GARCH (1,1) model, which is often used to measure the volatility of financial asset prices in order to identify the volatility of marker crude oil prices. The GARCH (1,1) model weighs the historical residual values and variation values of the time-series data of marker crude oil prices, unlike the standard deviation, which has one constant value during the target period. After measuring the volatility of individual marker crude oil prices using the GARCH (1,1) model, this paper analyzes whether the price volatilities so measured show any structural changes over time using the Bai-Perron model.
Previous studies on the synchronicity of marker oil prices have presented different results. Since Adelman (1984) suggested the “one great pool hypothesis,” many researchers have supported the argument that regional marker crude oil prices have inter-synchronicity.38 The “one great pool hypothesis” says that, although there are quality differences and regional segregations among the marker oils, there are no significant price differences that will lead to profits from arbitrage. On the other hand, Weiner (1991) argued that the global oil market was localized, while Hammoudeh and Yuan (2008) argued that the four marker crude oils (WTI, Brent, Dubai, and Maya) are not in a long-term equilibrium relationship.
This study examines whether there is synchronicity between marker crude oil prices by estimating the rolling correlation coefficient and looks into whether the synchronicity changes over time. It also identifies whether a long-term equilibrium relationship exists between marker crude oil prices through a co-integration test. The co- integration test is conducted over both the entire target period and the four divided periods. Finally, causality between marker crude oil prices is analyzed by performing a grandeur-causality test.
2. Volatility of Marker Crude Oil Prices
A. Price Volatility Measurement Model and Results
There are various statistical methods for measuring price volatility, which is the degree to which prices fluctuate.
In existing studies, standard deviation and rate of change are the most frequently used methods for measuring price volatility. However, since the standard deviation and rate-of-change formulas can generate results that vary greatly depending on the measurement period and number of observations, a volatility-measurement method that produces more consistent results is needed. In response to this issue, this study measures the price volatility based on the GARCH (1,1) model, which minimizes the volatility measurement errors of time-series random variables and implicitly reflects past volatility patterns. The GARCH (1,1) method maximizes coherence and predictability by implicitly reflecting the residuals and variance values of time-series random variables (Choi, 2013). The
38 In support of Adelman (1984)’s “one great pool hypothesis,” the phrase “The world oil market, like the ocean, is one great pool” has been quoted in several studies. Studies supporting this hypothesis are IMF (2008), Fattouh (2010), and Aimadi and Zhang (2011).
25
composition of the GARCH (1,1) model is as follows (Choi, 2013).
In general, the GARCH (p, q) model is determined by the parameter values of “p,” which is the number of lag in the GARCH model and “q,” which is the number of lag in the ARCH model. In the above formula, h is the time-series random variable, is the residuals, and is the error of GARCH (1,1). The ARCH (1) of the crude oil price variance, h, used to compose the above GARCH (1,1) is as follows.
If the variance of the random variable is interpreted as volatility, the price volatility of t is the sum of the squared value of the residual t-1 and variance value by reflecting the weighted parameter obtained through a maximum likelihood estimation.
The GARCH (1,1) model used to estimate price volatility shows that the volatility patterns of WTI and Brent are similar, as are the volatility patterns of Dubai and Oman oils. The reason for this is probably that WTI and Brent are marker crude oils in the Western region, including the United States and Western Europe, and Dubai and Oman are markers in Asia.
Figure 3-1 shows the conditional and unconditional volatilities of the daily prices of Dubai and Oman crude oils. Conditional volatility is the daily volatility measured under the GARCH (1,1) condition, while unconditional volatility is calculated by applying the daily residuals ( ) to the entire period. Therefore, conditional volatility data is used to understand the volatility in the form of random variables that change on a daily basis, whereas unconditional volatility, in the form of a constant value, is used to understand the volatility during the entire target period. As described above, the price volatilities of Dubai and Oman crude oils are very similar: the unconditional volatility of Dubai oil is 1.0566 and that of Oman oil is 1.0529.
The conditional and unconditional volatilities of the daily prices of WTI and Brent are shown in Figure 3-2. As can be seen here, the volatility patterns of the two crude oils are similar. However, the unconditioned volatility, which is the volatility over the entire period, of WTI is 1.3573, which is a little higher than the 1.3076 of Brent.
The price volatility of both crude oils is higher than those of Asian marker crude oils.
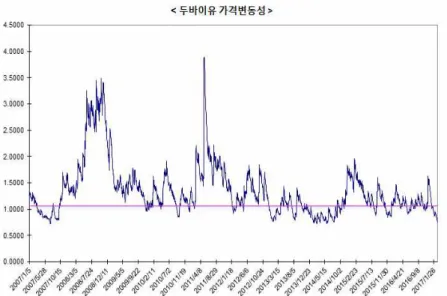
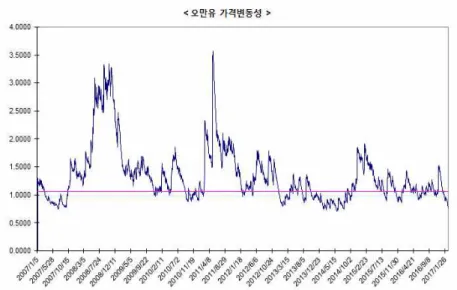
Figure 3-1. Daily Price Volatility of Dubai and Oman Crude Oils
26
Note: The solid line is the daily volatility (conditional volatility) measured under the GARCH (1,1) condition.
The dotted line is the standard deviation (unconditional volatility) calculated by applying the daily residuals ( ) to the entire period.
원문 번역문
두바이유 가격변동성 오만유 가격변동성
Price volatility of Dubai crude oil Price volatility of Oman crude oil
Figure 3-2. Daily Price Volatility of WTI and Brent Crude Oils
27
Note: The solid line is the daily volatility (conditional volatility) measured under the GARCH (1,1) condition.
The dotted line is the standard deviation (unconditional volatility) calculated by applying the daily residuals ( ) to the entire period.
원문 번역문
WTI 가격변동성 브렌트 가격변동성
Daily price volatility of WTI crude oil Daily price volatility of Brent crude oil
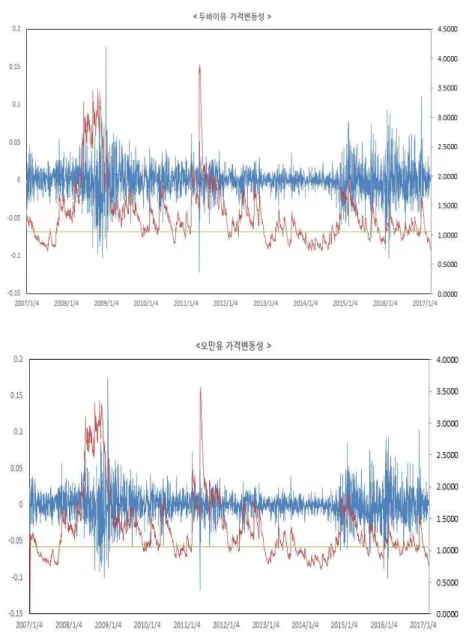
Let’s look at how the volatility measured on the basis of the GARCH (1,1) model is different from the volatility measured according to the conventional volatility-measurement method, which uses the rate of change in the preceding period.39 As shown in Figure 3-3, the price volatilities of Dubai and Oman measured by the GARCH (1,1) model from January 2007 to December 30 of 2016 show similar patterns as the volatilities calculated based on the rate of change in the preceding period. As for the numeric code, the simple rate of change is marked with a positive sign (+) to indicate an increase and a negative sign (-) to indicate a decrease. However, given that the volatility based on the GARCH (1,1) model is always above zero, all the volatilities from mid-2008 to early 2009 have increased. After that, the volatility remained stable before increasing sharply in early 2011, entering another period of stability, and increasing again from 2015. However, in early and mid-2016, the volatility based on the GARCH (1,1) model is smaller than the volatility based on the rate of change. The reason for this seems to be that the sudden price volatility, in which the oil price fell drastically from USD 140 per barrel to USD 40 per barrel due to the global financial crisis from mid-2008 to early 2009, was recognized as a pattern in the GARCH (1,1) model.
The price volatilities of WTI and Brent shown in Figure 3-4 are similar to those of Dubai and Oman. Generally, the GARCH (1,1)-based volatility and rate-of-change-based volatility have the same patterns—that is, they increase during the period from 2008 to 2009, during 2011, and again during the period from 2015 to 2016. In 2016, the GARCH (1,1)-based volatility is smaller than the rate-of-change-based volatility.
39 The formula for calculating volatility based on the rate of change in the preceding period is , and the average value is zero.
28
Figure 3-3. Price Volatilities of Dubai and Oman Oils Based on GARCH (1,1) Model and Rate of Change
Note: The blue lines are the rate-of-change volatility (left vertical axis), and the red and green lines are the GARCH (1,1)-based conditional and unconditional volatilities, respectively (right vertical axis).
원문 번역문
두바이유 가격변동성 오만유 가격변동성
Price volatility of Dubai crude oil Price volatility of Oman crude oil