Basic Research Report 16-13
An Analysis on the Impact of Lifting U.S. Crude Oil Export Ban on the Korean Oil Industry
Jae-kyung Kim
Research Staff
Head Researcher: Jae-kyung Kim, Assistant Research Fellow
Research Associates: Haksik Yu, Assistant Research Fellow
Hanho Kim, Seoul National University
ABSTRACT 1. Research Background and Purpose
On December 18, 2015, the US Senate and the US House of Representatives passed a provision as part of the Consolidated Appropriations Act 2016 to remove restrictions on US crude oil exports. Later that same day, the provision was signed into effect by US President Barack Obama. In effect, the provision lifted the export ban on US crude oil that had been in place since 1975 and allowed for the supply of US crude oil to the international oil market without institutional constraints beginning in 2016. About 11 months later, on November 8, 2016, Donald Trump, the presidential candidate of the US Republican Party, was elected as the 45th President of the US. Expectations are increasing in the oil industry that the coming Trump Administration, which will lead state affairs for the next four years (eight years if Trump is reelected),will open a new chapter in the US oil industry.
The domestic oil industry of Korea, which, in effect, imports almost 100% of its crude oil from other countries (with the exception of a small amount of condensate produced each year in the gas fields of the East Sea), is constantly on high alert for any changes in the international oil market and US oil industry trends, the latter of which can substantially affect the international oil market. Following a public hearing of the US Senate Committee on Energy and Natural Resources in January 2014 in which controversy brewed over the lifting of US crude oil export regulations, leaders in the domestic oil industry began speculating in earnest whether the US crude oil export ban would end and, if so, how it would impact the international oil market. Many were particularly interested in the possibility of introducing US crude oil in Korea pending the removal of regulations.
Korea’s sensitivity to changes in overseas oil markets is largely due to the fact that its domestic oil industry relies so heavily on overseas oil exports. Korea imports almost all of its crude oil from other countries and relies heavily on condensate; this is even more concerning considering the fact that 72% of its condensate (as of 2014) comes from a single country in the Middle East—Qatar. Korea’s interest in US crude oil as a new source of oil imports has been high as the country continues to seek a more secure supply of oil, overcome its disadvantages in the industry, and heighten its negotiating power for oil introduction
In order to promote the domestic oil industry, it is necessary to continually monitor the repercussions of the lifting of the US oil export ban and identify any future impact these changes may have on the domestic oil industry. This study reviews the trends of the US oil industry from the initiation of US crude oil export regulations to the lifting of said regulations on December 18, 2015. This study then uses these trends as a basis to present a forecast of US crude oil export trends following the lifting of regulations. Furthermore, this study uses projections of how the lifting of US crude oil export regulations will affect the domestic oil industry to propose ways in which US crude oil imports can directly and indirectly be introduced in Korea.
2. Summary and Policy Implication
During the time when the lifting of regulations on US crude oil imports was still up for debate, many predicted that if restrictions on US crude oil exports were lifted that it would ease the oversupply of low sulfur light sweet crude oil in the US, thereby driving up the price of US crude oil (WTI) and crude oil production in the US, which would then ultimately put pressure on global crude oil prices (Brent). These predictions proved to be right up until the first half of 2014.
However, in July 2014, when controversy increased regarding the lifting of restrictions on US crude oil exports, global crude oil prices plummeted to half their previous levels. Following this initial decline, oil prices still remain bearish (as of the latter part of 2016).
Since 2011, the increased production of light tight oil (LTO) in the US has played a large role in driving down global crude oil prices. Even when the now-lifted export regulations were still in place, the oversupply of low sulfur light sweet crude oil in the US affected global oil markets by the way of reducing oil imports. Even before US crude oil regulations were lifted, the Brent-WTI price spread narrowed to a level of below 5~6/B$6/B, thwarting large-scale, long-term oil exports and long-distance oil exports to East Asia. Currently, small-scale oil transactions, mostly short-term spot transactions based on supplementary export strategies—such as employing different shipping options (e.g. back-haul) and small-scale “test cargo”—are being made with countries on the Gulf Coast of Mexico in Latin America and those on the coast of the North Atlantic.
The aforementioned factors have had the combined effect of impeding the introduction of US crude oil to Korea. From September 2014 to September 2105 (when US crude oil regulations were lifted), Korea introduced a total of 2.73 million
barrels of crude oil to the nation from the US; however, no crude oil was imported to Korea from the US following the lifting of regulations. More recently, GS Caltex has agreed to introduce 1 million barrels of US Eagle Ford crude oil in Korea in November 2016, but it remains to be seen whether this transaction will actually take place.
Korea’s low import of US crude oil can be attributed to low oil price trends. If oil prices remain low for the foreseeable future, the US’s supply of crude oil to the international oil market will be limited, and the introduction of US crude oil to Korea will be even more unlikely.
Despite these downward trends, the US election results on November 8, 2016 have heightened the possibility of overcoming these obstacles to resume the introduction of US crude oil in Korea. The Trump Administration, which is believed to be relatively friendly to the oil industry compared to the Obama Administration (an administration that put a damper on oil production in the US with increased environmental regulations), could enhance the US’s crude oil production capacity as well as its potential exports. In light of this, it is necessary to make concerted efforts to closely monitor the status of the US oil industry and determine the proper timing of reintroducing US crude oil to Korea.
Lastly, the issue of the introduction of US crude oil in Korea affects more than just the nation’s oil refiners. The Trump Administration is expected to increase trade pressure on Korea to narrow the US’s trade deficit with Korea. As such, it is important to actively review the prerequisites and consequences of introducing US crude oil in Korea in order to be prepared to respond to any calls to action by the US. The introduction of US crude oil in Korea should also be continuously reviewed in an attempt to solidify the political alliance between Korea and the US, an alliance that must be reestablished in terms of the reallocation of defense costs.
This study presents the following policy proposals for the active promotion of introducing US crude oil in Korea.
(A) Attract US crude oil to the commercial storage facilities of the Northeast Asia Oil Hub Project
One way for Korea to effectively introduce US crude oil to the nation is to attract US crude oil to commercial storage facilities that will soon be built as part of the Northeast Asia Oil Hub Project (NAOHP). The NAOHP, which has been underway since 2010 as part of other national projects, has progressed with the construction of three large-scale storage facility bases: one in Yeosu (8.2 million barrels), one in the North Harbor of Ulsan (9.9 million barrels), and one in the South Harbor of Ulsan (18.5 million barrels). Domestic oil refiners are experiencing short-term spot demands for crude oil due to uncertainties over operational decision-making related to refining facilities. Taking this into consideration, the nation may well consider operating the aforementioned storage facilities as facilities dedicated solely to crude oil. More specifically, Korea can use these facilities to attract US oil companies or traders of US nationality and allow these companies/traders to directly stock the facilities with US crude oil. If enough crude oil is attracted to the facilities, it can allow for increased spot crude oil transactions between domestic oil refiners and facility users. If the types of crude oil demanded by domestic oil refiners are attracted in sufficient quantities, it will have the effect of revitalizing spot crude oil transactions nationwide. This in turn will attract even greater oil reserves to the storage facilities.
To facilitate increased oil transactions, the government should also consider enforcing minimum purchase amounts of crude oil for domestic oil refiners; these minimums purchase amounts should be specified in the facility lease agreements with the US oil companies and/or traders. Since enforcing a minimum purchase amount would effectively guarantee US oil companies/traders a certain amount of crude oil sales, it would provide a greater incentive for US oil companies/traders to take advantage of domestic commercial storage facilities.
Domestic oil refiners, or US oil companies or traders, could also transport US crude oil for widespread use nationwide.
However, a short-term approach is recommended to meet current spot demand from domestic oil refiners.
(2) Increase energy cooperation between Korea and the US to build a crude oil export infrastructure along the northwestern coast of the US
In order to shift the focus of the introduction of US crude oil from short-term spot crude oil transactions to large-scale long-term contracts and/or lessen dependence on Middle Eastern oil imports through increased US crude oil imports, conditions must be created that allow for the large-scale supply of US crude oil to the international oil market. Many believe that the issue of lessening dependence on Middle Eastern oil imports by increasing US oil imports can be addressed once the Trump Administration adopts favorable oil policies that effectively raise the potential of US crude oil
production. In other words, the issue of large-scale US crude oil exports is one that must be addressed using a mid-to- long term approach.
Another issue that demands attention is that of the US crude oil export infrastructure. Currently, harbors for crude oil export that are connected via pipelines to major LTO producing areas are mainly clustered in the Gulf of Mexico, and there are no export harbors where VLCCs (very large crude carriers) and ULCCs (ultra low cost carriers) can dock for large-scale exports. Efforts are now underway to improve the export infrastructure and export terminals of harbors along the Gulf of Mexico, but it is highly probable that such efforts will mainly benefits exports to Latin America or Europe rather than East Asia, including Korea.
In the mid-to-long term, it is necessary to review measures to establish and strengthen an export infrastructure that will allow for US crude oil exports from western locations in the US, particularly along the northwestern coast of the US or the western coast of Canada, locations which are geographically closer to Korea. The construction of export infrastructure in western US locations (especially along the northwestern coast) must be preceded by the construction of pipelines that connect harbors to Bakken in North Dakota, one of the nation’s top LTO producing areas. If pipelines can be built that connect Bakken to the northwestern coast of the US (the state of Washington or the state of Oregon) or the west coast of Canada (British Colombia), this can set the stage for large-scale US crude oil imports to Korea.
The realization of pipelines connecting these keys areas is dependent on support from state governments through which the pipelines pass as well as the federal government. Fortunately, the Trump Administration seems to be in favor of the construction of an oil transport infrastructure, and has already said that it would reapprove the construction of the Keystone Pipeline, which had previously been thwarted by the Obama Administration. In light of these favorable conditions, Korea should now make efforts to increase its cooperation with US officials in the mid-to-long term with the goal of establishing a crude oil export infrastructure along the northwestern coast of the US that includes pipelines connecting key areas.
Table of Contents
Chapter 1. Introduction ... 11
Chapter 2. A Brief History of U.S. Crude Oil Export Regulations ... 12
Section 1. The adoption and execution the U.S. crude oil export ban (EPCA Section 103) ... 12
1. The adoption of the U.S. crude oil exports ban (EPCA Section 103) ... 12
2. Outline of EAR (Export Administration Regulations) ... 13
Section 2. Lifting the U.S. crude oil export ban... 14
1. Demands for lifting the U.S. crude oil export ban ... 14
2. Lifting the U.S. crude oil export ban... 18
Section 3. Provisions in the Consolidated Appropriations Act 2016 lifting the ban on U.S. crude oil exports... 20
Chapter 3. Impact of Export Deregulation on the International Oil Markets ... 22
Section 1. Drop in international oil prices due to higher production of U.S. LTO ... 22
Section 2. Estimated impact of the removal of the U.S. crude oil export ban ... 23
1. Arguments in favor of the removal of the U.S. crude oil export ban ... 23
2. Official position of the U.S. EIA on the impact of the removal of the U.S. crude oil export ban ... 24
Chapter 4. Status and Outlook on U.S. Crude Oil Exports Amidst Low Oil Prices ... 29
Section 1. Status and outlook on U.S. crude oil production amidst low oil prices ... 29
1. Transition to low oil prices and changes in U.S. crude oil production ... 29
2. The response of the LTO production industry to low oil prices ... 30
3. Potential and resilience of LTO production... 32
4. U.S. crude oil production outlook ... 34
Section 2. U.S. crude oil exports and outlook ... 36
1. Forecast of U.S. crude oil exports ... 36
2. Trends and outlook of the Brent-WTI spread... 37
3. Performance and current state of U.S. crude oil exports ... 39
Chapter 5. Infrastructure for U.S. Crude Oil Exports ... 44
Section 1. Logistics structure for crude oil in the U.S. ... 44
1. Major infrastructure in the U.S. for crude oil exports ... 44
2. Changes in the logistical structure of crude oil in the U.S. ... 45
Section 2. Crude oil export infrastructure in the Gulf of Mexico ... 46
Section 3. Major crude oil export terminals in the Gulf of Mexico ... 49
1. Crude oil export terminals in Houston ... 49
2. Crude oil terminals in the Nederland and Port Arthur regions ... 53
3. Crude oil export terminals in the Port of Corpus Christi ... 54
4. Louisiana Offshore Oil Port (LOOP) ... 58
Section 4. The crude oil export infrastructure of the Gulf of Mexico ... 59
Chapter 6. Impact of the Removal of the U.S. Crude Oil Export Ban on the Korean Oil Industry ... 61
Section 1. Relationship between changes in the international oil market and the removal of the U.S. crude oil export ban ... 61
Section 2. Outlook on the import of U.S. crude oil to Korea after the removal of the U.S. export ban ... 62
Section 3. Changes in oil policy brought about by the Trump Administration and the response of the Korean oil industry ... 65
1. Import of U.S. crude oil in commercial storage facilities (ex. Northeast Oil Hub)... 66
2. Import of U.S. condensate to diversify the oil composition of the Strategic Petroleum Reserve (SPR) ... 67
3. Strengthening US-Korea energy cooperation for the construction of crude oil export infrastructure in the Northwest U.S. ... 68
Chapter 7. Conclusion ... 70
References ... 71
List of Tables
Table 2-1. Major Oil Refining Facilities by Region ... 16
Table 3-1. Assumptions by Scenario for the Analysis of the Impact of the Removal of the U.S. Crude Oil Export Ban 24 Table 3-2. Projected Changes in the Brent-WTI Spread Resulting from the Removal of the Export Ban ... 27
Table 4-1. Short-term Outlook of the Brent-WTI Spread ... 38
Table 5-2. Regional Distribution of Crude Oil Export Terminals in the U.S... 44
Table 5-2. Major Pipelines in the Gulf of Mexico (U.S.) ... 46
Table 5-3. Capacity of Refining Facilities in the Gulf of Mexico... 47
Table 5-4. Major Refining Facilities in the U.S. Gulf Coast ... 47
Table 5-3. Storage Facilities at Oil Terminals in the Gulf Coast ... 48
Table 5-4. Information on Crude Oil Export Docks at the Oiltanking Houston Inc. Terminal ... 49
Table 5-5. Information on Oil Export Docks at the Magellan Midstream’s Galena Park Terminal ... 50
Table 5-6. Information on Crude Oil Export Docks at the Houston Fuel Oil Terminal (HOFTI) ... 52
Table 5-7. Information on Oil Export Docks at the Oiltanking Texas City Terminal ... 52
Table 5-8. Oil Export Docks at the Sunoco Logistics Nederland Terminal ... 54
Table 5-11. Information on Oil Export Docks at the NuStar North Beach Terminal ... 55
Table 5-9. Information on Oil Export Docks at the Trafigura’s Texas Dock & Rail Terminal ... 56
Table 5-10. Information on Oil Export Docks at the Flint Hills Resources Ingleside Export Terminal ... 57
Table 5-11. Planned Port Expansions and Improvements in the Gulf of Mexico (Texas) ... 59
Table 6-12. A Comparison of Transport Costs for Condensate Shipped from the U.S. and the Middle East (Qatar, Iran)62 Table 6-13. Composition of the Strategic Petroleum Reserve (as of the end of March 2016) ... 67
List of Figures
Figure 2-1. Trends in U.S. Crude Oil Production and Net Imports (1920-1980) ... 12
Figure 2-2. Trends in U.S. Crude Oil Production and Net Imports (1973-2014) ... 14
Figure 2-3. Trends in U.S. Production of Crude Oil (1960-2014) ... 14
Figure 2-4. Major Types and Uses of U.S.-produced Oil ... 15
Figure 2-5. Outlook on U.S. Crude Oil Production by Oil Type ... 15
Figure 2-6. Crude Oil Refining and Coking Capacities by U.S. PADD Region ... 16
Figure 2-7. Trends in the Brent-WTI Price Spread (2010-2015) ... 17
Figure 3-1. Daily U.S. Import Volume of Crude Oil by Oil Type ... 22
Figure 3-2. Simulated Mechanisms and Impact of Lifting the U.S. Crude Oil Export Ban ... 23
Figure 3-3. Assumptions of Trends in International Oil Prices (Brent Oil Prices) by Scenario (Ban Lifted) ... 24
Figure 3-4. Outlook on U.S. Crude Oil Production by Scenario (Export Regulations Maintained) ... 25
Figure 3-5. Projected Rise of U.S. Crude Oil Prices (WTI Prices) Resulting from the Lifting of the Export Ban ... 25
Figure 3-6. Projected Increase of U.S. Crude Oil Production Resulting from the Removal of the Export Ban ... 26
Figure 3-7. Projected Decline of International Oil Prices (Brent Oil Prices) Resulting from the Removal of the Export Ban ... 26
Figure 3-8. Projected Brent-WTI Spread Resulting from the Removal of the Export Ban ... 27
Figure 4-1. Changing Trends in International Oil Prices since 2014 ... 29
Figure 4-2. Trends in U.S. Crude Oil Production Since 2014 ... 29
Figure 4-3. Trends in New Well Production Volume Per Rig in Major LTO-Producing Regions ... 30
Figure 4-4. Changes in Production Volume in Production (Operation) Period by Well Generation (Bakken region) ... 30
Figure 4-5. Trends and Outlook on the Depth and Efficiency of Rigs in Major LTO-Producing Regions... 31
Figure 4-6. Trends in Oil Prices Vs. the Break-even Points of Major Oil-Producing Regions ... 32
Figure 4-7. Number of DUCs in the Four Major LTO-Producing Regions ... 33
Figure 4-8. Trends of DUCs Vs. Completed Wells in the Four Major LTO-Producing Regions ... 33
Figure 4-9. U.S. Crude Oil Production Outlook ... 34
Figure 4-10. Outlook on U.S. Crude Oil Exports after the Lifting of the Ban ... 36
Figure 4-11. Trends in the Brent-WTI Spread in 2015 ... 37
Figure 4-12. Trends in the Brent-WTI Spread in 2016 ... 37
Figure 4-13. Outlook on Brent-WTI Spread (2016-2035) ... 38
Figure 4-14. U.S. Crude Oil Exports Prior to the Removal of the Export Ban ... 39
Figure 4-15. Changes in U.S. Crude Oil Exports After the Removal of the Export Ban ... 40
Figure 4-16. U.S. Crude Oil Exports to Countries Other than Canada (Jan–May 2016) ... 41
Figure 5-1. Crude Oil and Condensate Production by State (as of the first quarter of 2014) ... 44
Figure 5-2. Major Crude Oil Pipelines and Major Export Ports in the Gulf of Mexico (U.S.) ... 46
Figure 5-3. Four Crude Oil Export Terminals in Houston ... 49
Figure 5-4. Panoramic View of the Oiltanking Houston Inc. Export Terminal ... 50
Figure 5-5. Panoramic View of the Magellan Midstream’s Galena Park Terminal ... 51
Figure 5-6. Panoramic View of the Houston Fuel Oil Terminal ... 51
Figure 5-7. Location of the Oiltanking Texas City Terminal ... 52
Figure 5-8. Ports and Export Terminals in the Nederland and Port Arthur Regions ... 53
Figure 5-9. Location of the Sunoco Logistics Nederland and P/L Connection ... 53
Figure 5-10. Crude Oil Export Terminals Near the Port of Corpus Christi ... 55
Figure 5-11. Structural Layout and Panoramic View of the NuStar North Beach Terminal Dock #1 ... 55
Figure 5-12. Condensate P/L Connection of the Magellan C.C. (Midstream) Export Terminal ... 57
Figure 6-1. Trends in the Dubai-WTI Spread in 2015 ... 63
Figure 6-2. Trends in the Dubai-WTI Spread in 2016 ... 63
Figure 6-3. Long-term Outlook on the Dubai-WTI Spread (2016-2035) ... 64
Figure 6-4. Current Map of KNOC’s Production Assets (Mining Lot) in Eagle Ford, U.S. ... 68
Figure 6-5. Major Shipping Routes and Methods for the Crude Oil Produced in Bakken ... 69
Chapter 1. Introduction
On December 18, 2015, the U.S. Congress adopted the Consolidated Appropriations Act 2016, which included an authorizing provision ending the ban on U.S. crude oil exports. The provision, which came into effect when then- President Barack Obama signed the bill the same day as Congress, lifted a 40-year ban on U.S. crude oil exports that had been in place since 1975, and opened the way for the full-fledged, unrestricted supply of U.S. crude oil to the international oil market. Immediately after the removal of the ban, the Swiss oil trader Vitol secured 600,000 barrels of U.S. crude oil. On December 31, 2015, the first of this cargo was loaded and shipped from a port in Corpus Christi, marking the first export of U.S.-produced crude oil without an export license since 1975. Approximately eleven months later, on November 8, 2016, Republican presidential candidate Donald Trump was elected as the 45th president of the United States. President Trump’s election has led to heightened expectations within the industry that the new Trump administration (which will lead state affairs for the next four years—eight if President Trump is re-elected—starting from January 20, 2017) will provide a new turning point for U.S. oil. In less than a year, the U.S. oil industry has faced rapid changes. Considering the current position of the U.S. oil industry in the international oil market and the interconnectivity of oil industries around the world, any major changes in the U.S. oil industry will inevitably impact the oil industries in other countries.
For Korea, a country that imports virtually all of its crude oil from overseas sources, except for a small amount of condensate produced annually in a gas field in the East Sea, it is particularly important to pay close attention to trends in the international oil market, which trades in crude oil, and trends in the U.S. crude oil industry, which significantly impacts the international market. Leaders in the domestic oil industry in Korea have closely followed the issue of the maintenance/removal of the U.S. crude oil export ban and its potential impact on the international oil market ever since the issue first arose in January 2014 with the hearing of the U.S. Senate Committee on Energy and Natural Resources.
With lifting U.S. crude oil export ban, Korea has now taken a particularly high interest in the possibility of importing crude oil from the U.S. As previously mentioned, Korea is completely reliant on overseas imports of crude oil to supply its domestic oil industry, and is particularly dependent on condensate exports from the Middle East (Qatar), which have represented 72 percent of Korea’s total condensate imports since 2014. The high interest in U.S. crude oil as a new potential oil source stems from Korea’s desire to diversify its supply sources, secure stable imports of crude oil, overcome its disadvantage in import negotiations, and enhance its negotiating powers (Jae-kyung Kim, 2014).
Various studies, including those by Jae-kyung Kim (2014, 2015b, 2015c, and 2016), have been conducted in Korea to monitor the progression and impact of the removal of the U.S. crude oil export ban, an issue which has been a topic of much debate since March 2014. The study by Jae-kyung Kim (2014) detailed the progression and state of discussions regarding the ban removal up until August 2014, while one of Kim’s later studies (2015b) gave an update on the issue as of December 2014, when the U.S. Department of Commerce’s Bureau of Industry and Security (BIS) issued private rulings authorizing the export of lease condensate. Another study by Jae-kyung Kim (2015c) provided an analysis of the issue as of September 2015, when H.R. 702, a bill that proposed the lifting of the U.S. oil export ban, was reviewed by the House of Representatives. A later study, also by Jae-kyung Kim (2016), covered the progression of the issue up through December 2015, when the export ban was finally lifted by the Consolidated Appropriations Act of 2016. Despite the significant contributions of existing studies, a study is now needed to monitor the current situation following the removal of the export ban and to examine the impact of the ban removal on the domestic oil industry.
As an extension of the existing research referenced above, this study provides an overview of the entire process leading up to the U.S. crude oil export ban as well as the removal of the ban on December 18, 2015. It also provides an outlook on U.S. crude oil exports following deregulation. In addition, this study expounds upon the possible impact deregulation may have on the domestic oil industry, and examines the prospects of U.S. crude oil imports, both through direct imports and indirect imports through international oil markets.
Chapter 2. A Brief History of U.S. Crude Oil Export Regulations Section 1. The adoption and execution the U.S. crude oil export ban (EPCA Section 103)1 1. The adoption of the U.S. crude oil exports ban (EPCA Section 103)
The U.S. crude oil export ban was first initiated as a response to the Organization of Arab Petroleum Exporting Countries (OPEC)’s prohibition of crude oil exports to the U.S. in 1973. OPEC’s prohibition was enacted on October 19, 1973 as a retaliatory measure against the U.S. for having intervened in the Yom Kippur War. As part of this measure, OPEC announced that it would reduce production of crude oil by five percent every month until Israel completely withdrew from the occupied territories, and simultaneously banned crude oil exports to the U.S. and other countries that were allied with Israel, including Canada, Japan, the Netherlands, and the U.K. In addition, OPEC also adopted a measure to raise the international oil price from 3.65$/B in September 1973 to 11.65$/B in December 1973, striking a huge financial blow to the U.S. and the rest of the western world.
Faced with these restrictions that negatively impacted the availability of crude oil from the Middle East and rapidly increased international oil prices, the U.S. began to realize more fully the importance of crude oil as a resource, and concerns surrounding the stability of importing crude oil were taken far more seriously. Around this time, people began to view the U.S.’s reliance on foreign crude oil (a reliance that had grown over time simply because foreign crude oil was cheaper) as not only a financial threat but also a security threat, and social opinions prevailed that not only supported the control but even the prohibition of U.S. crude oil exports.
Figure 2-1. Trends in U.S. Crude Oil Production and Net Imports (1920-1980)
Source: Bordoff et al. (2015)
Amidst this social climate, then-President Richard Nixon proposed ‘energy independence’ in an address to the people on December 25, 1973. In his address, Nixon emphasized that the country’s political ‘independence’ depended on energy self-sufficiency, and that strengthening energy self-sufficiency was a core national goal. Under this policy direction, the U.S. adopted Section 103 of the Energy Policy and Conservation Act (EPCA) of 1975, which proposed the prohibition of U.S.-produced crude oil exports as of December 22, 1975. EPCA Section 103 includes the following provision that authorizes the U.S. administration (more specifically, the president) to respond to any disturbances in energy supply, particularly oil security:
“The President may, by rule, under such terms and conditions as he determines to be appropriate and necessary to carry out the purposes of this Act, restrict exports of (1) coal, petroleum products, natural gas, or petrochemical feedstock, and, (2) supplies of materials or equipment which he determines to be necessary to maintain further exploration, production, refining, or transportation of energy supplies [crude oil], or for the construction or maintenance of energy facilities within the United States (42 U.S.C.
§6212(a)(1)).”
The following provision also allows the president to not only restrict U.S. crude oil exports, but also enact prohibitions with a few exceptions:
1 The historical events presented in this study surrounding the adoption of the U.S. crude oil export ban are partially referenced from the work of Jae-kyung Kim (2014). In his study, Jae-kyung Kim (2014) provides a systematic overview of the historical facts surrounding the U.S. export ban, and information from Kim’s work (2014) have been included in this study to allow readers to more fully grasp the historical context of the U.S. crude oil export ban. The information included in this study does not intend to plagiarize the work of Jae-kyung Kim (2014) in any way.
“The President shall exercise the authority [described above] provided for in subsection (a)2 to promulgate the rule prohibiting the export of crude oil and natural gas produced in the United States…the President may, pursuant to paragraph (2) [exceptions], exempt from such prohibitions crude oil or natural gas exports that he determines to be consistent with the national interest and the purposes of this Act (EPCA) (42 U.S.C. §6212(b)(1)).”
“Exemptions from the rule prohibiting crude oil or natural gas exports shall be included in such rule (promulgated by the President) or provided for in an amendment thereto and may be based on the purpose for export, class of seller or purchaser, country of destination, or any other reasonable classification or basis as the President determines to be appropriate and consistent with national interest and the purposes of this Act (42 U.S.C. §6212(b)(2)).”
As such, EPCA Section 103 authorizes the U.S. president to promulgate the provision to prohibit the export of crude oil and outlines factors that must be considered or included for promulgation. However, the actual ban was executed pursuant to the Export Administration Act of the U.S. Department of Commerce.
“In order to implement any rule promulgated under subsection (a) of this section, the President may request and, if so, the Secretary of Commerce shall, pursuant to the procedures established by the Export Administration Act of 1979 … impose such restrictions as specified in any rule under subsection (a) of this section…(42 U.S.C. §6212(c)).”
2. Outline of EAR (Export Administration Regulations)
The Export Administration Act (EAA)3 of 1979, which continues to be extended and enacted as part of the U.S.’s export control system, was first adopted as an amendment to the EPCA in 1979. As mentioned previously, the EAA made provision for the execution of EPCA Section 103, which includes crude oil as a product that can be banned from export.
15C.F.R.§754.2 of the Export Administration Regulations (EAR), which provides detailed regulations regarding the prohibition of crude oil exports, defines ‘crude oil’ subject to ban as follows:
“‘Crude oil’ is defined as a mixture of hydrocarbons that existed in a liquid phase in underground reservoirs and remains liquid at atmospheric pressure after passing through surface separating facilities and which has not been processed through a crude oil distillation tower. Included are reconstituted crude petroleum, lease condensate, and liquid hydrocarbons produced from tar sands, gilsonite, and oil shale. Drip gases are also included, but topped crude oil, residual oil, and other finished and unfinished oils are excluded (15C.F.R.§754.2(a)(1)).”
Under this legislation, all exports of ‘crude oil’ as defined above were banned with a few exceptions4. If conditions were met as outlined in the exemption clause5 of EPCA Section 103, export was permitted in limited quantities and only with an export license as issued by the Bureau of Industry and Security (BIS)6. The EAR crude oil export ban was a
‘positive’ form of regulation that only listed permitted actions (exports) and prohibited all other activities. The ban was literally an export ban on U.S. crude oil with very few exceptions.
2 42 U.S.C.§6212(a)
3 The EAA was an act that was originally set to expire in 2001. However, after the September 11, 2001 attacks, then-president George W. Bush declared a state of national emergency based on Executive Order 13222 pursuant to the International Emergency Economic Powers Act (IEEPA) of 1977 and extended the EAR. Since then, the EAR has been extended annually by means of a Presidential Notice. The most recent notice was issued in August 2013. The EAA has been abolished de facto, but the EAR is extended each year as an executive rule of the IEEPA (Jae-kyung Kim, 2015a).
4 Exemptions to the export ban were limited and included the export of: foreign crude oil stored in the Strategic Petroleum Reserve, small amounts of crude oil as samples for analyses and tests, and crude oil transported through pipes installed in land belonging to the federal government (TAPS crude oil) pursuant to Section 203 of TAPAA (Trans-Atlanta Pipeline Authorization Act) (Jae-kyung Kim, 2014).
5 Exceptional conditions that allowed the issuance of export licenses included: (1) the export of crude oil produced in the Cook Inlet in Alaska; (2) the export of crude oil to Canada up to a limit of 50,000b/d for (final) consumption or utilization within Canada; (3) the export of Strategic Petroleum Reserve (U.S. crude oil) for refining (precondition of product re-imports) and preconditioned for exchange for petroleum products with a foreign country; (4) the export of California Intermediate (under API 20°) up to a limit of 25,000b/d,; (5) exports pursuant to international agreements; (6) exports permitted by presidential decision pursuant to other legal provisions (processing of agenda items); and (7) exports of foreign crude oil by a U.S. exporter. Additionally, even when such exceptional conditions were not met, export applications were reviewed on a case-by-case basis, and when the president decided it satisfied national interest and EPCA purposes, export licenses were issued for the relevant case (Jae-kyung Kim, 2014).
6 BIS is entrusted with export management, and grants an Export Control Classification Number (ECCN) for items (including services or technology) exported from the U.S. according to the Commerce Control List (CCL) and also controls these items.
Section 2. Lifting the U.S. crude oil export ban7 1. Demands for lifting the U.S. crude oil export ban
The ban on U.S. crude oil exports first adopted in 1975 through EPCA Section 103 was maintained for forty years. The ban was maintained for such a long period of time because the U.S.’s production of crude oil never surpassed domestic demand, meaning that there was no real need to export U.S.-produced crude oil overseas. For many years, the U.S. was the world’s greatest net importer of crude oil, and with several exceptions, the need for exports was insignificant, even without factoring in export regulations.
Figure 2-2. Trends in U.S. Crude Oil Production and Net Imports (1973-2014)
Source: Bordoff et al. (2015)
However, in the years leading up to and following the year 2011, the U.S. crude oil industry underwent rapid changes, and it was no longer possible to maintain8 previously existing regulations. In 2008, U.S. crude oil production hit its lowest production since 1980 at 5 million b/d. In 2012, production jumped to 6.5 million b/d and continued to increase to 7.5 million b/d in 2013 and 8.7 million b/d in 2014. From 2013 to 2014 alone, production rose by 16.2 percent (1.2 million b/d in 2013 to 8.7 million b/d in 2014), which was the greatest recorded oil production increase in the past 60 years (Byoungyun Lim, 2015). Finally in 2015, production rose to 9.25 million b/d, surpassing that of Russia and Saudi Arabia and making the U.S. the single largest oil producer in the world.
Figure 2-3. Trends in U.S. Production of Crude Oil (1960-2014)
7 The major events detailing the process of lifting U.S. crude oil export ban are recorded in the study conducted by Jae-kyung Kim (2016), which was conducted as part of this study. The work of Jae-kyung Kim (2016) has also been included in a leading journal that analyzes and publishes information about the latest issues in the global energy market. When this study was initiated in January, the lifting of the ban on U.S. crude oil exports (December 2016) was the hottest issue in the global energy market. In order to meet market demands, parts of this study were included in the journal prior to the issuance of the final results of this study;
however, there is no intention to violate research ethics in any way.
8 EPCA Section 103 was regarded as a type of trade barrier and was criticized as a measure based on trade protectionism, creating a situation in which U.S. crude oil could generate value added in the refining process by keeping the oil within U.S. borders to create more net profit. In particular, since it went against modern trade rules based on the principles of free trade represented by GATT (General Agreement on Tariffs and Trade) and WTO (World Trade Organization), the policy direction of prohibiting crude oil exports faced demands for deregulation both at home and abroad. Demands for the removal of the ban on crude oil exports have continuously been raised ever since the ban was first enacted. In response to these demands, ban regulations were managed and maintained with a limited allowance of exports, as per the new exemption clause in the EAR, whenever the president decided a certain case benefitted national interest (Jae-kyung Kim, 2014).
Source: Byoungyun Lim (2015)
This rapid increase in the production of crude oil was brought about by the so-called ‘Shale Revolution’. Prior to the Shale Revolution, the oil resources in the shale layer had been limited in their development because the air space within the layer was exceedingly tight. However, the adoption of new technologies, such as horizontal drilling and multistage hydraulic fracturing, enabled the extraction of oil from the shale layer, which has led to a rapid increase in production of Light Tight Oil (LTO) in the Permian Basin (Texas), Eagle Ford (Texas), and Bakken (Montana, North Dakota, and part of Canada) oil fields, among others, since 2011.
Figure 2-4. Major Types and Uses of U.S.-produced Oil
Source: Bordoff et al. (2015)
Thanks to the adoption of new technologies, LTO production rose from 600,000 b/d in 2008 to 2.5 million b/d in 2012 and again to 4.2 million b/d in 2014. This also resulted in an increase of LTO in the total crude oil production from 38 percent in 2012 to 49 percent in 2014. In fact, the EIA (2015) stated that almost 90 percent of the increase in overall U.S.
crude oil production from 2011 to 2014 was due to an increase in the production of light sweet oil with an API gravity of 40 or higher (light oil) and a sulfur content of less than 0.5 percent (low sulfur).
Figure 2-5. Outlook on U.S. Crude Oil Production by Oil Type
Source: EIA (2014a); HIS (2014)
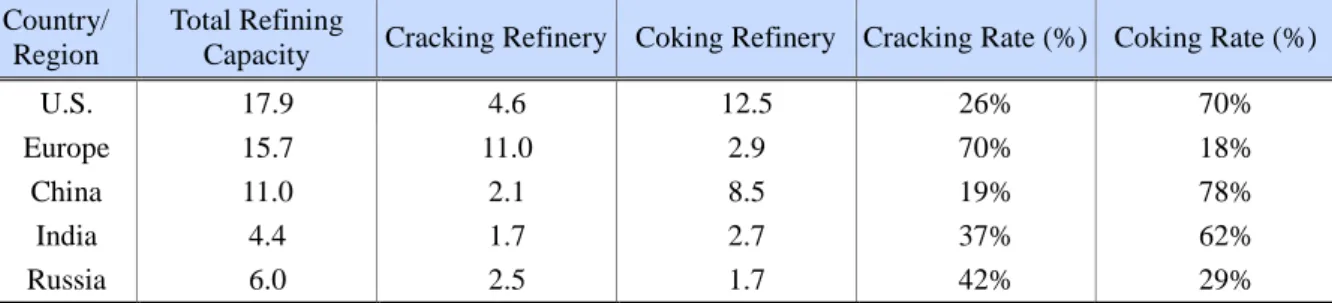
The U.S. refining system also maintains and operates a considerable number of advanced oil refineries.
Table 2-1. Major Oil Refining Facilities by Region Country/
Region
Total Refining
Capacity Cracking Refinery Coking Refinery Cracking Rate (%) Coking Rate (%)
U.S. 17.9 4.6 12.5 26% 70%
Europe 15.7 11.0 2.9 70% 18%
China 11.0 2.1 8.5 19% 78%
India 4.4 1.7 2.7 37% 62%
Russia 6.0 2.5 1.7 42% 29%
Source: HIS (2014), Jae-kyung Kim (2014)
Comparing the refinery systems of the U.S. and Europe, the European refining system is designed to process light sweet oil from the North Sea and northeast Africa, whereas the U.S. has invested heavily in processing relatively cheaper medium crude oil produced in Canada, Mexico, and Venezuela. As a result of these different focuses, the U.S. has a greater proportion of coking refineries. In particular, 60 percent or more of the refining facilities located within the PADD III region, which accounts for half or more of the U.S.’s overall refining capabilities (9.26 million b/d), have advanced upgrading facilities, including cokers that can produce light oil petroleum products. Over the years, in order to take full advantage of its upgrader facilities and enjoy a high refinery margin, the U.S. has imported and processed medium crude oil, mainly from Canada, Mexico, Venezuela, and the Middle East.
Figure 2-6. Crude Oil Refining and Coking Capacities by U.S. PADD Region
Note: The LTO production figures seen here are based on information published by the EIA (2014a). The tight oil production of PADD 2 was forecasted based only on the Bakken reserve, and the PADD 3 tight oil production was based on the actual production and outlook on crude oil at Eagle Ford and the Permian Basin.
Sources: EIA (2014a); Brown et al. (2014), Jae-kyung Kim (2014)
Since the U.S. refining system was optimized to process medium crude oil, mainly from Central America and Canada, its LTO refining and processing capabilities have historically been rather limited. As U.S. production of LTO increased rapidly in the early 2000s, the structural gap between the upstream and downstream components of the U.S. oil market led to an over-supply of LTO within the U.S.
Meanwhile, at least up until 2010, crude oil imported through the Gulf of Mexico and U.S. crude oil (particularly, Texas crude oil) were mainly transported to the crude oil trading hub9 at Cushing in Oklahoma. After the oil was collected at the hub, it was then transported to other regions, such as the Midwest. This flow of crude oil logistics created a certain relationship between Brent oil prices10 that represented international prices and WTI prices. The difference in the prices of the two oil types (Brent-WTI Spread) controlled the amount of crude oil imported to the U.S., and coordinated the balance of supply and demand of crude oil. In the long-term stationary relationship between the two oil types, the U.S.- produced WTI generally had a certain premium over international oil (Brent), at least until 2010.
However, due to the over-supply of domestic LTO, particularly to the Cushing crude oil trading hub, the volume of crude oil imported through the Gulf of Mexico and transported to the Cushing trading hub began to decline, while the transportation of crude oil from Cushing to the refining facilities located in the Gulf of Mexico began to increase. The unexpected change in the logistical flow of crude oil was coupled with the insufficient capabilities of transport infrastructures such as pipelines, which made matters worse. All of this resulted in an under-evaluation of oil prices at the Cushing hub (WTI prices), resulting in a discount against the price of international oil (Brent prices).
Figure 2-7. Trends in the Brent-WTI Price Spread (2010-2015)
9 The physical delivery of futures contracts of the West Texas Intermediate (WTI), which is listed on the New York Mercantile Exchange (NYME), is also carried out at the Cushing crude oil trading hub, and the WTI price is determined based on the trading volume and inventory at the hub.
10 In general, Brent oil prices are based on the FOB (Free on Board) of light sweet oil traded at the SullomVoe Terminal in Scotland.
The SullomVoe Terminal is a place of physical delivery of BOFE futures contracts listed on the London-based ICE (Inter- Continental Exchange).
Source: Petronet
가 가 가 가 Price gap
As seen in the chart above, the Brent-WTI Spread was $15.8/B in 2011 and $17.5/B in 2012, often spiking to $20/B during this same period. However, in the years that followed, improvements such as the installation of pipes and the use of railways were made to the crude oil transport infrastructure, and the Brent-WTI spread decreased to around $10.65/B.
Despite these improvements, the gap still remained at over $10 a barrel by 2015 (EIA, 2015). This erupted in frustrations over the devaluation of home-produced crude oil within the U.S. oil industry and led to calls11 to break away from the 1975 system created in response to OPEC’s restrictions in 1973 and shift to a new system through the lifting of the crude oil export ban.
2. Lifting the U.S. crude oil export ban
The demand to remove the ban on U.S. crude oil exports is directly related and came as a response to the rapid increase of LTO production that resulted from the Shale Revolution. Even as early as 2012, the American Petroleum Institute (API), an interest group representing the U.S. oil production industry, and the Energy Information Agency (EIA), an organization affiliated with the U.S. Department of Energy (DOE), began calling for the deregulation of crude oil exports. The issue was a topic of debate at the hearing of the U.S. Senate Committee on Energy and Natural Resources on January 30, 2014. From March 2014, government representatives (mainly Republicans) with constituencies in major crude oil producing regions (such as Alaska, Texas, North Dakota, and Oklahoma) led legislative activities12 in the U.S.
Congress to abolish the ban on crude oil exports.
In response to such strong demands from the oil industry, the U.S. government (particularly the Department of Commerce) began to permit limited crude oil exports. This was done in order to ease the over-supply of LTO within the U.S., while still maintaining the current legislation. On June 24, 2014, the BIS granted Pioneer Natural Resources and Enterprise Products Partners LP a license to export lease condensate on the condition that the lease condensate underwent a stabilization and light distillation process so that it could be classified as a refined petroleum product13. On December 30, 2014, the BIS drafted general guidelines that could be applied industry-wide and published these guidelines in the FAQs section of its website, paving the way for the limited but de facto liberalization of U.S. crude oil exports, limited only to lease condensate. After the publication of these guidelines, the limited export of lease condensate was then allowed starting from January 1, 2015. On October 28, 2015, the BIS granted an export license by state-owned Mexican Pemex that permitted the export of U.S. light crude oil in exchange for Mexico intermediate crude oil (75,000 B/d per
11 Although a discount on LTO prices may be a negative signal to the oil industry, it is a positive signal to the refinery industry. With the lifting of the export ban, the refinery industry risks suffering considerable potential losses, while the production industry risks decreased demands for crude oil stemming from a lack of investments by the refinery industry. This is the reason that the regulation of crude oil exports is such a controversial issue (Jae-kyung Kim, 2014).
12 Legislative activities were carried out to abolish regulations on U.S. crude exports and include legislative acts such as the American Energy Renaissance Act of 2014 (H.R.4286, S.2170) and the Crude Oil Export Act (H.R.4349).
13 As of July 2015, the EIA classifies lease condensate that has undergone a light distillation process as a ‘processed condensate’ in the
‘kerosene & light gas oils’ category of the petroleum product family.
year).
However, despite these concessions, the U.S. government was unable to assuage the demands of US oil producers. With the U.S. government facing increased pressure from the U.S. oil industry, bills calling for the abolishment of crude oil export regulations that had been caught in the deliberation process for quite some were once again carefully considered by both the House and the Senate beginning in July 2015. On July 31, 2015, the Offshore Production and Energy National Security Act of 2015 (OPENS) was passed by the U.S. Senate Committee on Energy and Natural Resources.
This was followed soon after by the passage of the H.R. 702 by the U.S. House Committee on Energy on September 17, 2015. The H.R. 702 was a bill submitted by the House of Representatives that abolished Section 103 of EPCA, the provision which banned U.S. crude oil exports. On October 1, the American Crude Oil Export Equality Act14, which was similar in content to the H.R. 702, was passed by the Senate Banking Committee. On October 9, 2015, the H.R. 702 was passed at the House plenary on October 9, 2015 with 261 votes for and 159 against15, raising the expectation that the liberalization of exports would be a real possibility within a year. However, right before the voting at the House plenary on October 7, 2015, then-President Obama officially announced that he was against the bill. This raised concerns that even if the bill were passed by the Senate, the president would then exercise his veto rights. If the bill were to be vetoed by the president, its passing would then require votes from at least two thirds of both chambers (290 representatives out of 435 registered representatives and 67 senators out of 100 registered senators) in a re-deliberation process to override the veto. This would also have required the agreement of the Democratic Party, which at the time was lukewarm regarding the lifting of the ban on U.S. crude oil exports. Following President Obama’s announcement, private negotiations began between the Republican and Democratic parties regarding the lifting of the export ban. As part of these negotiations, bills to extend tax benefits for renewable energy and financial assistance for energy conservation and water resources protection (benefits demanded by the Democrats for the 2016 budget bill) were drafted.
Finally, on December 18, 2015, the Consolidated Appropriations Act 2016, an omnibus spending bill that also lifted the ban on U.S. crude oil exports, was passed in both chambers. In contrast to Korea, the U.S. federal government budget does not adopt a quasi-budget system, and unless the twelve individual appropriations bills are passed by both federal chambers before the beginning of the fiscal year (October 1), the federal government goes into a shutdown. If every appropriations bill is not passed by both chambers by a predetermined date, in order to prevent a government shutdown, several appropriations bills are drafted into a single unified bill in the form of an omnibus appropriations bill, which is then voted on at the plenaries of the Senate and the House. Such omnibus-type of appropriations bills often include a bill that is not related to the appropriations bill but is rather one that the president is likely to veto. Since the president cannot take on the burden of a government shutdown, he or she is unlikely to exercise veto power in this scenario. This tactic is usually used as leverage in politics and politically motivated negotiations between the Democratic and Republican parties.
The Consolidated Appropriations Act 2016 was signed by President Obama and was promulgated into law, thereby ending the prohibition of U.S. crude oil exports that had been in place for forty years (since 1975).
14 The American Crude Oil Export Equality Act included provisions for the withdrawal of sanctions against Iran and the permission of U.S. crude oil exports.
15 As a reference, the composition of the U.S. House of Representatives when the H.R. 702 was passed was 245 Republicans and 188 Democrats; 235 Republicans and 26 Democrats voted in favor of the H.R. 702.
Section 3. Provisions in the Consolidated Appropriations Act 201616 lifting the ban on U.S. crude oil exports The Consolidated Appropriations Act 2016, which came into effect on December 18, 2015, is subdivided into Divisions A to P.17 The following four provisions addressing the lifting of the ban on U.S. crude oil exports are included in Section 101 (Title I) of Division O.
(1) Provision (a): Repeal of Section 103 of the Energy Policy and Conservation Act
(2) Provision (b): Stating that no official of the federal government shall impose or enforce any restriction on the export of crude oil (※complete liberalization of overseas exports of U.S. crude oil)
(3) Provision (c): A saving clause, this provision excludes bans on exports under certain laws18 from being subject to Provision (b) in order to prevent any infringement on the authority of the President under the Constitution, which is the higher law.
(4) Provision (d): Conditions that allow the President to impose or restrict export licensing requirements or impose other restrictions on U.S. crude oil exports:
(A) Conditions in which the President declares a national emergency
(The President formally declares a state of national emergency in the Federal Register) (B) Conditions of national security
(In the context of sanctions or trade restrictions imposed by the United States by the Executive Authority of the President or by Congress)
(C) Conditions in which the Secretary of Commerce, in consultation with the Secretary of Energy, finds and reports to the President that—
(i) The export of crude oil has caused sustained material oil supply shortages; or
(ii) Sustained oil prices significantly above world market levels due to U.S. crude oil exports
(Provided, the above condition must be directly attributable to the export of crude oil produced in the United States, and the supply shortages or price increases must cause or are likely to cause sustained material adverse employment effects in the United States)
It is important to note that the exceptional provision (C) (ii), despite its conditional clause, aims to ensure that in the long-term, U.S. oil prices (generally based on WTI prices) do not rise significantly higher than international prices (Brent prices). While the other exceptional provisions in Section 101 (Title I) of Division O are based on concerns over a lack of oil, reminiscent of the Oil Shock of the ‘70s, provision (C) allows for restrictions to be made due to price considerations, even without any problems in supply. The inclusion of this provision is a reflection of the U.S. government’s new recognition of affordable oil prices and their benefits as a valuable part of national interest that must be protected.
The direct cause of increased demands for the liberalization of U.S. crude oil exports was the relative devaluation (discount) of U.S. crude oil compared to international prices due to the oversupply of LTO. However, as mentioned above, the long-term stationary relationship between the two oil types provided a certain premium on U.S. crude oil over
16 Detailed information regarding the provision in the Consolidated Appropriations Act of 2016 lifting the ban on U.S. crude oil exports can be found in the study by Jae-kyung Kim (2016), conducted as part of this research.
17 Divisions A to L include provisions of the Appropriations Act, while Divisions M to O include provisions of the Freedom of Information Act, Cyber Security Act, and other laws related to the liberalization of crude oil exports. Division P includes laws related to the extension of tax relief.
18 Laws applicable to the saving clause of provision (C) include presidential regulations on emergency measures during a national crisis such as those found in the International Emergency Economic Powers Act, the National Emergencies Act, certain regulations of the EPCA (Title II, Part B), Trading With the Enemy Act, and restrictions on exports to countries subject to trade sanctions, such as state (or individual)-sponsors of terrorism.
international oil at least up until 2010. The reversal of this long-term stationary relationship was due to a prolonged over- supply of LTO, which occurred when U.S. refining systems were unable to process the increased volume of crude oil (mainly LTO) within the U.S. These past trends imply that any future changes in relative Brent-WTI prices (or U.S./international oil prices) also depend heavily on the production volume of crude oil in the U.S. Under the exceptional provision (C) (ii) outlined above, if the increased production of crude oil in the U.S. slows down or declines, there is a high possibility that the previous stationary relationship between Brent and WTI prices would be restored. Should this happen, the provision will lay the groundwork for another debate on the allowance or restriction of U.S. crude oil exports.
Chapter 3. Impact of Export Deregulation on the International Oil Markets Section 1. Drop in international oil prices due to higher production of U.S. LTO
From the time when the U.S. crude oil export ban was first instated up until it was lifted on December 18, 2015, all of the crude oil produced by the U.S. could only be consumed within its borders. Due to its relative isolation compared to other crude oil products, the only way for U.S. crude oil to have a direct impact on the international oil markets was through imports (as opposed to exports). Propelled by the increased production of LTO in 2011 and the years that followed, the U.S. secured a position as the world’s greatest crude oil producer; prior to this shift, however, the U.S. had been the world’s greatest importer of crude oil. Therefore, even when the export ban was still in full force, the over- supply of light sweet oil in the U.S. had the potential to impact the international oil markets (without U.S oil ever leaving U.S. soil) by reducing the U.S.’s import of similar products.
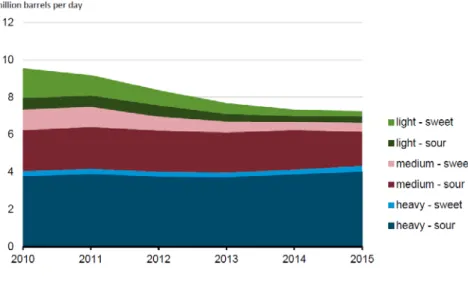
From 2010 to 2014, the total volume of U.S. crude oil imports declined by 1.9 million b/d. The drop in light sweet oil imports was the most pronounced; the annual import of light sweet oil in 2010 was 1.6 million b/d, including 1.2 million b/d of Western African crude oil, but was only 2014 338,000 b/d in 2014 (Western African crude oil 80,000 b/d) (EIA, 2015). As such, the light sweet oil that was once sent to the U.S., particularly from Western Africa, was forced to find other markets, such as the European market, where there was a higher demand for light sweet oil. However, in other markets, these oil producers had to compete with Brent oil, which shared similar characteristics.
Figure 3-1. Daily U.S. Import Volume of Crude Oil by Oil Type
Source: EIA (2015)
The increased production of LTO in the U.S. caused a chain reaction throughout the world oil markets and ultimately triggered the fall of Brent oil prices, which had been maintained at an average of $108.8/B until the first half of 2014, to an average of $48/B by the second half of 2015. Therefore, even prior to the lifting of the export ban in December 2015, the increased production of U.S. crude oil and resulting decrease in U.S. crude oil imports encouraged a policy shift in the global oil market.
Section 2. Estimated impact of the removal of the U.S. crude oil export ban 1. Arguments in favor of the removal of the U.S. crude oil export ban
Since the decline in U.S. crude oil imports had such an impact on the international market, many in the industry have also wondered about the short- and long-term implications of lifting the ban on U.S. crude oil exports. Ever since 2014 when the lifting of the ban on U.S. crude oil exports became a subject of debate, studies analyzing the effects of deregulation, such as ICF International (2014), IHS Energy (2014), Ebinger et al. (2014), and Duesterberg et al. (2014), have been presented as grounds to support the arguments of those in favor of removing the ban. In September 2015, in response to a formal request from the U.S. Senate, the Energy Information Administration (EIA) analyzed the effects of removing the ban and presented its findings in an Environmental Impact Assessment (EIA, 2015b). These studies typically explain the mechanisms of lifting the export ban and the impact of the ban removal on international oil markets as follows.
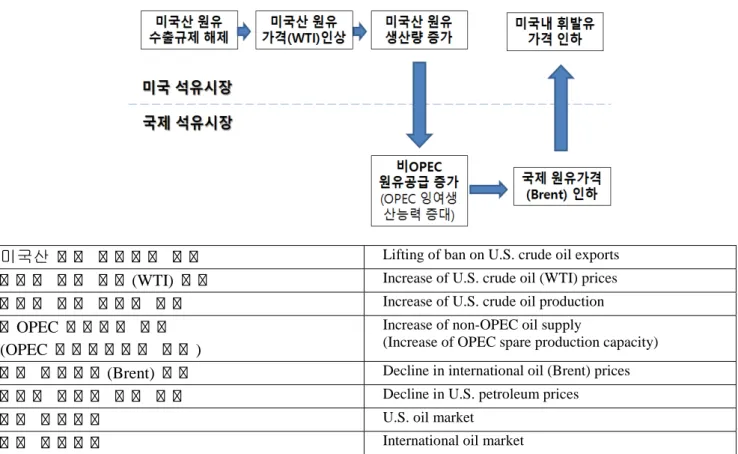
Figure 3-2. Simulated Mechanisms and Impact of Lifting the U.S. Crude Oil Export Ban
미국산 가 가 가 가 가 가 가 가
Lifting of ban on U.S. crude oil exports가 가 가 가 가 가 가
(WTI)가 가
Increase of U.S. crude oil (WTI) prices가 가 가 가 가 가 가 가 가 가
Increase of U.S. crude oil production가
OPEC가 가 가 가 가 가
(OPEC
가 가 가 가 가 가 가 가
)Increase of non-OPEC oil supply
(Increase of OPEC spare production capacity)
가 가 가 가 가 가
(Brent)가 가
Decline in international oil (Brent) prices가 가 가 가 가 가 가 가 가 가
Decline in U.S. petroleum prices가 가 가 가 가 가
U.S. oil market가 가 가 가 가 가
International oil marketWhen the ban on U.S. crude oil exports is removed, the crude oil (in particular, the light sweet oil representative of the WTI that was previously restricted to within the U.S.) will be released overseas, thereby effectively easing the problem of oversupply in the U.S. and resulting in a rise in U.S. crude oil (WTI) prices. The rise in U.S. crude oil prices will increase the production of U.S. crude oil, mainly LTO, which is relatively more resilient. The increase in U.S. crude oil production volume can also be interpreted as an increase in the supply of non-OPEC oil in the overall balance of the international oil market, which will contribute to the lowering of the international oil price (Brent oil price), which is determined by the balance of supply and demand within the international oil market. The lower international oil price and higher U.S. crude oil price will narrow the Brent-WTI Spread, and transaction costs will converge to within a certain range. The price of petroleum within the U.S. is connected to the international market and is determined by the price of international crude oil prices, and therefore, this will likely result in a decline in petroleum prices in the U.S. The mechanisms of this type of explanation serve to dampen public concern that lifting the ban will ultimately lead to a rise in petroleum costs within the U.S. and is designed to refute the arguments of the opposition.
The basic structures of the arguments presented by the above-mentioned studies are similar but vary to some extent.
Therefore, this study will examine the impact of lifting the U.S. crude oil export ban based on the analysis results of the EIA (2015b) given that it is a publicly-trusted national organization.
2. Official position of the U.S. EIA on the impact of the removal of the U.S. crude oil export ban
In order to understand the impact of the removal of the U.S. crude oil export ban on the international oil market, it is important to first understand the following two core exogenous factors from the standpoint of the U.S. oil industry:
international crude oil prices (Brent oil prices) and the crude oil production potential of the U.S. The price of Brent oil, which represents the international market price for crude oil, is determined by the supply and demand of crude oil not only in oil producing countries such as the U.K. and neighboring Europe, but also the entire world. Among a variety of determinant factors, global economic growth and the fuel efficiency policies of each country affect the demand for crude oil, while geo-political factors affect its supply. The level of crude oil production in the U.S. is also a part of the non- OPEC supply that determines the price of Brent oil, but because Brent oil prices are a reflection of the interaction between other factors, they can be seen as exogenous from the perspective of the U.S.
Meanwhile, the potential of crude oil production in the U.S. is determined by the state of oil resources and the progression of extraction technology. Increased oil resources can be achieved by discovering new, rich reserves through exploration, while advanced extraction technology can be realized through continued research and development. These two variables are relatively independent from one another, particularly when compared to policy variables such as the lifting of the export ban. The EIA (2015b) established assumptions for the two exogenous variables of U.S. oil production and Brent oil prices using the following four scenarios as shown in Table 3-1.
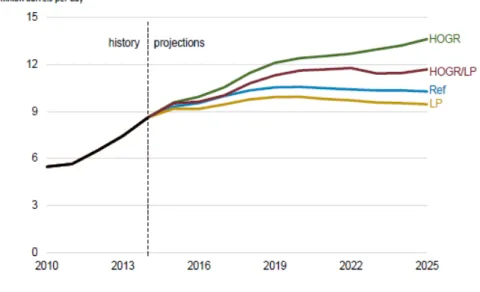
Table 3-1. Assumptions by Scenario for the Analysis of the Impact of the Removal of the U.S. Crude Oil Export Ban Scenario Assumptions (international oil prices and potential of U.S. crude oil
production) Reference
scenario (Ref)
Brent oil price ($/B): 57.5 (‘15) → 90 (’25)
U.S. crude oil production: 9.32 million b/d (‘15) → 10.28 million b/d (’25) Low price
scenario (LP)
Brent oil price ($/B): 50.5 (‘15) → 60 (’25) (Maintenance of low price trends)
U.S. crude oil production: 9.18 million b/d (‘15) → 9.46 million b/d (’25) Large oil and
gas reserve scenario
(HOGR)
Brent oil price ($/B): 57.5 (‘15) → 81 (’25)
U.S. crude oil production: 9.58 million b/d (‘15) → 13.63 million b/d (’25) Large oil and
gas reserve and low oil price
scenario (HOGR/LP)
Brent oil price ($/B): 50.5 (‘15) → 56 (’25) (Maintenance of low price trends)
U.S. crude oil production: 9.53 million b/d (‘15) → 11.69 million b/d (’25) Source: EIA (2015b), partly edited by author
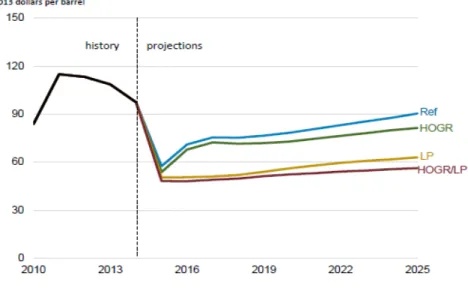
Figure 3-3. Assumptions of Trends in International Oil Prices (Brent Oil Prices) by Scenario (Ban Lifted)
Source: EIA (2015b)
Figure 3-4. Outlook on U.S. Crude Oil Production by Scenario (Export Regulations Maintained)
Source: EIA (2015b)
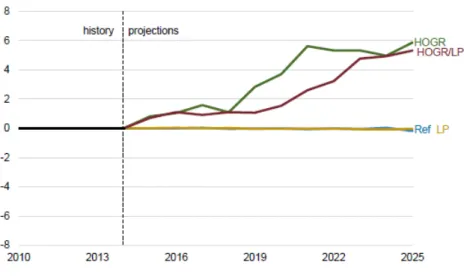
Each of the two conditions—the condition in which the ban on U.S. crude oil is lifted and the condition in which it remains in place—were used to analyze how the removal/maintenance of the ban would affect each of the different scenarios outlined above. Changes in the U.S. crude oil (WTI prices) immediately following the removal of the export ban have little impact and are unrelated to trends in international oil prices; this only holds true, however, if the production potential of U.S. crude oil remains a constant. However, if increased oil production is achieved at current production costs, the results change. In a scenario of increased oil production, if the international oil price (Brent oil price) is maintained at a low price (maintenance of $56/B by 2025), the price of U.S. crude oil is estimated to increase by
$1.55/B by 2020 and $5.32/B by 2025. Furthermore, in this same scenario, if the international oil price starts to rise (increases to around $81/B by 2025), the increase will be greater at $3.71/B by 2020 and $5.87/B by 2025 (EIA, 2015b).
Figure 3-5. Projected Rise of U.S. Crude Oil Prices (WTI Prices) Resulting from the Lifting of the Export Ban
Source: EIA (2015b)
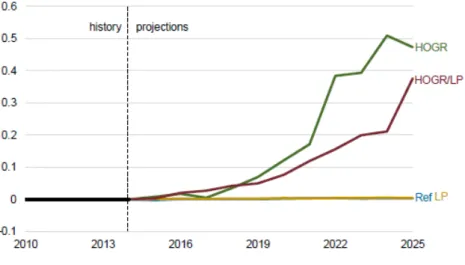
As previously mentioned, if the U.S. crude oil price (WTI price) responds to the removal of the ban on U.S. crude oil exports, the production of crude oil in the U.S. will increase. The price of U.S. crude oil, however, will remain unresponsive and unrelated to trends in the international oil price if the potential of U.S. crude oil production is maintained at its current level, and is estimated to have little impact on production volume. On the other hand, enhancements in oil production potential are estimated to lead to an increase in production by 80,000 b/d by 2020 and 380,000 b/d by 2025 if low oil prices are maintained, and 120,000 b/d by 2020 and 470,000 b/d by 2025 if oil prices begin to rise.
Figure 3-6. Projected Increase of U.S. Crude Oil Production Resulting from the Removal of the Export Ban
Source: EIA (2015b)
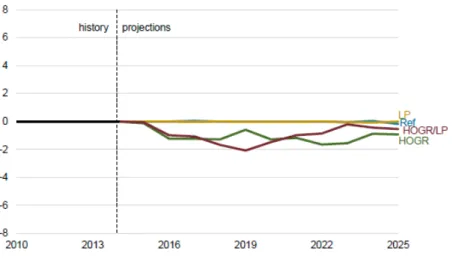
Figure 3-7. Projected Decline of International Oil Prices (Brent Oil Prices) Resulting from the Removal of the Export Ban
Source: EIA (2015b)
As such, the impact of removing the ban on U.S. crude oil exports on increased crude oil production within the U.S. is largely insignificant, and the rise in non-OPEC crude oil supply is expected to result in only a lukewarm response in terms of the international crude oil price (Brent oil price). Even if the international oil price was to rise and the U.S.
crude oil production potential was enhanced but the potential of U.S. crude oil production is maintained at current levels, the rise in the Brent oil price would not be more than $1.5/B.
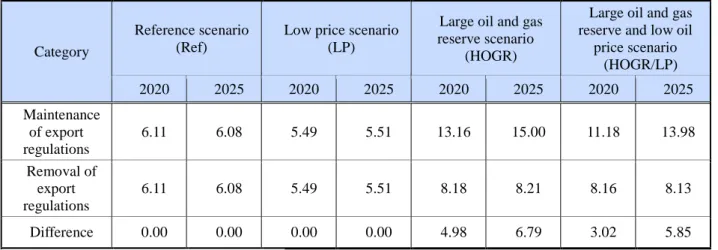
In the end, the difference between the lower international crude oil price (Brent oil price) and the higher U.S. crude oil price (WTI price), or the Brent-WTI Spread, is expected to gradually settle and balance out at $5.5~6/B if the U.S. crude oil production potential is maintained at its current level, and around $8/B if the U.S. crude oil production potential is enhanced.
If the crude oil production potential is maintained at its current level, the lack of a significant impact on the Brent-WTI Spread ($5.5~6/B) can be seen as the oil system structurally incorporating the overall costs of transporting crude oil from the Cushing trading hub to the Gulf of Mexico.
Table 3-2. Projected Changes in the Brent-WTI Spread Resulting from the Removal of the Export Ban
(Unit: $/B)
Category
Reference scenario (Ref)
Low price scenario (LP)
Large oil and gas reserve scenario
(HOGR)
Large oil and gas reserve and low oil
price scenario (HOGR/LP)
2020 2025 2020 2025 2020 2025 2020 2025
Maintenance of export regulations
6.11 6.08 5.49 5.51 13.16 15.00 11.18 13.98
Removal of export regulations
6.11 6.08 5.49 5.51 8.18 8.21 8.16 8.13
Difference 0.00 0.00 0.00 0.00 4.98 6.79 3.02 5.85
Source: EIA (2015b), partially edited by author
Figure 3-8. Projected Brent-WTI Spread Resulting from the Removal of the Export Ban