304
for Marine Environment and EnergyVol. 18, No. 4. pp. 304-309, November 2015
Original Article
형광 광도계 설계인자 도출을 위한 기름의 형광 스펙트럼 분석
오상우1,2 · 서동민2 · 안기영2 · 김재우2 · 이문진1 · 전태병1 · 서성규2,†
1
한국해양과학기술원 부설 선박해양플랜트연구소 해양안전연구부
2
고려대학교 전자 및 정보공학과
Oil Fluorescence Spectrum Analysis for the Design of Fluorimeter
Sangwoo Oh1,2, Dongmin Seo2, Kiyoung Ann2, Jaewoo Kim2, Moonjin Lee1, Taebyung Chun1 and Sungkyu Seo2,†
1
Maritime Safety Research Division, Korea Research Institute of Ships & Ocean Engineering, Daejeon 34103, Korea
2
Department of Electronics and Information Engineering, Korea University, Sejong 30019, Korea
요 약
해양에서 기름 유출 사고로 인한 오염도를 정량적으로 평가하기 위해서, 사고 현장에서 기름을 직접 탐지할 수 있는 센 서의 적용이 필요하다. 여러 형태의 기름 탐지 센서 중에서, 기름 성분에 의한 형광 현상(fluorescence)을 탐지 원리로 하는 센 서는 해수 중에 존재하는 기름의 농도를 측정할 수 있으므로 효용성이 높은 장점을 갖고 있다. 그러나 이런 종류의 센서는 기름의 형광 현상을 야기시키기 위해서, 수은 램프(mercury lamp)와 같은 자외선 광원(ultraviolet light source) 이 필요하고 다양한 종류의 광학 필터와 광전증배관(photomultiplier tube, PMT)과 같은 광학 센서가 주로 사용된다. 이 러한 이유로 형광 측정을 기반으로 하고 있는 센서는 측정 플랫폼의 크기가 크기 때문에 현장에서 원활히 사용하기 에 한계가 있으며, 고가의 부품들이 집적되어 있어, 센서의 가격이 높은 단점을 갖고 있다. 이러한 단점을 극복하기 위해 서, 본 논문에서는 소형의 크기와 가격 경쟁력을 갖고 있는 형광 광도계 기반의 기름 탐지 센서를 설계하는 방법에 대해서 제시하였다. 형광 광도계의 설계 인자를 파악하기 위한 방법으로, 본 연구에서는 5종의 원유 샘플과 3종의 정제유 를 이용하여, 기름의 여기 스펙트럼(excitation spectrum)과 발광 스펙트럼(emission spectrum)을 측정하였다. 여기 스펙트럼 과 발광 스펙트럼의 측정을 위해서는 형광 분광기(fluorescence spectrometer)를 이용하였고, 측정된 스펙트럼 자료 를 분석하여 형광 광도계(fluorimeter) 설계에 필요한 유종에 따른 공통 스펙트럼 파장 대역을 도출하였다. 본 실험 을 통해서 모든 종류의 기름 샘플의 경우, 여기 스펙트럼과 발광 스펙트럼의 최고 값을 갖는 파장의 차이는 약 50 nm인 것으로 파악되었다. 실험 중에서, 여기광의 파장을 365 nm와 405 nm로 고정하였을 경우, 280 nm와 325 nm로 고 정하였을 경우에 비해서 최대 발광(emission)의 세기가 작아지는 것을 확인할 수 있었다. 따라서 형광 광도계의 광 원 파장을 365 nm 또는 405 nm로 사용할 경우, 광학 센서의 민감도(sensitivity)가 발광되는 빛의 세기를 측정할 수 있도록 설계에 반영해야 할 것으로 판단된다. 본 연구의 실험에서 도출된 결과를 통해서, 기름 탐지를 위한 형광 광 도계의 광원, 광학 센서 그리고 광학 필터의 유효 파장 대역을 선택하는데 필요한 설계 인자를 파악할 수 있었다.
Abstract − To evaluate the degree of contamination caused by oil spill accident in the sea, the in-situ sensors which are based on the scientific method are needed in the real site. The sensors which are based on the flu- orescence detection theory can provide the useful data, such as the concentration of oil. However these kinds of sensors commonly are composed of the ultraviolet (UV) light source such as UV mercury lamp, the multiple excitation/emission filters and the optical sensor which is mainly photomultiplier tube (PMT) type. Therefore, the size of the total sensing platform is large not suitable to be handled in the oil spill field and also the total price of it is extremely expensive. To overcome these drawbacks, we designed the fluorimeter for the oil spill detection which has compact size and cost effectiveness. Before the detail design process, we conducted the experiments to measure the excitation and emission spectrum of oils using five different kinds of crude oils and three different kinds of processed oils. And the fluorescence spectrometer were used to analyze the excitation
†
Corresponding author: sseo@korea.ac.kr
and emission spectrum of oil samples. We have compared the spectrum results and drawn the each common spectrum regions of excitation and emission. In the experiments, we can see that the average gap between max- imum excitation and emission peak wavelengths is near 50 nm for the every case. In the experiment which were fixed by the excitation wavelength of 365 nm and 405 nm, we can find out that the intensity of emission was weaker than that of 280 nm and 325 nm. So, if the light sources having the wavelength of 365 nm or 405 nm are used in the design process of fluorimeter, the optical sensor needs to have the sensitivity which can cover the weak light intensity. Through the results which were derived by the experiment, we can define the important factors which can be useful to select the effective wavelengths of light source, photo detector and filters.
Keywords: Oil Spill Detection(유출유 탐지), In-situ Sensor(현장탐지 센서), Fluorimeter(형광 광도계), Fluorescence Spectrum( 형광 스펙트럼), Fluorescence Spectroscopy(형광 분석법)
1. Introduction
To evaluate the degree of contamination caused by oil spill accident in the sea, the in-situ sensors which are based on the scientific method are needed in the real site. Various kinds of in-situ sensors have been developed to detect the oil in the sea- water (Denkilkian et al.[2009]; MacLean et al.[2003]; Oh et al.[2011]; Oh and Lee[2012]; Oh and Lee[2013]). Among the sev- eral developed in-situ sensors for the monitoring of oil spill in the sea, the sensors which are based on the fluorescence detec- tion theory can provide the quantitative analysis result such as the concentration of oil (Chase et al.[2005]; Jocis and Vuoren- koski[2014]; Malkov and Sievert[2010]). These kinds of sen- sors commonly are composed of the ultraviolet (UV) light source such as UV mercury lamp, the multiple excitation/emis- sion filters and the optical sensor which is mainly photomulti- plier tube (PMT) type. Therefore, the size of the total sensing platform is large not suitable to be handled in the oil spill field and also the total price of it is extremely expensive. These lim- itations prevent the wide use of in-situ oil spill sensor when the oil spill accident occurs.
Whereas, in the biomedical application, various research groups have developed the eletro-optical sensors having com- pact size and low cost, to analyze the biomedical elements for the point of care (POC) (Jin et al.[2012]; Ozcan and Demirci[2008];
Roy et al.[2014]; Roy et al.[2015]; Seo et al. [2009]). To realize this aspect, they used the light-emitting diode (LED) as the light source and a lensless complementary metal-oxide semiconductor (CMOS) image sensor as the optical sensor for the analysis of biomedical elements such as blood cells. However, so far, the fluorescence detector for the purpose of in-situ oil spill sensing based on the UV light-emitting diode (LED) as the light source and a complementary metal-oxide semiconductor (CMOS) image sensor has not been demonstrated yet.
In this paper, we describe the design process of fluorescence
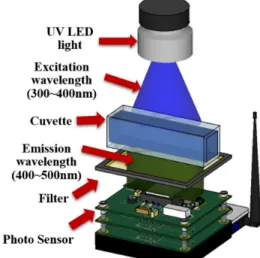
detector, specially focused on the selection of effective wave- length of light source, photo detector and excitation/emission filters. The planned platform of fluorimeter for the oil spill sensing is composed of the UV light-emitting diode (LED) as the light source and a complementary metal-oxide semiconduc- tor (CMOS) image sensor as the photo sensor for the evalua- tion of light intensity from the fluorescence phenomenon. A schematic of the proposed system in this paper is shown in Fig. 1.
The experiments in this research were conducted by using five different kinds of crude oils and three different kinds of processed oils. The fluorescence spectrometer were used to ana- lyze the excitation and emission spectrum of oil samples. We have compared the spectrum results and drawn the each common spec- trum regions of excitation and emission. Through this analysis process, we have defined the effective wavelengths of light source, photo detector and optical filters.
2. Material and Methods
2.1 Oil sample preparation
To draw the results of the excitation and emission spectrum,
Fig. 1. Schematic diagram of the fluorimeter for the oil spill sensing.
we have used five different kinds of crude oils and three dif- ferent kinds of processed oils. Five crude oil samples have the origins from Iraq, UAE, Qatar, Russia and Papua New Guinea.
The kinds of processed oils are bunker A, B and C. The oil sam- ples have processed by using water accommodated fraction (WAF) for the reproduction of oil-spilled condition in the sea (An et al.
[2014]; Singer et al.[2000]). WAFs were prepared for the every oil sample using the standard WAF method (An et al.[2014];
Singer et al.[2000]). The oil and filtered seawater were mixed with the ratio of 1:40 and stirred with the mixing speed of 130 rpm for 24 h. Seawater used in these experiments have been sampled in the coast of Incheon, Korea. The WAF processed oil samples have also extracted using Hexane. Extracted samples and non- extracted samples both have been analyzed using the fluores- cence spectrometer.
2.2 Fluorescence spectroscopy
The excitation and emission spectrum of processed oil samples have been measured by the fluorescence spectrometer (Fluoro- Mate FS-2, Scinco, Korea). We have carried out the measure- ment experiments three times for the single oil sample and used the average value. Ten different crude oil samples (Hexane- extracted five samples and non-extracted five samples) and six processed oil samples (Hexane-extracted three samples and non-
extracted three samples) with the same condition were measured using fluorescence spectrometer. To obtain the excitation and emission spectrum of oil samples, two different condition were taken in the fluorescence spectrometer. First condition was to find out the maximum value of excitation wavelength which causes the maximum fluorescence. So, in this condition, we can figure out the single value of excitation wavelength at which the emission of fluorescence occurs the maximum intensity of emission light. Otherwise, in the second condition, we can select and fix the excitation wavelength, and then the emission spec- trum can be deducted at that excitation wavelength. In the first several sets of experiments, we have measured the excitation spectrum which can occur the maximum fluorescence phenom- enon. In the second step of experiments, we selected and fixed the excitation wavelength which were reflected from the value of actual ultraviolet (UV) light source which can be considered at the design process of the fluorimeter. Through these two exper- iments, we compared the results and derived the correlation between the excitation and the emission wavelength.
3. Results and Discussion
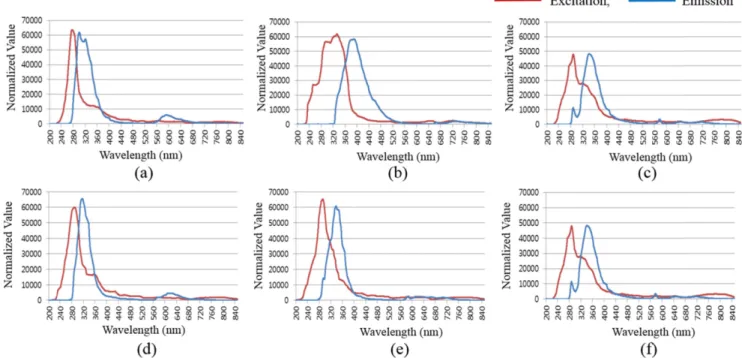
The excitation and emission spectrums of the processed oils are shown in Fig. 2. In this experiment, the excitation spectrum
Fig. 2. Excitation and emission spectrum graphs of processed oils in this experiment. The excitation spectrum was selected for the condition
of maximum fluorescence. (a) Excitation and emission spectrum of WAF processed bunker A oils. (b) Excitation and emission spectrum
of WAF processed bunker B oils. (c) Excitation and emission spectrum of WAF processed bunker C oils. (d) Excitation and emission spec-
trum of WAF processed bunker A oils extracted by Hexane. (e) Excitation and emission spectrum of WAF processed bunker B oils extracted
by Hexane. (f) Excitation and emission spectrum of WAF processed bunker C oils extracted by Hexane.
was selected for the condition of maximum fluorescence.
Fig. 2(a) and Fig. 2(d) show the excitation and emission spectrums of WAF processed bunker A oil and extracted WAF processed bunker A oil by Hexane, respectively. In the non- extracted oil sample, maximum wavelength of excitation for the fluorescence was 277.9 nm. And in the same sample, the maximum wavelength of emission was 300.6 nm. The gap between maximum wavelengths of excitation and emission is 22.7 nm.
Fig. 2(b) and Fig. 2(e) show the excitation and emission spec- trums of WAF processed bunker B oil and extracted WAF pro- cessed bunker B oil by Hexane, respectively. In the non-extracted oil sample, maximum wavelength of excitation for the fluorescence was 333.2 nm. And in the same sample, the maximum wave- length of emission was 390.3 nm. The gap between maximum wavelengths of excitation and emission is 57.1 nm. And in the Fig. 2(c) and Fig. 2(f), we can see the excitation and emission spectrums of WAF processed bunker C oil and extracted WAF processed bunker C oil by Hexane, respectively. In the non- extracted oil sample, maximum wavelength of excitation for the fluorescence was 288.3 nm. And in the same sample, the maximum wavelength of emission was 342.5 nm. The gap between maximum wavelengths of excitation and emission is 54.2 nm.
The difference between the experiment of non-extracted and Hexane-extracted oil samples is that the excitation and emission
spectrum peak of Hexane-extracted oil sample is sharper than that of non-extracted one. This aspect can be seen under the same condition in other experiments.
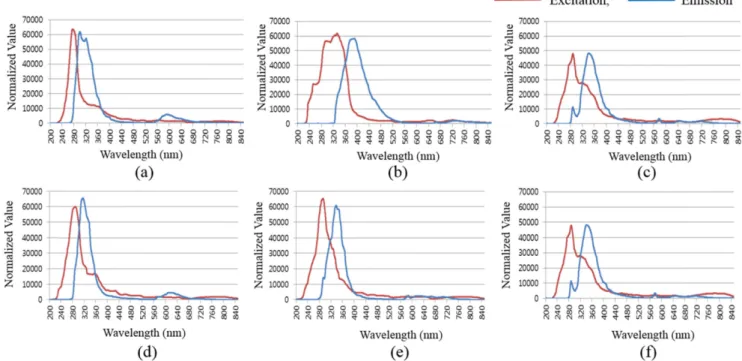
The excitation and emission spectrums of the crude oils is shown in Fig. 3. In the Fig. 3(a) and Fig. 3(d), we can see the excitation and emission spectrums of WAF processed crude oil from Iraq and extracted WAF processed crude oil from Iraq by Hexane, respectively. The gaps between maximum wavelengths of excitation and emission are 25 nm and 32.1 nm. Fig. 3(b) and Fig. 3(e) show the excitation and emission spectrums of WAF processed crude oil from UAE and extracted WAF processed crude oil from UAE by Hexane, individually. In the non-extracted oil sample, maximum wavelength of excitation for the fluores- cence was 293.9 nm. And in the same sample, the maximum wavelength of emission was 351.5 nm. The gap between max- imum wavelengths of excitation and emission is 57.6 nm.
And in the Fig. 3(c) and Fig. 3(f), we can see the excitation and emission spectrums of WAF processed Russian crude oil and extracted WAF processed Russian crude oil by Hexane, respectively. In the Hexane-extracted oil sample, maximum wavelength of excitation for the fluorescence was 288.6 nm.
And in the same sample, the maximum wavelength of emission was 337.4 nm. The gap between maximum wavelengths of exci- tation and emission is 48.8 nm.
Fig. 3. Excitation and emission spectrum graphs of crude oils in this experiment. The excitation spectrum was selected for the condition
of maximum fluorescence. (a) Excitation and emission spectrum of WAF processed crude oil from Iraq. (b) Excitation and emission spectrum
of WAF processed crude oil from UAE. (c) Excitation and emission spectrum of WAF processed Russian crude oil. (d) Excitation and emis-
sion spectrum of WAF processed crude oil from Iraq extracted by Hexane. (e) Excitation and emission spectrum of WAF processed crude
oil from UAE extracted by Hexane. (f) Excitation and emission spectrum of WAF processed Russian crude oil extracted by Hexane.
In the experiments of processed oil and crude oil, we can see the average gap between maximum excitation and emission peak wavelength is near 50 nm for the every case. And the excitation and emission spectrums’ shapes of Hexane-extracted oils are shaper than those of non-extracted oils. Hexane can extract polycyclic aromatic hydrocarbon (PAH) from the WAF processed oil sample. In this condition, PAH is the single component which can cause the fluorescence phenomenon and this component influences the shape of fluorescence spectrum.
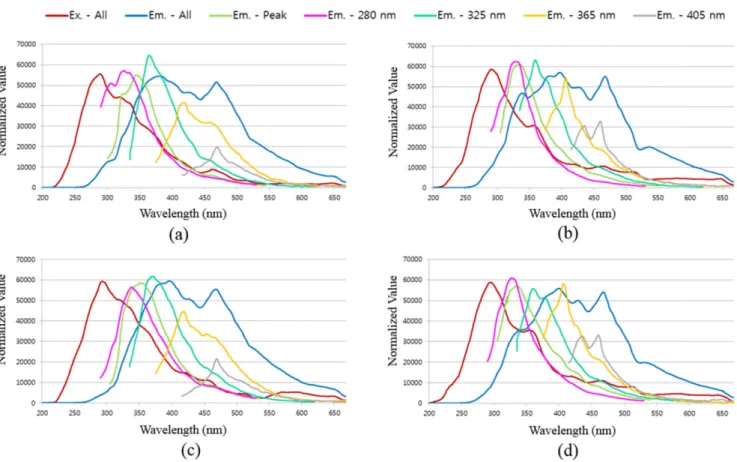
In the Fig. 4, the emission spectrums of crude oils which are the origins from Papua New Guinea and Qatar. In each exper- iments, the excitation wavelengths were fixed at 280 nm, 325 nm, 365 nm and 405 nm. So, we can see the four different emission spectrums at each fixed excitation wavelength. In the case of exper- iment which were used by non-extracted Papua New Guinea crude oil, the excitation wavelength which occurs the maximum inten- sity of emission light was 288.5 nm. However, it is quite difficult to use the UV light-emitting diode (LED) having the wavelength of 288.5 nm. So we selected and fixed the excitation wavelength for the use of light source. In the experiment which were fixed
by the excitation wavelengths of 365 nm and 405 nm, the inten- sity of emission was weaker than those of 280 nm and 325 nm.
So, if the light sources having the wavelength 365 nm or 405 nm are used in the design process of fluorimeter, the optical sensor needs to have the sensitivity which can cover the weak light intensity.
4. Conclusions
In summary, we conducted the experiments to measure the excitation and emission spectrum of oils using five different kinds of crude oils and three different kinds of processed oils.
The water accommodated fraction (WAF) method was applied in this experiment for the reproduction of oil-spilled condition in the sea. And the fluorescence spectrometer were used to ana- lyze the excitation and emission spectrum of oil samples. We have compared the spectrum results and drawn the each common spectrum regions of excitation and emission. In the experiments, we can see that the average gap between maximum excitation and emission peak wavelengths is near 50 nm for the every case.
Fig. 4. Emission spectrum graphs of crude oils. The excitation wavelengths are fixed at 280 nm, 325 nm, 365 nm and 405 nm, respectively.
The emission spectrums are shown at each fixed excitation wavelength. (a) Emission spectrum of WAF processed crude oil from Papua
New Guinea. (b) Emission spectrum of WAF processed crude oil from Papua New Guinea extracted by Hexane. (c) Emission spectrum of
WAF processed crude oil from Qatar. (d) Emission spectrum of WAF processed crude oil from Qatar extracted by Hexane.
In the experiment which were fixed by the excitation wavelengths of 365 nm and 405 nm, we can find out that the intensity of emission was weaker than those of 280 nm and 325 nm. So, if the light sources having the wavelength of 365 nm or 405 nm are used in the design process of fluorimeter, the optical sensor needs to have the sensitivity which can detect the weak light intensity. Through the results which were derived by the exper- iments, we can define the important factors which can be useful to select the effective wavelengths of light source, photo detector and filters.
Acknowledgements
This work was supported by the Korea Research Institute of Ships and Ocean Engineering (KRISO) Endowment-Grant (PES1870).
References


