저작자표시-비영리-변경금지 2.0 대한민국 이용자는 아래의 조건을 따르는 경우에 한하여 자유롭게
l 이 저작물을 복제, 배포, 전송, 전시, 공연 및 방송할 수 있습니다. 다음과 같은 조건을 따라야 합니다:
l 귀하는, 이 저작물의 재이용이나 배포의 경우, 이 저작물에 적용된 이용허락조건 을 명확하게 나타내어야 합니다.
l 저작권자로부터 별도의 허가를 받으면 이러한 조건들은 적용되지 않습니다.
저작권법에 따른 이용자의 권리는 위의 내용에 의하여 영향을 받지 않습니다. 이것은 이용허락규약(Legal Code)을 이해하기 쉽게 요약한 것입니다.
Disclaimer
저작자표시. 귀하는 원저작자를 표시하여야 합니다.
비영리. 귀하는 이 저작물을 영리 목적으로 이용할 수 없습니다.
변경금지. 귀하는 이 저작물을 개작, 변형 또는 가공할 수 없습니다.
Master of Business Administration
The Effect of Service and Product Quality on the Attitude and the Intention of Revisit
Graduate School of Business Administration The University of Ulsan
Business Administration Major
Umarov Abbos
The Effect of Service and Product Quality on the Attitude and the Intention of Revisit
Advisor: Professor Doyle Kim
A thesis
Submitted to
Graduate School of Business Administration The University of Ulsan
In partial Fulfillment of the Requirements for the Degree of
Master of Business Administration by
Umarov Abbos
Graduate School of Business Administration The University of Ulsan
Ulsan, Korea
August 2022
The Effect of Service and Product Quality on the Attitude and the Intention of Revisit
This certifies that the master thesis of Abbos Umarov is approved
Professor Kim, Ja-won
Committee Member
Professor Kim, Sang-won
Committee Member
Professor Kim, Doyle
Committee Member
Graduate School of Business Administration University of Ulsan
Ulsan, Korea
August 2022
ABSTRACT
Not only in Uzbekistan but also anywhere else in the world, companies, markets, retailers want to make profit. And for this they will have to increase sales. The sales volume of the product depends on the customers who visit the store. The more customers in the region visit the store and buy more products, the more the store will benefit.
When do customers buy a lot of products and revisit the store in such competitive conditions? The most important factor in answering this question is the quality of service and products. When the quality of products and services in a store is excellent and customers are treated well, then customers want to come back to the store to shop.
This means that the higher the quality of service and product quality of the store, the more likely the store will get customers to visit the store again, and the more products will be sold, the greater the profit.
Thus, the store should evaluate service quality and, if necessary, develop and implement ways to improve it. To do this, I conducted an observation in one of the local department store in my country. In other words, I conducted a survey of 150 buyers with questions to find out to what extent the quality of services and products of this department store satisfies the wishes and desires of buyers, and how the behavior of sellers affects the mood of buyers. I collected and analyzed all the data collected from the results of this observation. In this thesis, I will highlight my analysis and from the analysis I will learn how service and product quality affects customers’ attitude and intention of revisit to the department store.
C O N T E N T S
Abstract………..………i
Contents……….……….………...……….ii
C H A P T E R 1 I N T R O D U C T I O N … … … . . … … … . . . 1
1 . 1 R e s e a r c h b a c k g r o u n d a n d o b j e c t i v e s … … … . . . … … . . . … … … … . . . 1
1. 2 Organization of research paper………...……….…..2
C H A P T E R 2 T H E O R Y A N D L I T E R A T U R E R E V I E W… … … . 3
2.1 Service quality……….………..3
2.1.1 Evaluation of service quality………...….6
2.1.2 Possible instruments for service quality……….7
2.2 Product quality……….……….………8
2. 2.1 Possible instruments for product quality ………...….….. 12
2.3. Customers’ attitude and their intention of revisit………..……….…...12
CHAPTER 3 HYPOTHESIS AND RESEARCH MODEL………..13
3.1 Research Model ……….………..………...13
3.2 Research Hypothesis……….…………..13
C H A P T E R 4 M E T H O D O L O G Y A N D R E S U LT S … … … . . … . 1 5 4 . 1 E c o n o m e t r i c m o d e l … … … . . 1 5 4 . 2 E x p l a n a t i o n o f v a r i a b l e s … … … . . . … . . . 1 5 4 . 3 D a t a a n a l y s i s a n d r e s u l t s … … … . . … … . 1 6 4.3.1 Regression analysis………16
4.3.2 ANOVA analysis by demographic information……….………..…19
4.4 Hypothesis Testing………..……..24
CHAPTER 5 CONCLUSION……….……….………....25
5.1 Summary and managerial implication……….25
5.2 Limitations and suggestions for future study ……….….……...25
REFERENCES ………..………....….27
Appendix ……….…………..……….………..29
CHAPTER 1 INTRODUCTION 1.1 Research background and objectives
In any part of the world, companies, markets, retailers want to make profits. And for this they will have to increase sales. The sales volume of the product depends on the customers who visit the store. The more customers in the region visit the store and buy more products, the more the store will benefit.
When do customers buy a lot of products and revisit the store in such competitive conditions? The most important factor in answering this question is the quality of service and products. When the quality of products and services in a store is excellent and customers are treated well, then customers want to come back to the store to shop.
This means that the higher the quality of service and product quality of the store, the more likely the store will get customers to visit the store again, and the more products will be sold, the greater the profit.
Thus, the store should evaluate service quality and, if necessary, develop and implement ways to improve it. To do this, I conducted an observation in one of the local department store in my country. In other words, I conducted a survey of 150 buyers with questions to find out to what extent the quality of services and products of this department store satisfies the wishes and desires of buyers, and how the behavior of sellers affects the mood of buyers. I collected and analyzed all the data collected from the results of this observation. In this thesis, I will highlight my analysis and from the analysis we will learn how service and product quality affects customers’ attitude and intention of revisit to the department store.
1. To give a short review of related literatures for the relationship among service and product quality with attitude and intention of revisit.
2. To observe the impact of service and product quality to attitude and revisit by making a survey.
3. To offer some suggestions for future improvement of quality of service and products to make customers revisit the store.
Quality of sales service is a set of elements that determine the state of the material and technical base, the use of progressive methods of sales, the completeness and stability of the range, the time spent or the purchase and turnover of goods.
The service culture also includes a number of elements that describe the level and status of customer service in the sales area of the store. These include the stability of the range, the use of advanced forms of sales and additional services, the time spent
waiting for service, the assessment of customer service culture, good sanitation and beauty indicators. appearance trading platform and staff, compliance with established rules of sale and sale of individual goods, etc.
Thus, the sales service culture includes a set of quality characteristics of the sales service process and conditions to customers, as well as relevant indicators, the calculation of which allows us to assess the level of service.
Additional services include specific activities aimed at assisting customers in purchasing, delivering and using goods. All customer services can be divided into three groups:
1. Specified in the sales process;
2. Performed in the process of after-sales service;
3. Not directly related to the sale of specific goods.
So, a high level of customer service in stores is one of the forms of formation of the competitive advantage of the trading enterprise in the consumer market.
1.2 Organization of the research paper
To highlight objects mentioned above, this thesis arranged as follows: Chapter One goes ahead with the quick introduction and the determination of the research pursued by research motivations, research questions, and research approaches. Chapter Two includes literature reviews of previous researches and the underlying concept of determinants of a country’s image, resident satisfaction, and quality of life. Chapter Three presents the research design. Chapter Four describes the data, variables, measurements, collections, and results. Finally, Chapter Five provides conclusion, limitations and suggestion for future research..
CHAPTER 2 THEORY AND LITERATURE REVIEW 2.1 Service quality
Good service quality is important to attract and retain customers. Organizations, markets need to improve the quality of service in it and to prepare their vendors treating pleasantly for buyers.
Then they will have more customers, and as a result, their profits will be much higher.
In contemporary economy, service quality has received a considerable research attention in marketing literature (Teas, 1993). Substantial research has focused on the concepts of service quality associated with customer attitudes and satisfaction, and the measurement techniques of the service quality (Taylor and Cronin, 1992). Many academic literatures and books address variety of definitions and concepts about service quality and hypothesize a comparison of consumer expectations with performance. Parasuraman, Zeithaml and Berry (1985) defined service quality as perceptions resulting from a comparison of consumer expectations with actual service performance1. In addition, Severt et al. (2006) stated that service quality is a tool for how well the customer expectations are matched by the delivered service level and it is known that if the customer expectations are higher than the perceived performance, then it could affect the customer satisfaction negatively (cited by Parasuraman et al., 1985). In consonance with this, service quality can be seen as a bond that is created between the organization and its customers2 (Schneider & White, 2004). Even though there are many different definitions for what service quality is, the general consensus in the literature is that it is the discrepancy between the expectations and the perceptions of customers.
Like organizations that produce goods, even organizations that produce services play an important role in stimulating research and development of new things that separate services, schemes from competitors and create profitable market opportunities for capitalization. The quality that is created creates a limit to expectations, because users who have tasted the sweetness of world-class services expect the same from other organizations. Expectations lead to satisfaction or dissatisfaction. If marketers manage to meet the expectations of users, they will get satisfaction, and satisfaction will create ways to increase market share.
It should be noted that satisfaction with service quality is the result of expanding resources and activities to offer services against users ’expectations. It is also believed that service quality can be divided into technical quality and functional quality. To improve the quality of services
1 Parasuraman, Valarie, Zeithaml and Berry (1985)
2 Schneider & White, 2004
marketers offer service providers need to identify the causes of increased dissatisfaction among users and take appropriate measures (technical or functional) to minimize it.
Technical measures draw the attention to inventions and innovations in technology that help improve the quality of services. He prefers to have a technology-driven or technology-based service. Functional measures focus the attention on improving the quality of services provided by employees, which leads to work style, work culture, the formation of a useful package, employee behavior, and so on.
In defining the concept of service quality, one should always start with customers, because quality is the most important factor for customers and also leads to the achievement of service quality as the basis of their opinion.
Service quality is an important element in the development of a service product, as it affects the volume of demand for this service product, as well as the consumer profile of this service product. The most important means of positioning service providers and their offerings in the modern services market is the quality of these services.
The impact of quality service on the profitability and financial performance of a business is an important aspect to understand in service marketing. Service quality should be seen not only as a strategic force, but also as a key issue in service marketing management.
Service quality is an important source of sustainable competitive advantage as it contributes to continuous improvement in service efficiency through increased market share and profit growth.
This leads to increased financial results and sustainable competitive advantage.
The marketing strategy for quality-based services is sustainable because not all competitors can achieve the quality of service that consumers expect. Consequently, service companies that base their strategies on quality have an excellent reputation, and this feature of their quality is an obstacle in the development of competitive marketing strategies.
Service providers define and achieve quality of service, and consumers perceive quality in the process of service. Consumers' perception of moments of reality is directly reflected in the overall assessment of the quality of services, especially in services where deliveries are repetitive, which implies a highly professional approach to moments of reality, building long-term consumer relationships and focus on support.
Improving the quality of service and building long-term relationships with customers requires a good understanding of the moments of reality, i.e. the activities in them, as well as how they are perceived by customers.
Figure 2.1.1 – GAP model3
The GAP Service Quality Model helps the company understand customer satisfaction. In the service sector, the GAP model is widely used to understand the various differences that occur in the process of providing services to potential customers.
3 SERVICE QUALITY GAP MODEL SOURCE: A. PARASURAMAN, VALARIE A. ZEITHAM L, AND LEONARD L. BERRY
( 1 9 8 5 ) IN PERMATA ( 2 0 1 3 ) THE SEVEN GAPS ARE QUOTED BY FANDY TJIPTONO IN KAIHATU ( 2 0 0 8 ) , NAMELY:
A. GAP 1 , THE GAP BETWEEN CONSUMER EXPECTATIONS AND MANAGEMENT PERCEPTIONS : MANAGEMENT CANNOT ALWAYS FEEL WHAT CUSTOMERS WANT APPROPRIATELY.
The GAP model creates a roadmap for the entire service process and identifies the gaps between processes for the entire model to operate efficiently and effectively. This helps service providers to identify inefficiencies in the service process.
2.1.1 Evaluation of service quality
Excellent customer service is very important. In a highly competitive environment, companies that do not compete for quality customer service lose out to those who constantly satisfy customers and provide high quality service.
However, even companies that understand the need to provide exemplary experience have difficulty evaluating the quality of their services. It can be difficult to evaluate because it is an indicator of quality rather than quantity. Some researchers have even wondered how to measure service quality and understand how it affects customers.
Measuring and improving service quality can increase the organization's revenue and reputation.
Regardless of the industry, service quality can have a direct impact on a company's ability to meet customer needs while remaining competitive. Learning how to measure and improve service quality is a valuable skill, but it requires research and experience.
Generally, service quality measurement is entirely dependent on context and brand loyalty, and service quality measurements vary by industry. However, the industry standard and most common indicator is SERVQUAL.
SERVQUAL is based on a set of five parameters, which customers consistently rate as the most important for service quality, regardless of service area. These measurements, determined by the SERVQUAL measuring instrument4, are as follows:
Reliability: This refers to an organization's ability and consistency in performing a certain service in a way that satisfies its customers' needs. This process involves every step of customer interaction, including the delivery or execution of the good or service, swift and precise problem resolution and competitive pricing. Customers have a certain expectation of reliability in buying a specific product, and a company's success usually depends on its ability to meet those expectations.
Tangibility: This is an organization's ability to portray service quality to its customers.
There are many factors that give a company highly tangible quality, such as the appearance of its headquarters, its employees' attire and demeanor, its marketing materials and its customer service department.
4 SERVQUAL 5 dimensions. https://www.indeed.com/career-advice/career-development/service-quality
Empathy: Empathy is how an organization delivers its services in a way that makes the company seem empathetic with its customers' desires and demands. A customer who believes a company truly cares about their well-being is likely to be more loyal to that company.
Responsiveness: This is a company's dedication and ability to provide customers with prompt services. Responsiveness implies receiving, assessing and swiftly replying to customer requests, feedback, questions and issues. A company with high service quality always responds to customer communication as soon as possible which can often indicate the value a company places on customer satisfaction.
Assurance: Assurance is the confidence and trust that customers have in a certain organization. This is especially important with services that a customer might perceive as being above their ability to understand and properly evaluate, meaning that there has to be a certain element of trust in the servicing organization's ability to deliver. Company employees need to be mindful of earning the trust of their customers if they want to retain them.
These five SERVQUAL metrics are used to measure the difference between customer expectations for service quality and their perception of actual service. When used over time, the SERVQUAL tool helps clients to understand their expectations, their perception of specific services, and areas for quality improvement.
SERVQUAL has been used in a variety of ways, such as identifying specific service elements that need to be improved and focusing on training opportunities for service personnel.
The correct design of the elements used in the SERVQUAL tool has a lot of information at the element level and has a practical impact for the service manager.
Service quality indicators assessed by SERVQUAL should be adjusted for optimal performance across industries, including public and private sector applications.
SERVQUAL indicators are very reliable, but may not be able to accurately determine the five main parameters when used in different areas. Other measures, such as the Six Sigma model, should be considered as they can be used to determine the difference between service expectation and service perception.
2.1.2 Possible instruments for service quality
In my survey paper, I have written 22 instruments to evaluate service quality by customers. Now I want to show them here by categorizing in 5 dimensions of SERVQUAL.
Category 1: Tangibles
1. The department store has up-to-date equipment.
2. The department store’s physical facilities are visually appealing.
3. The department store’s employees are well dressed and appear neat.
4. The appearance of the physical facilities of the department store is in keeping with the type of services provided.
Category 2: Reliability
5. When the department store promises to do something by a certain time, it does so.
6. When you have problems, the department store is sympathetic and reassuring.
7. The department store is dependable.
8. The department store provides its services at the time it promises to do so.
9. The department store keeps its records accurately.
Category 3: Responsiveness
10.The department store tells customers exactly when services will be performed.
11.You receive prompt service from the department store’s employees 12.Employees of the department store are always willing to help customers.
13.Employees of the department store are not too busy to respond to customer requests promptly.
Category 4: Assurance
14.You can trust employees of the department store.
15.You feel safe in your transactions with the department store’s employees 16.Employees of The department store are polite.
17.Employees get adequate support from The department store to do their jobs well.
Category 5: Empathy
18.The department store gives you individual attention.
19.Employees of the department store give personal attention.
20.Employees of the department store know what your needs are.
21.The department store has your best interests at heart.
22.The department store has operating hours convenient to all their customers.
2.2 Product quality
Marketers develop products to meet the needs of their customers. The main attribute or characteristic of the products, products or services or a combination of both is the quality of the product.
In general, I can say that a product is of satisfactory quality if it satisfies the consumer/user. The consumer buys a product or service only if they meet his requirements.
Quality is the performance of a product in accordance with the manufacturer’s obligations to the consumer. Such an obligation may be explicit or implicit, for example, in the form of a written contract or in accordance with the expectations of the average consumer of the product. The performance of a product depends on the final function and service that the product must provide to the end user; consumer.
A product is only known to be a quality product if it meets various criteria to work for the consumer. In addition to physical criteria, there is also a service and time factor for quality. The same quality of physical performance must be available for a reasonable period of time. Thus, time is also an unnecessary aspect of quality.
In conclusion, quality is a key feature that consumers use to evaluate products or services. Thus, for everyone involved in the business, the overall needs of each consumer / user must be met, regardless of who the customer is and the market conditions, i.e. competition and especially the consumer.
The dimensions of quality (how quality is determined) includes the following:
• Performance: Primary product characteristics, such as the brightness of the picture
• Features: Secondary characteristics, added features, such as remote control
• Conformance: Meeting specifications or industry standards, workmanship
• Reliability: Consistency of performance over time, average time of the unit to fail
• Durability: Useful life, includes repair
• Service: Resolution of problems and complaints, ease of repair
• Response: Human – to – human interface, such as the courtesy of the dealer
• Aesthetics: Sensory characteristics, such as exterior finish
• Reputation: Past performance and other intangibles, such as being ranked first The following are the important steps for quality planning
Establishing quality goals.
Identifying customers.
Discovering customer needs.
Developing product features.
Developing process features.
Establishing process controls and transferring to operations.
Product quality is the most important parameter for a product, brand or organization. Quality determines the customer experience and repeat business. If the quality of the product is poor and the product cannot do its job reliably and safely, the brand image will be undermined.
Clients will not be able to redeem them and the overall market position will decrease.
Product quality can create or distort a brand in the market, so businesses should focus on product quality first. A poor quality product can also do the job, but customers will not be able to buy it back or trust it when it starts to show quality issues.
There are certain parameters5 that decide the overall product quality. These are:
1. Ability to meet stated needs
The first and foremost quality parameter is the ability of a product to perform its stated functions with accuracy and repeatability. For example, a microwave oven should perform basic reheating of food according to temperature settings and on a regular basis. If he accidentally reheats food, the quality will be poor.
2. Durability
Good products are always resistant to their intended service life. Good quality TVs are known to stay in homes for many years and decades. Even today, quality phones continue to work for many years. Durability is an important aspect of product quality, as well as customer acceptance.
3. Reliability
This item is a bit similar to the first item, but the reliability is that the quality is so good that consumers can trust it every time. Quality goods are always as reliable as cars and vehicles.
4. Efficiency
The quality of a product depends not only on the performance of the product, but also on how well it does its job or saves costs. Poor quality is often associated with high costs of operations and repairs.
High quality air conditioners work better than low quality products and consume less energy. Efficiency is a very important parameter in determining overall quality.
5. Safety
A good product always pays attention to the safety of the end user. Many products put a lot of emphasis on this and it helps them create a positive brand image in the market.
On the other hand, bad products cause problems and are poorly received.
5 https://www.mbaskool.com/business-concepts/marketing-and-strategy-terms/3231-product-quality.html
6. Finishing and build quality
A good product would always have proper finishing without rough edges or poor visual quality.
As an example, phones of good companies are often sleek in design and have good build quality and materials used as compared to low quality phones.
7. Packaging
An important parameter of the quality of a product can be its packaging. Good products have proper packaging, labels, instructions, and relevant branding and quality documentation.
Product quality needs to be regularly monitored and be improved based on market and customer feedback.
Some of the techniques6 used are:
• Process control
• Product control
• Six sigma
• Quality control
• Total quality maintenance
For instance, from the moment of packaging in a quality TV, it is properly marked, labeled and protected. All the necessary parts for installation come with the user manual a remote control is included, which is also quality.
The main TV block will have good construction quality and coverage. Once installed, productivity, picture, sound, features, integration work seamlessly and as expected.
To meet customer quality requirements, it is necessary to fully understand the interactive role of all the major activities of the organization. These actions, which are performed anywhere, together replace the Quality Functions. Thus, the quality function can be defined as a set of measures by which an enterprise can achieve a quality level, regardless of where it is implemented.
Thus, it can be concluded that quality function management typically requires the use of management, technical, and analytical conclusions based on observations, including statistical insights, on the core functions of the organization.
6 https://www.mbaskool.com/business-concepts/marketing-and-strategy-terms/3231-product-quality.html
2. 2. 1 Possible instruments for product quality
In my survey paper these instruments are written for determining the level of product quality and service quality by customers visited in the local department store:
• The product quality of the department store is good.
• The service quality of the department store is good.
Actually, there are three instruments, and the third one is overall satisfaction question that combined form of above mentioned 2 instruments.
2.3. Customers’ attitude and their intention of revisit
At Dale Carnegie, people believe that any increase in efficiency depends on two things: the way of thinking and the skill. Customer service initiatives often focus only on skill sets. Without thinking or attitude, it will be much harder to maintain a skill set and it will be easier to fall into indifference.
Customer service is a great way to add long-term value to customers. During this time, the organization shows the total amount of income that it can expect from one client. If customers have a positive shopping experience, they are more likely to buy again. It is also easier to sell new products to existing customers. Loyal customers trust products and services recommended by the sales and customer service team more because they already have a lot of experience.
Providing high-quality customer service involves understanding expectations, striving to move forward, and being an advocate for customers. Demonstration of support, sincere interest and respect influences the behavior of customers, turning them from indifference to loyalty. By offering quality customer service, marketers add value to the company's brand, enhance the reputation in the marketplace, and set an example of caring for the people who will buy the product or service.
Finally, it is much more pleasant to return home at the end of the working day with a positive attitude, less frustration and pride in the contribution to the result.
CHAPTER 3 HYPOTHESIS AND RESEARCH MODEL 3.1 Research Model
I set a research model as in figure 3.1. In other word, this model illustrates the impact of service and product quality attitude and intention of revisit. And each of these relations indicates hypotheses of my research.
Figure 3.1 Research model7 3.2Research Hypothesis
Here 22 instruments of service quality are categorized by 5 dimensions of SERVQUAL influenting to attitude. When people visit the store to shop some products, they look product quality, conditions, neat-clothed and well-treated sellers, after considering all of these factors, they form attitude of the store in their minds.
Other researchers note that service quality affects loyalty8 (Monsef et al., 2012), and also examines the effect of loyalty on loyalty behavior (Zeng and Zhang, 2008; Biscaia, 2013; Gecti,
7 My research model where service and product quality affecting on attitude, and attitude impacts on revisit
8 Monsef et al., 2012
2013; Yeng and Mat, 2013; Hosseini, 2013). As for the impact of service quality on behavior, the relationship is positioned as a mediator (Yeng and Matt, 2013). This finding suggests that there is a relationship between service quality, attitude, and loyalty behavior, and thus loyalty attitudes are expected to be a potential proxy variable. There is also research that describes how customer satisfaction is related to loyal attitudes and loyal behavior. Loyalty mediates the impact of customer satisfaction on loyalty behavior (Ouhna, 2013). So I proposed the following hypothesis.
H1: Service quality affects attitude of the store positively.
Good product quality can increase the decision of customers to purchase a product or service.
This is consistent with the results of a study by Shakharudin (2011), who found that the level of product decision-making is based on eight dimensions of frame quality and shopper buying behavior. So I proposed the following hypothesis.
H2: Product quality affects attitude of the store positively.
The attitude indicates a desire to buy the service rather than choosing other brands. This is measured as a repetitive purchase action by the buyer. Kotler and Keller (2012) believe that if consumers are satisfied, they will repeat the purchase of the service in the future. However, despite the fierce competition in the market, the buyer is still the deciding factor in the purchase decision. A loyal customer tends to purchase the same service, but there are many other options (Tjiptono, 2011). Customers loyalty can be seen in two dimensions: preference (customer choice) and willingness to defend (Biscaia, 2013; Hosseini, 2013). So I proposed the following hypothesis.
H3: Attitude affects the intention of revisit positively.
CHAPTER 4 METHODOLOGY AND RESULTS 4.1 Econometric model
Econometric models are statistical models used in econometrics. An econometric model defines a statistical relationship that is thought to exist between different economic quantities associated with a particular economic event. The econometric model can be derived from a deterministic economic model that is subject to uncertainty, or from an economic model that is itself stochastic. However, econometric models that are not linked to any economic theory can also be used.
In my case, linear regression econometric model is used. I highlight 3 econometric models below, that demonstrates regression between service quality, product quality, attitude and intention of revisit.
YA=β0+β1(XSq) (4.1.1)9
The above formula (4.1.1) is the econometric model showing degree of attitude affected by service quality. Here: β0 – an intercept of the model; β1 – parameter belonging to service quality;
YA – attitude of the store; and XSq – it is for service quality.
YA=β0+β1(XPq) (4.1.2)10
This second model (4.2.2) also is similar to the former one, it illustrates the degree of attitude by consumers too. However, there is an impact of product quality on the attitude of the store.
Actually, β0 and β1 are not the same with the first formula, now they are parameters of product quality; YA – attitude of the store; and XPq is for product quality.
YR=β0+β1(XA) (4.1.3)11
Now, it is turn for evaluating intention of revisit by the (4.1.3) formula. The model displays somewhat the degree of customers visiting to the store again by their attitude. In this formula also β0 and β1 parameters are different from β0 and β1 demonstrated in the formula of (4.1.1) and (4.1.2); YR – intention of revisit; XA – attitude of the store.
4.2 Explanation of variables
In the (4.1.1) and (4.1.2) formula, attitude of the store is a dependent variable. Nevertheless, attitude of the store independent variable reversely for the (4.1.3) formula.
9 Econometric model. Service quality affecting on attitude according to my survey
10 Econometric model. Product quality affecting on attitude
11 Econometric model. Attitude affecting on intention of revisit
Each customer treats it as a process leading to a repurchase that is expected to take place to meet their needs. The high interest of customers is mainly influenced by the close relationship between factors such as service, satisfaction and loyalty. When customers develop loyalty to a high-service brand, they are very involved in purchasing decisions and work very carefully.
Consumer engagement with a service brand can be based on their level of engagement, with consumers actively processing in response to marketing stimuli. Attitude includes constant repurchases/actual repurchases, holding a membership card, and positive verbal acknowledgment.
Moreover, the most important dependent variable of my model is intention of revisit.
When it comes to long-term customer retention, customer service comes first. If shoppers feel valued and have a positive shopping experience, they are more likely to shop from a department store again. Loyal customers are more likely to trust the products and services the store offers because they have a great experience.
Service quality and product quality are considered independent variables in (4.1.1) and (4.1.2) formula. When the quality is perceived by the consumer and meets or exceeds their expectations, this leads to profitability. Service quality is also defined as the degree or direction of the discrepancy between perceived quality and expectations. It can be seen that if the quality received is as expected, the quality of service will be positive and satisfy the customers.
However, if the accepted quality does not meet the expectations, the negative attitude of the customers to the service will lead to the loss of customers. Service quality is often defined as the difference between received and expected service.
4.3 Data analysis and results
The data collected around 150 often visiting customers in one of my local department store. In the survey, customers asked necessary questions about service and product quality, their attitude of the store and intention of revisit. SPSS software was used to analyze the data. In this chapter, I used regression analysis and one-way ANOVA analysis for hypothesis testing.
4.3.1 Regression analysis
In the beginning, to make the analysis more clear I should list common abbreviations in the data.
S1-S22 – service quality questions (found in survey material);
S23 – overall satisfaction of service quality;
SC1 – tangibles (a category of 5 dimensions);
SC2 – reliability;
SC3 – responsiveness;
SC4 – assurance;
SC5 – empathy;
P1-P2 – product quality questions;
P3 – overall evaluation of product quality;
AM – mean value of attitude results;
RM – intention of revisit mean value
Firstly, I need to get evaluations of 22 service quality questions by categorizing in 5 dimensions and mean value of evaluations of product quality questions, and regress them to mean value of attitude.
Table 4.3.1.112 – regression analysis of service and product quality to attitude of the department store Coefficients
Model
Unstandardized Coefficients
Standardized Coefficients
t Sig.
B Std. Error Beta
1 (Constant) .140 .174 .803 .423
SC1 -.117 .133 -.102 -.884 .378
SC2 .209 .131 .192 1.598 .112
SC3 .194 .134 .184 1.449 .150
SC4 .228 .135 .207 1.686 .094
SC5 .429 .101 .433 4.233 .000
PM .031 .107 .031 .293 .770
a. Dependent Variable: AM
One can see in table (4.3.1.1) that there are 2 significant values. SC4 has marginally significant level, 0.09, greater than 0.05 but smaller than 0.1, and SC5 has 0.0 significant level, it is smaller
12 regression analysis of service and product quality to attitude of the department store Model Summary
Model R R Square
Adjusted R Square
Std. Error of the Estimate
1 .918a .843 .836 .2228
a. Predictors: (Constant), PM, SC5, SC1, SC2, SC4, SC3
than 0.05. Assurance and empathy have 0.23 and 0.43 coefficients respectfully. In this regression table R square is 0,84. It means that service and product quality influencing up to 84%
to attitude.
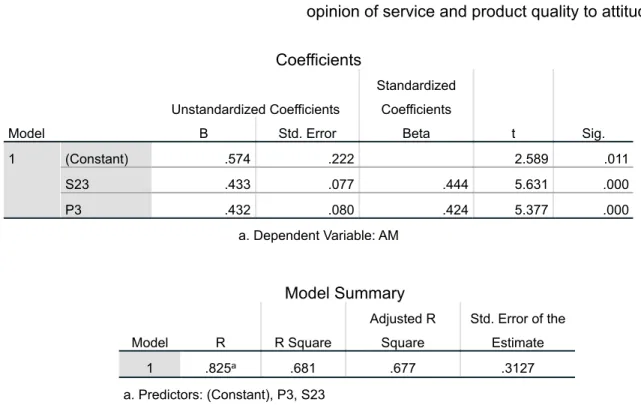
Secondly, I check the regression analysis of overall opinions of service and product quality to attitude.
Table 4.3.1.213 – regression analysis of overall opinion of service and product quality to attitude Coefficients
Model
Unstandardized Coefficients
Standardized Coefficients
t Sig.
B Std. Error Beta
1 (Constant) .574 .222 2.589 .011
S23 .433 .077 .444 5.631 .000
P3 .432 .080 .424 5.377 .000
a. Dependent Variable: AM
This analysis, in the table (4.3.1.2), shows both overall evaluation of service quality and overall evaluation of product quality significant. As their coefficients are similar, 0.433 for S23 and 0.432 for P3, they have similar impact on the attitude of the store by customers. The impact of overall evaluation of service and product quality to attitude of the store is 68%.
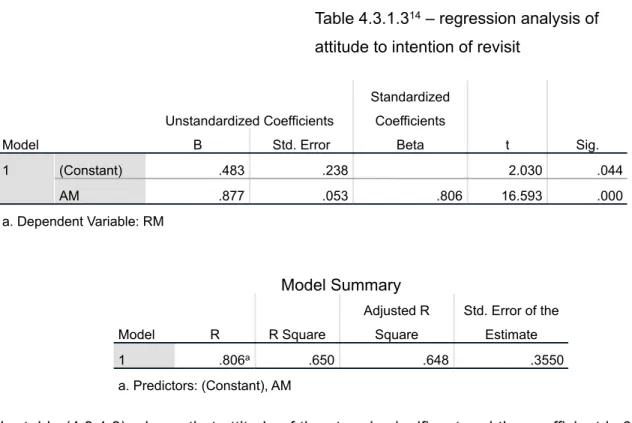
Thirdly, I analyzed regression to find out the attitude affect on intention of revisit in what coefficient below in the table (4.3.1.3)
13 regression analysis of overall opinion of service and product quality to attitude Model Summary
Model R R Square
Adjusted R Square
Std. Error of the Estimate
1 .825a .681 .677 .3127
a. Predictors: (Constant), P3, S23
Table 4.3.1.314 – regression analysis of attitude to intention of revisit
Model
Unstandardized Coefficients
Standardized Coefficients
t Sig.
B Std. Error Beta
1 (Constant) .483 .238 2.030 .044
AM .877 .053 .806 16.593 .000
a. Dependent Variable: RM
The table (4.3.1.3) shows that attitude of the store is significant and the coefficient is 0.877. As for R square, I can tell that attitude of the store by customers affecting on the intention of revisit by 65%.
4.3.2 ANOVA analysis by demographic information
The ANOVA test allows a comparison of more than two groups at the same time to determine whether a relationship exists between them. The result of the ANOVA formula, the F statistic (also called the F-ratio), allows for the analysis of multiple groups of data to determine the variability between samples and within samples15.
I make of use one-way ANOVA method. As factors, I use demographic informations. There are 5 types of demographic questions about customers: gender, age, education level, income and marriage status. As dependent variables, I use overall evaluation of service and quality, mean value of attitude and revisit. Because of existing 5 types of demographic questions, I have to test 5 times, and the above mentioned 4 dependent variables be the same for every test.
14 regression analysis of attitude to intention of revisit
15 https://www.investopedia.com/terms/a/anova
Model Summary
Model R R Square
Adjusted R Square
Std. Error of the Estimate
1 .806a .650 .648 .3550
a. Predictors: (Constant), AM
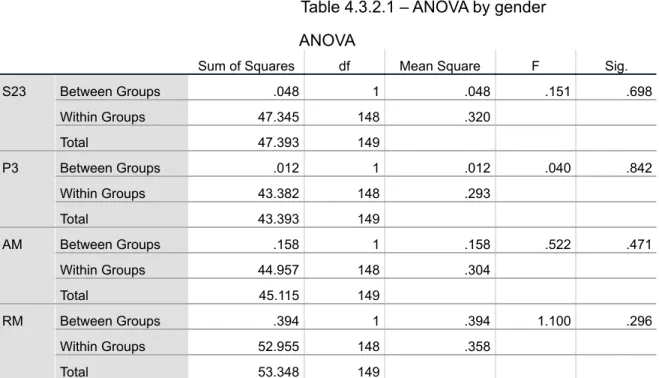
Table 4.3.2.1 – ANOVA by gender ANOVA
Sum of Squares df Mean Square F Sig.
S23 Between Groups .048 1 .048 .151 .698
Within Groups 47.345 148 .320
Total 47.393 149
P3 Between Groups .012 1 .012 .040 .842
Within Groups 43.382 148 .293
Total 43.393 149
AM Between Groups .158 1 .158 .522 .471
Within Groups 44.957 148 .304
Total 45.115 149
RM Between Groups .394 1 .394 1.100 .296
Within Groups 52.955 148 .358
Total 53.348 149
If I look at the table (4.3.2.1), there is not significant level around 0.05, thus I understand that overall evaluation of service and product quality, attitude and intention of revisit are not different according to gender.
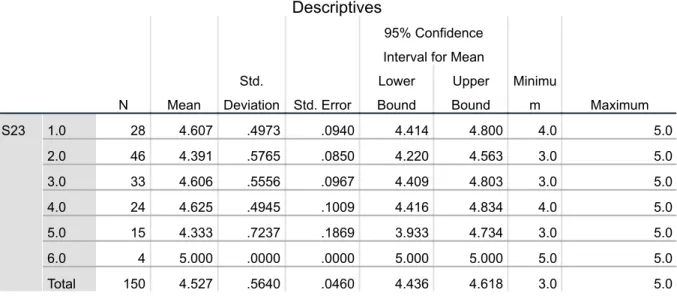
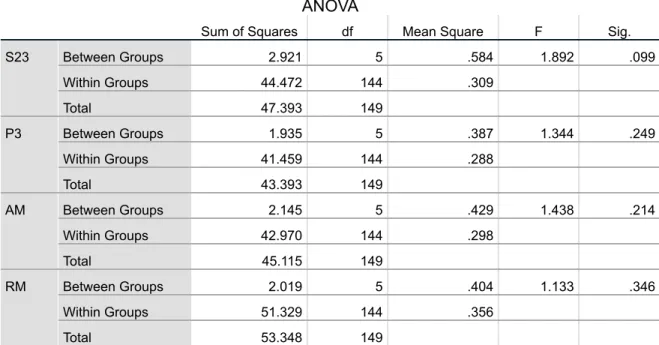
Table 4.3.2.2 – ANOVA by age Descriptives
N Mean
Std.
Deviation Std. Error
95% Confidence Interval for Mean
Minimu
m Maximum
Lower Bound
Upper Bound
S23 1.0 28 4.607 .4973 .0940 4.414 4.800 4.0 5.0
2.0 46 4.391 .5765 .0850 4.220 4.563 3.0 5.0
3.0 33 4.606 .5556 .0967 4.409 4.803 3.0 5.0
4.0 24 4.625 .4945 .1009 4.416 4.834 4.0 5.0
5.0 15 4.333 .7237 .1869 3.933 4.734 3.0 5.0
6.0 4 5.000 .0000 .0000 5.000 5.000 5.0 5.0
Total 150 4.527 .5640 .0460 4.436 4.618 3.0 5.0
ANOVA
Sum of Squares df Mean Square F Sig.
S23 Between Groups 2.921 5 .584 1.892 .099
Within Groups 44.472 144 .309
Total 47.393 149
P3 Between Groups 1.935 5 .387 1.344 .249
Within Groups 41.459 144 .288
Total 43.393 149
AM Between Groups 2.145 5 .429 1.438 .214
Within Groups 42.970 144 .298
Total 45.115 149
RM Between Groups 2.019 5 .404 1.133 .346
Within Groups 51.329 144 .356
Total 53.348 149
Table (4.3.2.2) indicates that I have only one marginal significant dependent variance, S23, overall evaluation of service quality. By looking at descriptive table, I can see that mean value in the 6 raw is 5, the highest evaluation. All survey participants at the age of above 60, I have 4 people, evaluated 5, maximum level for service quality of the department store.
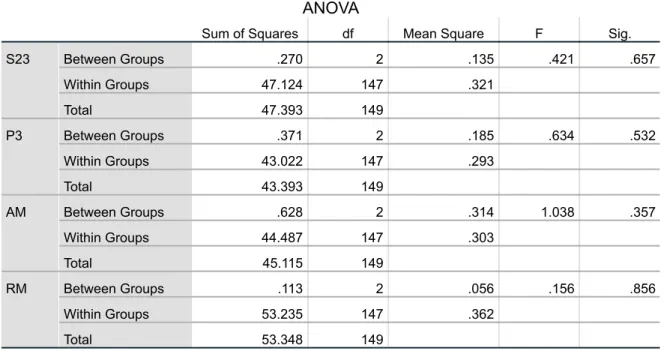
Table 4.3.2.3 – ANOVA by education ANOVA
Sum of Squares df Mean Square F Sig.
S23 Between Groups .270 2 .135 .421 .657
Within Groups 47.124 147 .321
Total 47.393 149
P3 Between Groups .371 2 .185 .634 .532
Within Groups 43.022 147 .293
Total 43.393 149
AM Between Groups .628 2 .314 1.038 .357
Within Groups 44.487 147 .303
Total 45.115 149
RM Between Groups .113 2 .056 .156 .856
Within Groups 53.235 147 .362
Total 53.348 149
In the table (4.3.2.3), here is no significant level. It means that high school or less, bachelor and master or above educated participants of the survey evaluated insignificantly the level of service and product quality, attitude and revisit of the store.
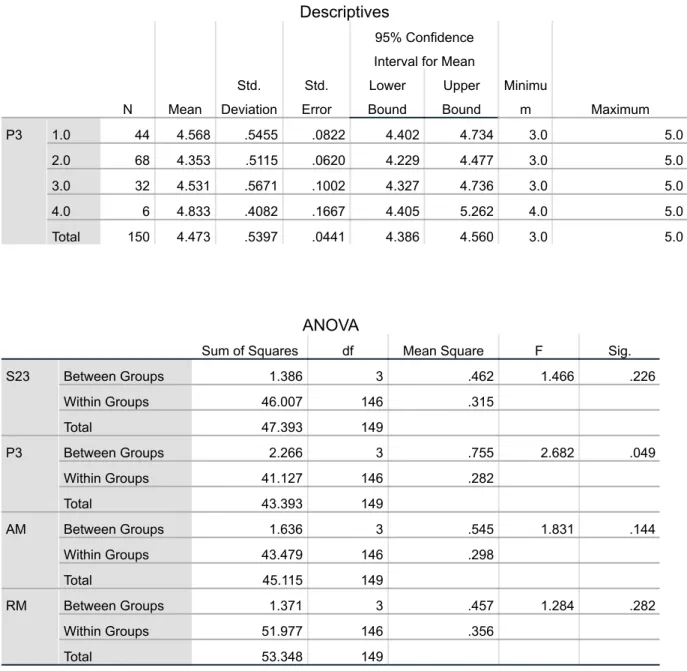
Table 4.3.2.4 – ANOVA by income Descriptives
N Mean
Std.
Deviation
Std.
Error
95% Confidence Interval for Mean
Minimu
m Maximum
Lower Bound
Upper Bound
P3 1.0 44 4.568 .5455 .0822 4.402 4.734 3.0 5.0
2.0 68 4.353 .5115 .0620 4.229 4.477 3.0 5.0
3.0 32 4.531 .5671 .1002 4.327 4.736 3.0 5.0
4.0 6 4.833 .4082 .1667 4.405 5.262 4.0 5.0
Total 150 4.473 .5397 .0441 4.386 4.560 3.0 5.0
ANOVA
Sum of Squares df Mean Square F Sig.
S23 Between Groups 1.386 3 .462 1.466 .226
Within Groups 46.007 146 .315
Total 47.393 149
P3 Between Groups 2.266 3 .755 2.682 .049
Within Groups 41.127 146 .282
Total 43.393 149
AM Between Groups 1.636 3 .545 1.831 .144
Within Groups 43.479 146 .298
Total 45.115 149
RM Between Groups 1.371 3 .457 1.284 .282
Within Groups 51.977 146 .356
Total 53.348 149
According to income level of customers, we have one with α=0.049, significant variance, P3 in the table (4.3.2.4). Comparing the descriptive table of product quality overall evaluation, I assure that customers with the income of $300-$799, have minimum (4,35) mean value of product quality evaluation, and customers with the income of $1600 or more, have maximum (4.83)
mean value of product quality evaluation. As an additional information, in my survey, there are 68 participants with the income of $300-$799, the highest part of 4 types of income level, and only 6 people with the income of $1600 or more, the lowest part.
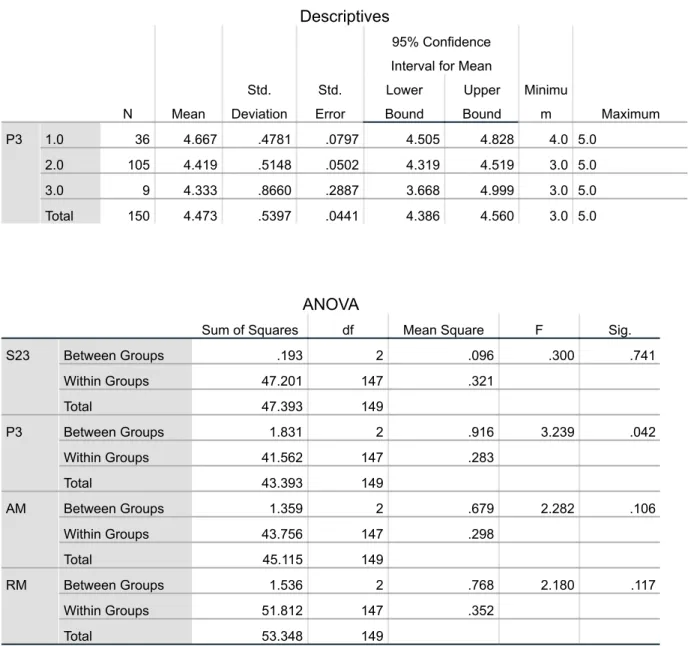
Table 4.3.2.5 – ANOVA by marriage status
Descriptives
N Mean
Std.
Deviation
Std.
Error
95% Confidence Interval for Mean
Minimu
m Maximum
Lower Bound
Upper Bound
P3 1.0 36 4.667 .4781 .0797 4.505 4.828 4.0 5.0
2.0 105 4.419 .5148 .0502 4.319 4.519 3.0 5.0
3.0 9 4.333 .8660 .2887 3.668 4.999 3.0 5.0
Total 150 4.473 .5397 .0441 4.386 4.560 3.0 5.0
ANOVA
Sum of Squares df Mean Square F Sig.
S23 Between Groups .193 2 .096 .300 .741
Within Groups 47.201 147 .321
Total 47.393 149
P3 Between Groups 1.831 2 .916 3.239 .042
Within Groups 41.562 147 .283
Total 43.393 149
AM Between Groups 1.359 2 .679 2.282 .106
Within Groups 43.756 147 .298
Total 45.115 149
RM Between Groups 1.536 2 .768 2.180 .117
Within Groups 51.812 147 .352
Total 53.348 149
I made 3 types of marriage status: single; married; and other type in the survey list.
Similar to ANOVA test by income above, here in the table (4.3.2.5) also P3 variance has significance with the level 0.42. So, comparing descriptive table of product quality, I know that there are 36 single participants; the highest volume, 105 participants of married; and 9 other type of participants. And their mean values of evaluation for product quality are 4,66/4,41/4,33
respectively. Here I determine that maximum evaluation of product quality made by single people.
4.4 Hypothesis Testing
I made 3 hypothesis. The first one is in the table (4.3.1.1). Considering t-value and significant level, I know that 2 sections of service quality have important impact on attitude. Hypothesis 1 is partially accepted. The next two hypotheses are fully accepted.
Second, H2, the product quality affects the attitude of the store.
The last, H3, the attitude affects the intention of revisit.
CHAPTER 5 CONCLUSION 5.1 Summary and managerial implication
To conclude, the results of this study indicate factors that influence the attitude of the department store from the two variables tested, service quality and product quality, both influence the attitude of the store positively. However, attitude itself makes a huge impact on the intention of revisit. This study provides information that the higher the service quality and product quality producing by the department store, the more positive attitude appears towards the department store by customers. And also, the more positive attitude appears towards the department store by customers, the higher probability to come back again to shop to the department store, this means that intention of revisit is the dependent on the attitude.
In my case, it derives from the analyzed data that there is no much difference on the male and female evaluations of four variables: service and product quality, attitude and revisit. When comparing by age, there is an interesting occurrence that all 60 and more aged participants liked the overall service quality completely. Because, they consist of the smallest part from other type of age, it is considered marginally significant. In the data collected by survey, there is no significant variable evaluated by education. This means education level does not solve to make a positive attitude for service quality or product quality. From non-educated to well-educated everybody may like the service and may visit again to buy product or service from the department store. Another valuable information from this analysis is in income section. It is noticeable that people who has average income, smaller evaluation of product quality comparing to others, and who has the highest income, their evaluation also is the highest.
Finally, according to marriage status, nevertheless there is the highest percentage of married people, single participants evaluated the product quality higher.
5.2 Limitations and suggestions for future study
This observation and analysis illustrates hypotheses that service quality and product quality affect the attitude, similarly, attitude affects the intention of revisit. But, there is some limitation too.
One of the factors is the price of service or product. Good service and fresh new products cost higher. Once the customer is happy with the service quality or product quality they buying and have a positive attitude towards the department store. however, their income is low, then they cannot revisit the store until they earn more income.
Another important limitation might be the location of the department store. I bring possible examples in here.
If the department store is located in villages where there are no many local residents, intention of revisit to the department store possibly be small amount. Because neighbor villages also like the department store, but their distance to the department store does not let them revisit often.
If the department store is built in seasonal places, like next to universities in the capital city or resting places on holiday, revisit be more when the season is on. But, the sales volume and revisit decreases drastically, nonetheless, the level of service quality and product quality satisfy the customers, when the season is off.
I made a conclusion of my conditions by observing in one of the local department stores. For more concrete and exact informations, there is a need to examine some other variables and more specific data to analyze.
REFERENCES
Ajzen, I. and Fishbein, M. 1980. Understanding Attitudes and Predicting Social Behavior. New York; http://www.getcited.org/pub/103368990.
Arbore, A.; Estes, Z. 2013. Loyalty Program Structure and Consumers’ Feeling Special in Grocery Store. Journal of retailing and consumer services, v. 20, p. 439-444.
Babakus, E.; Boller, G. W. 1992. An empirical assessment of the SERVQUAL scale. Journal of Business Research, 24 (3): 253-268.
Berry, L. L. 1986. Retail businesses are service businesses. Journal of Retailing, 62: 3-6.
Boeck, H.; Roy, J.; Durif, F.; Gregoire, M. 2011. The Effect of Percieved Intrusion on Consumers’
Attitude Towards Using an RFID-Based Marketing Program. Procedia Computer Science, v.5, p. 841-848.
Boisvert, J. A.; Nick, J. 2011. How Brand Innovativeness and Quality Impact Attitude Toward New Service Line Extension the Moderating Role of Consumer Involvement.Journal of service marketing, v. 25, n. 7, p. 517-527.
Edvardsson, B.; Thomasson, B.; Ovretveit, J. 1994. Quality of Service: Making It Really Work.
London, UK: McGraw-Hill.
Edy, Y.; Astuti, S.; Endang, I.; Utami, N. H. 2014. The effect of online service quality toward perceived risk, Customer attitudes. Relationship quality, onlice purchase intention, e- loyalty, and purchasing behaviour. Eropean Journal of Business and Management, v. 6, n.
22, p. 89-97.
Chih-Hsing, SamLiu, Tingko Lee. 2016. Service Quality and Price Perception of Service:
Influence on Word-of-Mouth and Revisit Intention. Journal of air transport management. V.
52, p. 42-54.
Lovelock, C. and Wirtz, J. 2011. Services Marketing. New Jersey: Pearson.
Mugiono. 2017. Service Quality’s Effect on Satisfaction, Attitude and Behavior. Management and Administrative Sciences Review. Volume 6. 51-64March
Nilsson, L.; Johnson, M.D.; and Gustafsson, A. 2001. The impact of quality practices on customer satisfaction and business results: product versus service organizations, J. Qual.
Manag., 6(1): 5-27.
OlgunKitapci, CeylanAkdogan, Ibrahim Taylan Dortyol. August 2014. The Impact of Service Quality Dimensions on Patient Satisfaction, Repurchase Intentions and Word-of-Mouth Communication in the Public Healthcare Industry. Procedia - Social and Behavioral Sciences. Volume 148. Pages 161-169
Parasuraman, A.; Zeithaml, V. A. and Berry, L. L. 1985. A conceptual model of service quality and its implications for future research. Journal of Marketing, 49 (4): 41-50.
Parasuraman, A.; Zeithaml, V. A. and Berry, L. L. 1988. SERVQUAL: a multiple-item scale for measuring consumer perceptions of service quality. Journal of Retailing. 64 (1): 12-40.
Ramdhani, A.; Alamanda, D. T.; Sudrajat, H. 2012. Analysis of consumer attitude using fishbein multi-attributes approach. International Journal of Basic and Applied Science, v. 1, n. 1.
Rust, R.T. and Oliver, R.L. 1994. ``Service quality: insights and managerial implications from the frontier'', in Rust, R.T. and Oliver, R.L. (Eds), Service Quality: New Directions in Theory and Practice, Sage, London, pp. 1-19.
Service quality and satisfaction: The moderating role of value Article in European Journal of Marketing. December 2000
Stafford, M. R.; Prybutok, V.; Wells, B. P. and Kappelman, L. 2011. Assessing the fit and stability of alternative measures of service quality. Journal of Applied Business Research, 15 (2):
13-30.
The Impact of Product Quality, Service Quality and Consumer Loyalty Program Perception on Retail Customer Attitude. September 2017. Independent journal of management &
Production 8(3):1116.
Internet sites:
https://www.businessmanagementideas.com/service-marketing/service-quality/20971 https://www.mbaskool.com/business-concepts/marketing-and-strategy-terms/3231-product-
quality.html
https://www.academia.edu/32061783/Service_Qualitys_Effect_on_Satisfaction_Attitude_and_B ehavior
https://www.sciencedirect.com https://www.investopedia.com https://www.statisticshowto.com https://www.indeed.com