저작자표시-비영리-변경금지 2.0 대한민국 이용자는 아래의 조건을 따르는 경우에 한하여 자유롭게
l 이 저작물을 복제, 배포, 전송, 전시, 공연 및 방송할 수 있습니다. 다음과 같은 조건을 따라야 합니다:
l 귀하는, 이 저작물의 재이용이나 배포의 경우, 이 저작물에 적용된 이용허락조건 을 명확하게 나타내어야 합니다.
l 저작권자로부터 별도의 허가를 받으면 이러한 조건들은 적용되지 않습니다.
저작권법에 따른 이용자의 권리는 위의 내용에 의하여 영향을 받지 않습니다. 이것은 이용허락규약(Legal Code)을 이해하기 쉽게 요약한 것입니다.
Disclaimer
저작자표시. 귀하는 원저작자를 표시하여야 합니다.
비영리. 귀하는 이 저작물을 영리 목적으로 이용할 수 없습니다.
변경금지. 귀하는 이 저작물을 개작, 변형 또는 가공할 수 없습니다.
Thesis of Master of Science
Resistance training attenuates the increase of skeletal muscle SPARC level in hindlimb
immobilized rats.
뒷다리를 고정한 쥐의 골격근에서 저항성 운동이 SPARC level의 증가를 완화시키는데 미치는 영향
By
Jun Seok Son
August 2016
Department of Physical Education College of Education
Graduate School of Seoul National University
ABSTRACT
Introduction: Secreted protein acidic and rich in cysteine (SPARC) is related to skeletal
muscle atrophy. Here, the effects of resistance ladder training on SPARC and examined SPARC expression during pre-training and following muscle atrophy in fast-type dominant muscle was investigated. Resistance exercise training would improve muscle quality and alleviate increased SPARC protein expression in the rat atrophy model was also hypothesized. Materials and methods: Male Sprague-Dawley rats underwent resistance ladder training for 12 weeks and hindlimb immobilization for 7 days. Grip strength and muscle cross section areas were measured. SPARC protein expression in the plantaris, soleus, and serum after exercise training and immobilization were then analyzed. Results: Resistance training affects body weight (P < 0.001) and skeletal muscle mass (Soleus; P < 0.01, plantaris; P < 0.05, gastrocnemius medialis; P < 0.05) as well as the grip strength (P < 0.001) in normal and atrophy conditions. In the plantaris, muscle atrophy after hindlimb immobilization was alleviated by resistance training (31.82%). SPARC level of plantaris muscle was also alleviated in atrophy-induced rats after exercise (P < 0.05). Conclusion: This study identified an association between resistance training and SPARC protein expression in atrophy-induced skeletal muscle.
Furthermore, a possible compensatory effect for SPARC protein expression in skeletal muscle was demonstrated. Thus, SPARC would be a useful therapeutic target to overcome muscular atrophy and sarcopenia.
Key words
Muscle atrophy, Muscle quality, Cross section area, Pre-training effect, Compensatory effect
Student number: 2013-21459
CONTENTS
I. INTRODUCTION ... 1
II. LITERATURE REVIEW ... 4
2.1. Skeletal muscle atrophy and resistance training ... 4
2.2. Secreted protein acidic and rich in cysteine (SPARC) ... 5
III. MATERIALS AND METHODS ... 8
3.1. Animals ... 8
3.2. Progressive resistance exercise protocol ... 9
3.3. Hindlimb immobilization ... 10
3.4. Intraperitoneal glucose tolerance test (IPGTT) ... 11
3.5. Grip strength test ... 12
3.6. SPARC protein analysis ... 13
3.7. Histological analysis ... 14
3.8. Tissue processing ... 15
3.9. Statistical analysis ... 16
IV. RESULTS ... 17
4.1. Resistance training affects body weight and skeletal muscle mass in normal and atrophied rats. ... 17
4.2. Resistance training improves skeletal muscle mass in normal and atrophied rats. ... 19
4.3. Hindlimb immobilization for a week does not affect the glucose tolerance. .. 21
4.4. Resistance training improves grip strength and muscle quality. ... 23 4.5. Resistance training alleviates the reduction in the mean cross section area after hindlimb immobilization. ... 25 4.6. Resistance training alleviates the reduction in distributions of cross section area after hindlimb immobilization. ... 27 4.7. Resistance training alleviates increasing SPARC expression in atrophy-induced model. ... 29 4.8. Association between changes in skeletal muscle SPARC level and physical factors. ... 31
V. DISCUSSION & CONCLUSION ... 32
REFERENCES………35
LIST OF TABLES
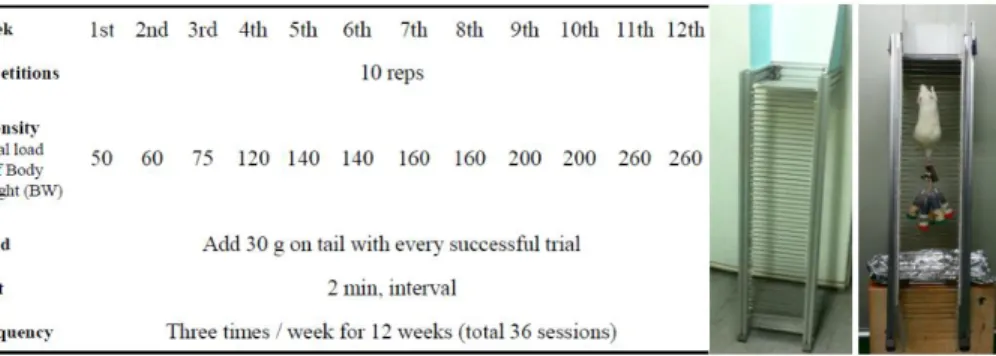
Table 1. Progressive resistance exercise protocol……….9 Table 2. Relative muscle mass in hindlimb immobilized rats………..……….20
LIST OF FIGURES
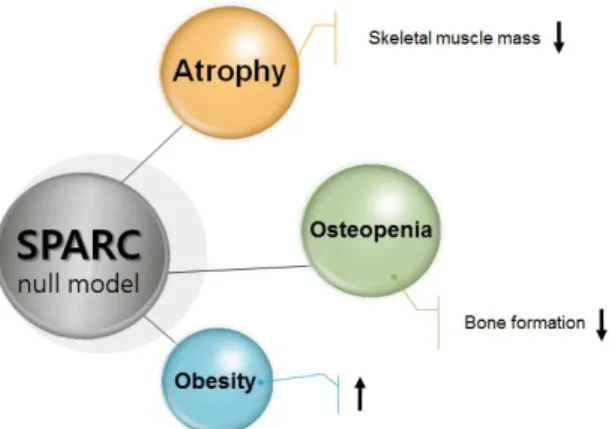
Figure 1. Role of SPARC………...5
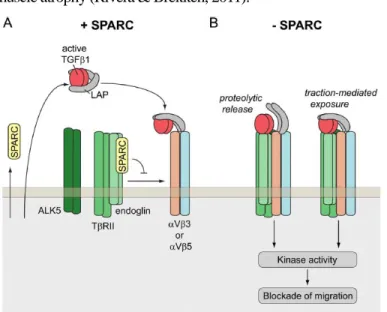
Figure 2. SPARC related TGF-β1 signaling………...6
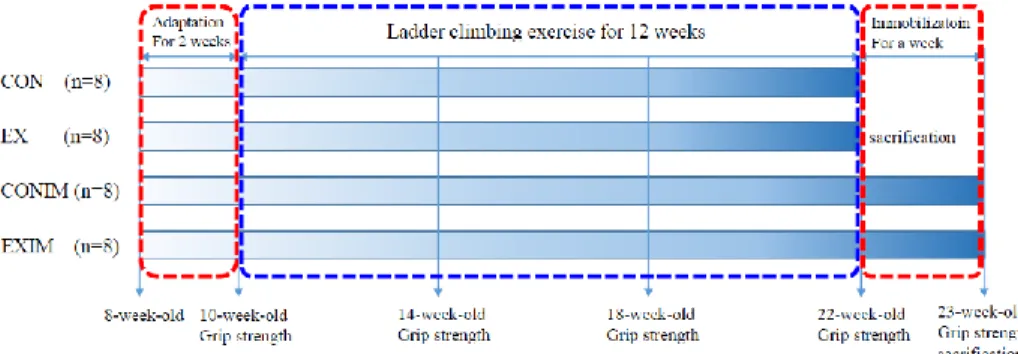
Figure 3. Experimental design………8
Figure 4. Hindlimb immobilization using cast bandage………...10
Figure 5. Forelimb grip strength test………..12
Figure 6. Extracted skeletal muscles………..15
Figure 7. Measurements of body weight in rats under normal and atrophy conditions...18
Figure 8. Measurements of relative muscle mass in rats under normal and atrophy conditions………...….19
Figure 9. Effects of resistance training on glucose tolerance in before and after hindlimb immobilization………....22
Figure 10. Effects of resistance training on forelimb grip strength and muscle quality……….24
Figure 11. Effects of skeletal muscle atrophy by hindlimb immobilization on myofiber cross sectional area (CSA)………26
Figure 12. Effects of skeletal muscle atrophy by hindlimb immobilization on myofiber distributions of cross sectional area (CSA)……….28
Figure 13. The effect of resistance training on skeletal muscle and serum SPARC levels and muscle atrophy……….….30
Figure 14. Efficiency of the hindlimb immobilized model to identify the effect of resistance training on the relationship between SPARC expression and muscle atrophy………...….31
LIST OF ABBREVIATIONS
ALK5: type II TGF-β1 receptor ANOVA: Analysis of variance BM-40: Basement membrane-40
ELISA: Enzyme-linked immunosorbent assay H&E: Hematoxylin and eosin
IPGTT: intraperitoneal glucose tolerance test
mTORC1: mechanistic target of rapamycin complex 1 MuRF1: Muscle RING-finger protein 1
SD: Sprague-Dawley rat siRNA: short interfering RNA siSPARC: siRNA transfection SPARC
SPARC: Secreted protein acidic and rich in cysteine TβRII: TGF-β receptor II
TGF-β: Transforming growth factor-β
I. INTRODUCTION
Skeletal muscle accounts for approximately 40% of the human body and plays key roles in physical movement and function (Braun & Gautel, 2011). Skeletal muscle mass is maintained by balancing anabolic and catabolic processes in muscle (Glass, 2003).
When the balance is broken, atrophy occurs because the rate of protein degradation exceeds the rate of protein synthesis (Mitch & Goldberg, 1996), including prolonged disuse and metabolic disorders such as glucose intolerance (Cohen, Nathan, & Goldberg, 2015; Lecker, Goldberg, & Mitch, 2006; Narici & de Boer, 2011). Hypertrophy of skeletal muscle can be induced by excess anabolism or by the secretion of myokines (Della Gatta, Garnham, Peake, & Cameron-Smith, 2014). Myokines, secreted from skeletal muscle, induce various anabolic functions when skeletal muscle is contracted during resistance exercise (Pedersen & Febbraio, 2012). These processes of skeletal muscle atrophy and hypertrophy are closely regulated by various hormones, growth factors, myokines (Sandri, 2008).
Secreted protein acidic and rich in cysteine (SPARC), also known as basement membrane-40 (BM-40) tumor protein or osteonectin, consists of a single polypeptide composed of three biological structural domains, an acidic N-terminal domain, a follistatin-like domain and a Ca2+ binding extracellular domain (Brekken & Sage, 2001;
Hohenester et al., 1996). SPARC belongs to a group of multifunctional matricellular proteins and functions to regulate cell-matrix interactions, cell adhesion, cell differentiation, angiogenesis and interactions with growth factors (Brekken & Sage, 2001; Kos & Wilding, 2010). According to a previous study, SPARC is associated with myofiber atrophy (Nakamura, Nakano, Miyoshi, Yamanouchi, & Nishihara, 2013).
SPARC inhibits transforming growth factor-β (TGF-β), which interacts with endoglin in a SPARC-endoglin complex. When SPARC does not inhibit endoglin bridging, TβRII/ALK5 associates with αV integrin-associated active TGF-β1, and atrogin-1 expression is increased, leading to muscle atrophy (Rivera & Brekken, 2011). Recently, an in vivo study showed that intramuscular injection mediated siRNA transfection (siSPARC) reduced SPARC levels in the tibialis anterior muscle (Nakamura et al., 2013).
In addition, skeletal muscle atrophy in SPARC null mice (Bradshaw, Graves, Motamed,
& Sage, 2003) caused osteopenia by decreasing bone formation (Delany et al., 2000) and increasing obesity (Bradshaw et al., 2003).
The beneficial effects of physical activity are well known in preventing musculoskeletal diseases and improving quality of life (Winklmayr et al., 2014). Among various types of physical activity, resistance training is an effective method for preventing muscle atrophy (Czerwinski, Kurowski, O'Neill, & Hickson, 1987; Falduto, Czerwinski, & Hickson, 1990) and loss of muscle function (Bento & Rodacki, 2014). A recent study reported an increase in the level of SPARC secretion from skeletal muscle in normal mice immediately after a single bout of exercise (Aoi et al., 2013). Moreover, regular low-intensity exercise significantly suppressed colon tumorigenesis in azoxymethane-induced colon cancer in mice (Aoi et al., 2013). Furthermore, SPARC serum levels were immediately increased in young healthy men after a single bout of exercise, and after 4 weeks of training (Aoi et al., 2013). However, SPARC levels did not change before the first bout and the last bout of exercise (Aoi et al., 2013).
Muscle atrophy caused by a loss of SPARC is especially notable in fast-type myofibers of the tibialis anterior muscle (Nakamura et al., 2013). This atrophy can be prevented by resistance exercise (Czerwinski et al., 1987), which may include a pre-
training effect that has been reported in studies of exercise before muscular atrophy and injury, such as muscular disuse atrophy in subjects with unimpaired neurologic systems (Baldi, Jackson, Moraille, & Mysiw, 1998; Lake, 1992). However, the effects of progressive resistance ladder training on SPARC expression in normal rats and immobilized hindlimb rats have not been reported. Therefore, the present study examined both the effects of resistance training on SPARC levels and effect of pre- training on SPARC expression in fast-type dominant muscles under atrophy conditions.
In present study, the effects of resistance exercise on SPARC and examined SPARC expression during pre-training and following muscle atrophy was investigated. This study considered the hypothesis as resistance training would improve muscle quality and alleviate increased SPARC expression in a rat atrophy model.
II. LITERATURE REVIEW
2.1. Skeletal muscle atrophy and resistance training
1) Background of atrophy-induced model
Skeletal muscle has been considered in innate characteristics of plasticity and adaptation capability (Barber, Scicchitano, & Musaro, 2015). When the loss of skeletal muscle has been occurred, postural and walking imbalance can cause injuries and other problems such as falls especially in elderly (Goodpaster et al., 2006; Horlings, van Engelen, Allum, & Bloem, 2008). The loss of skeletal muscle mass also causes imbalance of the protein secretion homeostasis (Powers, Morton, Ahn, & Smuder, 2016), which can cause metabolic disorders such as decreased glucose uptake in muscle and increasing muscle insulin resistance (Powers et al., 2016). Thus, the maintenance or enhancement of skeletal muscle mass as well as muscle strength has been considered in important countermeasures against skeletal muscle senescence (Horlings et al., 2008).
The skeletal muscle atrophy-induced animal models have been studied in conditions of decreased use such as hindlimb immobilization, spinal cord transection, hindlimb unloading, and aging (Cho, Kim, & Song, 2016). In present study, hindlimb immobilization was used to making atrophied skeletal muscle as a mimicking condition in traumatic injury of fracture.
2) The preventive effect of resistance training on muscle loss Skeletal muscle mass is maintained by balance between anabolism and catabolism of skeletal muscle (Glass, 2003). When the balance is broken, skeletal muscle can be occurred to hypertrophy or atrophy (Mitch & Goldberg, 1996). Resistance training has
been suggested as an important solution for preventing skeletal muscle atrophy (Adams, Haddad, Bodell, Tran, & Baldwin, 2007). Recently, combined isometric, concentric, and eccentric resistance exercise prevents unloading-induced muscle atrophy in rats was reported (Adams et al., 2007). This study suggested that resistance exercise provides an effective stimulus in anabolic and myogenic processes in response to muscle atrophy. In present study, 12 weeks of resistance training was applied to preventing muscle loss for a week (Son et al., 2015).
2.2. Secreted protein acidic and rich in cysteine (SPARC)
Figure 1. Role of SPARC (Bradshaw et al., 2003; Delany et al., 2000)
Secreted protein acidic and rich in cysteine (SPARC), also known as osteonectin and basement membrane (BM) – 40, was reported a matricellular protein expressed during angiogenesis (Lane, Iruela-Arispe, Johnson, & Sage, 1994). SPARC has also been considered in important roles to migration, proliferation, and differentiation (Motamed et al., 2003). In a recent decade, SPARC has been reported in two kinds of subjects such as SPARC related with metabolic diseases (Kos & Wilding, 2010) and suppression of
various types of tumorigenesis (Arnold & Brekken, 2009). Skeletal muscle atrophy in SPARC null mice caused osteopenia by decreasing bone formation (Delany et al., 2000) and increasing obesity (Bradshaw et al., 2003) (Fig. 1). Furthermore, it was recently reported that loss of SPARC in mouse skeletal muscle causes myofiber atrophy (Nakamura et al., 2013).
3) Transforming growth factor-β1 (TGF-β1) signaling and skeletal muscle atrophy
According to a previous study, in vivo short interfering RNA (siRNA)-targeting inhibited SPARC expression (siSPARC) caused decreases in the myofiber diameter and upregulation of atrogin-1 and transforming growth factor-β (TGF-β) signaling (Nakamura et al., 2013). In SPARC related TGF-β signaling, TGF-β receptor endoglin- interacted SPARC inhibited pericyte migration by the SPARC-endoglin complex (Fig.
2A). When SPARC does not inhibit endoglin bridging, TβRII/ALK5 associates with αV integrin-associated active TGF-β1 (Fig. 2B), and atrogin-1 expression is increased, leading to muscle atrophy (Rivera & Brekken, 2011).
Figure 2. SPARC related TGF-β1 signaling (Rivera & Brekken, 2011)
4) Exercise and SPARC
A novel exercise-induced myokine, SPARC, was recently reported by comparing the microarray data from ex vivo experiments (Aoi et al., 2013). Identification of SPARC was performed to compare the muscle tissue transcriptome in sedentary and exercised young and old mice. However, there was no significant difference in the plasma level of SPARC of sedentary and exercised mice, which finding was suggested that exercise- induced SPARC expression in skeletal muscle does not affect the circulating level at rest (Aoi et al., 2013). In secretion of SPARC after a single bout of exercise in mice, the level of SPARC in gastrocnemius muscle was significantly upregulated and the plasma SPARC level showed that it was increased immediately and then gradually returned to the pre-bout of exercise level within 6 hours. In a single bout of cycling study of human, serum SPARC was also increased immediately in young healthy adults. However, the serum SPARC levels were also decreased gradually until baseline at the same with the animal study (Aoi et al., 2013). In additional intervention study of chronic aerobic training, 4 weeks of training promoted the serum level of SPARC (Aoi et al., 2013). In contrast, 12 weeks of resistance ladder training of rats did not affect the change of SPARC levels in skeletal muscle and serum (Son et al., 2015).
III. MATERIALS AND METHODS
3.1. Animals
Male Sprague-Dawley (SD) rats (8-week-old) were handled in accordance with the principles and guidelines established by the college of veterinary medicine animal laboratory in Seoul National University (SNU). The rats were fed rodent chow 5057 (Purina Korea, Seoul, Korea) and kept at 22±2℃, 40-50% humidity, on a 12:12-hr light- dark cycle. Rodents were divided into 4 groups: control (CON, n=8); exercise (EX, n=8);
control immobilized (CONIM, n=8); and exercise immobilized (EXIM, n=8) (Fig. 3).
All experimental methods were approved by the Seoul National University Institutional Animal Care and Use Committees (SNU IACUC; SNU-121210-3-1).
Figure 3. Experimental design
3.2. Progressive resistance exercise protocol
The resistance ladder climbing exercise protocol was applied from Hornberger’s ladder training apparatus (Hornberger & Farrar, 2004), and modified to bring about increased skeletal muscle mass. Our protocol consisted of 12 weeks, 10 sessions a day, 3 days per week. An initial adaptation was performed so that rats could become familiarized with the ladder (1.1 X 0.25 m, 2 cm grid, 85° incline) for 2 weeks.
Adaptation to ladder climbing was achieved by only using the body weight or a clip attached to the tail for 10 sessions a day, 5 days a week. After the 2 week adaptation period, the exercise group worked out the ladder with a weight target % of their body weight, and if animals were able to lift the target, 30 g of weight was added at the next session for 10 sessions over 12 weeks. Following a failure, rats practiced climbing with the previous weight for up to 10 sessions. The maximal weight – 340% of body weight in the last session– based on a pilot test that demonstrated increased muscle mass with this intensity of training was determined.
Table 1. Progressive resistance exercise protocol
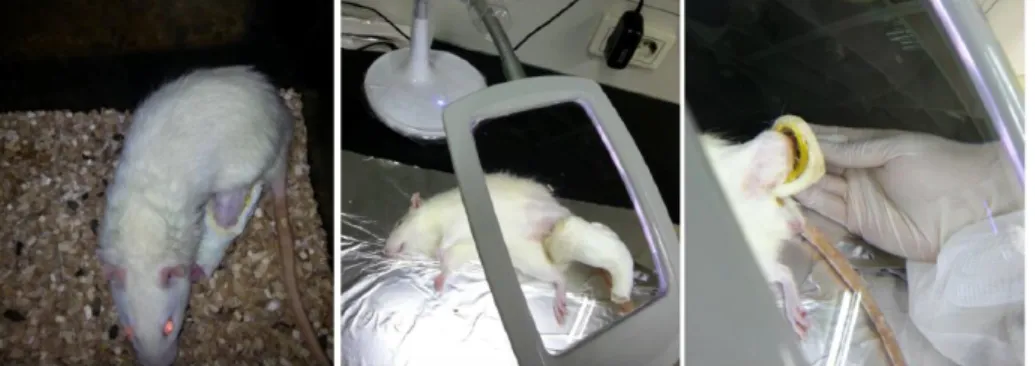
3.3. Hindlimb immobilization
After 12 weeks of resistance ladder exercise, when the rats were 22 weeks old, the CONIM and EXIM groups were generated following a of week hindlimb immobilization by casting. For unilateral immobilization, the modified immobilization method of Krawiec (Krawiec, Frost, Vary, Jefferson, & Lang, 2005) and Kelleher (Kelleher, Pereira, Jefferson, & Kimball, 2015) was used. CONIM and EXIM animals were anesthetized with 30 mg/kg Zoletil 50 (Virbac, Carros, France) and casting tape (Scotchcast, 3M Korea, Korea) was applied to the left leg of rats using following procedure: fur was removed and the hindlimb was wrapped with underwrap (Mueller, U.S.A.) to prevent skin problems when the cast is taken off. Joints were fixed at an established angle to prevent removal. The hindlimb cast was fixed at 90 degrees at the ankle, 180 degrees at the knee, and 90 to 180 degrees at the hip to allow for slight motion.
If any symptom of circulation impairment such as edema, congestion, or necrosis was observed in the immobilized hindlimb, the left leg cast was taken off and reattached after checking for signs of edema. This method was demonstrated to minimize any negative effects in pilot experiments.
Figure 4. Hindlimb immobilization using cast bandage
3.4. Intraperitoneal glucose tolerance test (IPGTT)
An intraperitoneal glucose tolerance test (IPGTT) was performed after an overnight fast before and after exercise and hindlimb immobilization intervention. Glycemia was measured from the tail tip 0, 15, 30, 60, 90, and 120 min after glucose injection (ip, 0.75g/kg of body weight) using a blood glucose meter (Accu-Chek Go, Roche Diagnostic, Mannheim, Germany).
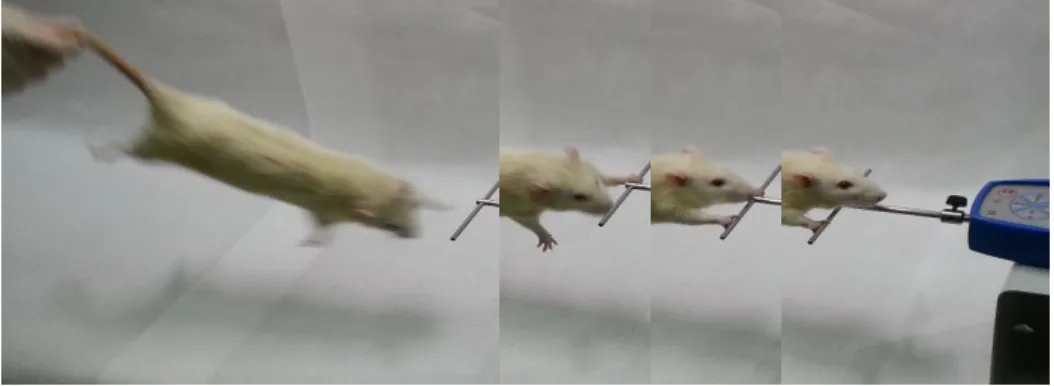
3.5. Grip strength test
A forelimb grip strength test meter (grip strength test, Bioseb, France) was used to measure the maximal strength of forelimb grips in rats undergoing resistance ladder climbing. The amount of tensile force was measured by a metal bar the ages of 9, 14, 18, 22, and 23-weeks old. The measurement 5 times and used the maximum numerical value was performed. It was found to be that the loss of muscle strength occurs more rapid than the loss of muscle mass, which presents muscle quality is important (Goodpaster et al., 2006). To measure the quality of muscle status, the method from previous study (Hairi et al., 2010) that used the ratio of grip strength to muscle mass was applied.
Figure 5. Forelimb grip strength test
3.6. SPARC protein analysis
Protein extracts from two types of skeletal muscle were prepared using tissue homogenates after resistance training and/or atrophy intervention. Serum and skeletal muscle tissues such as the plantaris and soleus were measured using an enzyme-linked immunosorbent assay (ELISA). For protein analysis, an ELISA kit for osteonectin in rats (USCN life Science Inc., Houston, USA) was used. The detection range was 0.625 to 40 ng/ml for each assay. The results were calculated based on a typical standard curve for osteonectin.
3.7. Histological analysis
For hematoxylin and eosin (H&E) staining, at the end of the in vivo experiment, skeletal muscle tissues were fixed in 4% paraformaldehyde for 2 days and then dehydrated in graded ethanol. Samples were directly embedded in paraffin, and cut in a cross section (4 µm thick) of the plantaris muscle using a microtome (Leica, Wetzlar, Germany). Sections were mounted on slides, put in xylene, and dehydrated in a sequence of 100%, 95%, 90%, 80% and 70% ethanol. Sections were stained with hematoxylin and eosin, labeled immunohistochemically for measurement of percent fibers and cross section area of myofibers in the plantaris of a rat from each group (left- and right-limb of CONIM and EXIM) and analyzed using INNERVIEW 2.0 software.
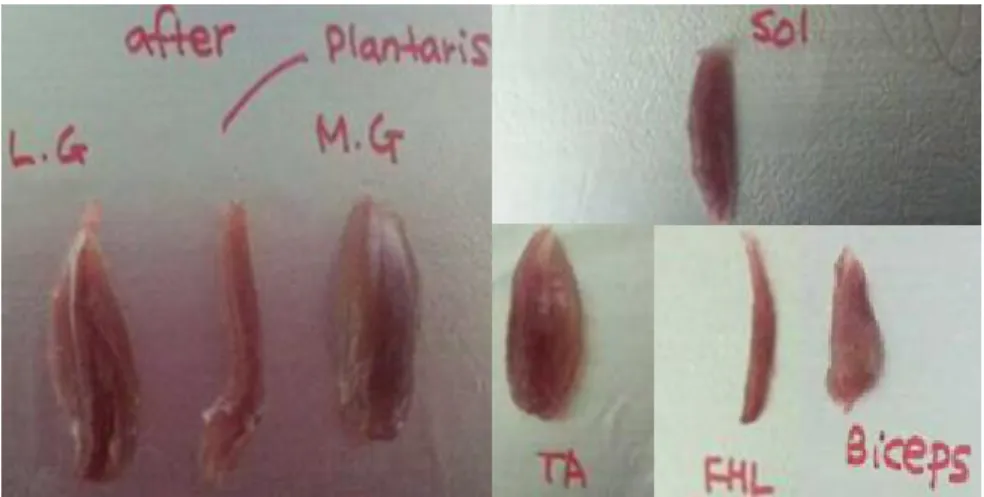
3.8. Tissue processing
At the end of the 12 week exercise intervention, CON and EX groups were anesthetized with 30 mg/kg Zoletil 50 (Virbac, Carros, France). After immobilizing the hindlimb for one week, CONIM and EXIM groups were also anesthetized with the same method, and isolated muscle tissue samples were weighted and divided into two parts. Plantaris and soleus muscles were stored at -80℃ in a deep freezer in 4%
paraformaldehyde in 0.1 M phosphate buffer (pH 7.4) for future use.
Figure 6. Extracted skeletal muscles
3.9. Statistical analysis
All statistical analyses were conducted using the Origin 8.0 and SPSS version 21.0 software package (IBM Co., Armonk, NY, USA). Body weight, grip strength, and mean cross section area were analyzed using 2-way analysis of variance (ANOVA). Body weight, muscle mass, muscle quality, glucose tolerance, cross section area, and SPARC protein levels were analyzed using two sample t-tests, and body weight, glucose tolerance, and grip strength were analyzed using paired t-tests for analysis of pre-/post- measurements. In addition, Pearson correlations were conducted to examine bivariate associations between SPARC level and grip strength. Data are expressed as the means
± SEM and statistical significance was determined at P < 0.05.
IV. RESULTS
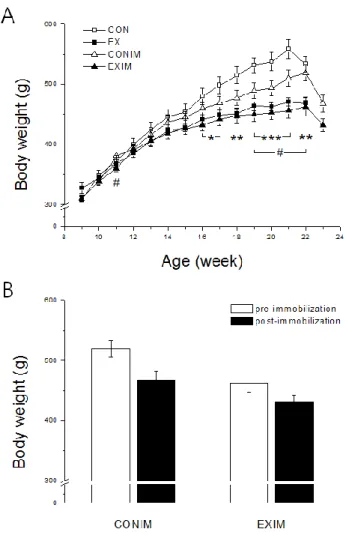
4.1. Resistance training affects body weight in normal and atrophied rats.
The body weight of animals in the EX group was markedly decreased compared with the CON group from 16 to 22 weeks old (Fig. 7A). Additionally, the body weight of the immobilization models (CONIM and EXIM) was significantly decreased in 11-week- old and 19-week-old animals compared with 22-week-old animals. In addition, the change in body weight between pre-/post-immobilization was not significantly different (Fig. 7B).
Figure 7. Measurements of body weight in rats under normal and atrophy conditions.
A: Body weight in CON, EX, CONIM, and EXIM groups during the period of intervention. Data represent the means ± SEM. B: Body weight of pre-/post- immobilization in CONIM and EXIM (P = 0.072). Data represent the means ± SEM.
*P<0.05, **P<0.01, ***P<0.001 compared with the control and #P<0.05 compared with CONIM (Son et al., 2015).
4.2. Resistance training improves skeletal muscle mass in normal and atrophied rats.
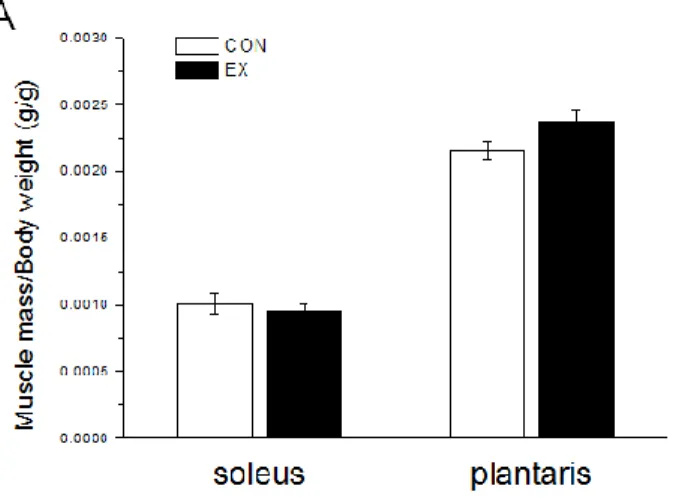
For relative muscle mass, the ratio of skeletal muscle wet weight to whole-body weight was not significantly different in the plantaris or soleus muscles after 12 weeks of resistance training (Fig. 8A). Furthermore, in the immobilized rat model, the mass of a variety of muscles such as the soleus, plantaris, and gastrocnemius medialis decreased significantly in both groups. However, there were no significant changes in the other measured parameters (Table 2).
Figure 8. Measurements of relative muscle mass in rats under normal and atrophy conditions. A: Relative muscle mass as a ratio of muscle mass to body weight. Data represent the means ± SEM (Son et al., 2015).
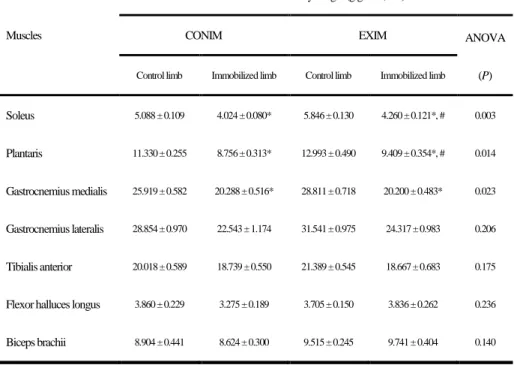
Table 2. Relative muscle mass in hindlimb immobilized rats
Skeletal muscle mass in the soleus, plantaris, gastrocnemius medialis and lateralis, tibialis anterior, flexor halluces longus, and biceps brachii after resistance ladder training for 12 weeks and hindlimb immobilization for a week. Data represent the means ± SEM.
*P<0.001 compared with the control limb and #P<0.001 compared with CONIM immobilized limb (Son et al., 2015).
Muscles
Muscle mass / Body weight (g/g x 10,000)
CONIM EXIM ANOVA
(P) Control limb Immobilized limb Control limb Immobilized limb
Soleus 5.088 ± 0.109 4.024 ± 0.080* 5.846 ± 0.130 4.260 ± 0.121*, # 0.003
Plantaris 11.330 ± 0.255 8.756 ± 0.313* 12.993 ± 0.490 9.409 ± 0.354*, # 0.014
Gastrocnemius medialis 25.919 ± 0.582 20.288 ± 0.516* 28.811 ± 0.718 20.200 ± 0.483* 0.023
Gastrocnemius lateralis 28.854 ± 0.970 22.543 ± 1.174 31.541 ± 0.975 24.317 ± 0.983 0.206
Tibialis anterior 20.018 ± 0.589 18.739 ± 0.550 21.389 ± 0.545 18.667 ± 0.683 0.175
Flexor halluces longus 3.860 ± 0.229 3.275 ± 0.189 3.705 ± 0.150 3.836 ± 0.262 0.236
Biceps brachii 8.904 ± 0.441 8.624 ± 0.300 9.515 ± 0.245 9.741 ± 0.404 0.140
4.3. Hindlimb immobilization for a week does not affect the glucose tolerance.
Glucose tolerance test was performed and analyzed before and after hindlimb immobilization. Hindlimb immobilization for a week does not change the glucose tolerance via IPGTT in normal (COMIM) and exercised (EXIM) rats (Fig. 9A). Also, area under the curve based on glucose tolerance test showed that there were no significant differences between 1) normal and exercised and 2) normal and muscle atrophied rats (Fig. 9B), which suggests that there is not enough time in hindlimb immobilization for a week.
Figure 9. Effects of resistance training on glucose tolerance in before and after hindlimb
immobilization. A: After 12 weeks of resistance training, blood glucose before and after hindlimb immobilization. B: Area under the curve of intraperitoneal glucose tolerance test. Data represent the means ± SEM.
4.4. Resistance training improves grip strength and muscle quality.
For relative grip strength, the initial grip strength at 8 weeks old was not significantly different, but there were significant differences between 18-week-old and 22-week-old rats compared with measurements prior to training (Two-way ANOVA between 18 and 9-week-old rats: P < 0.01, and between 22 and 9-week-old rats: P < 0.001) (Fig. 10A).
In addition, a significant difference in muscle quality in the EX group compared with the CON group using the ratio of forelimb grip strength to the biceps brachii muscle immediately after scarification was found (Fig. 10B). These data suggest that resistance training increases relative forelimb grip strength in our rat model.
Figure 10. Effects of resistance training on forelimb grip strength and muscle quality. A:
Relative grip strength as a ratio of grip strength to body weight. Data represent the means
± SEM. B: Muscle quality in the CON and EX groups. Data represent the means ± SEM.
***P<0.001 compared with the control (Son et al., 2015).
4.5. Resistance training alleviates the reduction in the mean cross section area after hindlimb immobilization.
Representative microscope images of the H&E stained skeletal muscle architecture in the plantaris muscle are shown in Fig. 11A and a great diversity of skeletal muscle fibers were analyzed (the number of fibers; COMIM-control limb: 3938, COMIM- immobilized limb: 4389, EXIM-control limb: 3197, EXIM-immobilized limb: 2367).
In the CONIM group, the cross sectional area of the immobilized limb muscle was dramatically decreased to 43.71% of control limb muscle. In the EXIM group, the cross sectional area of the immobilized limb muscle was also significantly decreased by 11.89%. However, the loss of cross sectional area in the immobilized limb in the EXIM group was smaller than the CONIM group (Fig. 11B).
Figure 11. Effects of skeletal muscle atrophy by hindlimb immobilization on myofiber
cross sectional area (CSA). A: Representative micrographs of hematoxylin and eosin stained plantaris muscle sections from control limbs and immobilized limbs of both CONIM and EXIM. Scale bar = 40 µm. B: The means of myofiber CSAs in the plantaris muscle of CONIM and EXIM groups after unilateral immobilization. Data represent the means ± SEM. ***P<0.001 compared with the control limb and ###P<0.001 compared with CONIM group (Son et al., 2015).
4.6. Resistance training alleviates the reduction in distributions of cross section area after hindlimb immobilization.
The distributions of cross section areas in the control and immobilized limbs was analyzed, and a similar range in the EXIM group after treatment was also found (Fig.
12C; 1300 ~ 1600 µm2 in median range). However, in the CONIM group, the median percentage of fibers showed a large variation (Fig. 12A; control limb: 1351 µm2, immobilized limb: 773 µm2). Analyzing cumulative percent fibers, the difference between control and immobilized limbs in the CONIM group was even larger than in the EXIM group (Fig. 12B, D).
Figure 12. Effects of skeletal muscle atrophy by hindlimb immobilization on myofiber
distributions of cross sectional area (CSA). A-D: The relative distributions (A, C) and cumulative plots (B, D) of myofiber CSAs in the plantaris muscle of CONIM and EXIM groups after unilateral immobilization (Son et al., 2015).
4.7. Resistance training alleviates increasing SPARC expression in atrophy-induced model.
After resistance training for 12 weeks, there was no clear difference between CON and EX groups. On the other hand, after resistance training and hindlimb immobilization for a week, SPARC levels were increased significantly in the plantaris of EXIM group compared with the EX group. Moreover, there was a pre-training effect shown from the result of SPARC expression as it was significantly lower in plantaris of EXIM group than that of the CONIM immobilized limb (Fig. 13A). However, in type 1 dominant soleus muscle fibers and serum, levels of SPARC expression were not significantly different (Fig. 13A, B).
Figure 13. The effect of resistance training on skeletal muscle and serum SPARC levels
and muscle atrophy. A: Effect of 12 weeks of resistance ladder training on SPARC expression in the plantaris and soleus. Data represent the means ± SEM. B: SPARC protein levels in the serum. Data represent the means ± SEM. *P<0.05 compared with the CONIM immobilized limb and ###P<0.001 (CONIM immobilized limb versus CON and EXIM immobilized limb versus EX) (Son et al., 2015).
4.8. Association between changes in skeletal muscle SPARC level and physical factors.
In addition, a negative correlation between changes in SPARC protein levels in the plantaris and changes in grips strength was found in response to resistance ladder climbing and hindlimb immobilization (Fig. 14A).
Figure 14. Efficiency of the hindlimb immobilized model to identify the effect of
resistance training on the relationship between SPARC expression and muscle atrophy.
A: Association of plantaris SPARC expression with relative grip strength. Pearson correlation coefficients and P value are shown in the graph (Son et al., 2015).
V. DISCUSSION & CONCLUSION
This study suggested increased SPARC expression under atrophy conditions and identified an effect of resistance training on SPARC levels in hindlimb immobilized rats.
In a previous study, resistance exercise, including ladder climbing exercise in a murine mode (Hornberger & Farrar, 2004), decreased body weight and increased muscle mass (Bellamy et al., 2014; Poggiogalle, Migliaccio, Lenzi, & Donini, 2014). However, the fact that the same type of exercise (ladder climbing) in a murine model may reduce muscle atrophy caused by unilateral immobilization requires further explanation. In addition, a recent study found that loss of SPARC is one of the causes of muscle atrophy (Nakamura et al., 2013); however, it has not been articulated whether resistance exercise increases homeostatic SPARC expression in skeletal muscle. In this study, multiple lines of evidence to demonstrate that hindlimb immobilization is a potential feedback regulator of SPARC expression in skeletal muscle was provided, and resistance training reduces the increased SPARC expression associated with immobilization
The hindlimb immobilization model induces many physiological changes, such as alterations in the levels of atrogin1 and MuRF1, and diminished bone and muscle mass (Kelleher et al., 2015; Krawiec et al., 2005). Changes to mechanistic target of rapamycin complex 1 (mTORC1) signaling, and loss of skeletal muscle mass was also reported in a one week immobilization model (Kelleher et al., 2015). This study showed significant effects on body weight and skeletal muscle mass, but the difference was not significant before and after unilateral immobilization (Fig. 1B). Also, the relative muscle mass ratio of the soleus and the plantaris to body weight showed no significant differences (Fig.
1C). The fact that food intake was not measured, which may cause changes to skeletal
muscle, is a limitation. However, decreases in body weight following resistance exercise is not related to energy intake (Souza et al., 2014).
Additionally, it was previously reported that skeletal muscle mass declines with aging, whereas resistance training enhances skeletal muscle function (Balachandran, Krawczyk, Potiaumpai, & Signorile, 2014). Skeletal muscle function can be measured using grip strength of the forelimbs, which represents the strength of the upper body (Schaal et al., 2007). To report a relative value, grip strength was divided by whole body weight (Ropponen, Silventoinen, Tynelius, & Rasmussen, 2011). Furthermore, strength divided by the involved muscle mass was also used to indicate muscle quality and identify a relationship between the ability to transfer body weight and the weight to be moved (Straight, Brady, & Evans, 2015). In present study, resistance ladder climbing improved grip strength and muscle quality (Fig. 2A, B). The fact that rats rely on their forelimbs while climbing a ladder may account for these remarkable result.
Following 7 days of hindlimb immobilization, a decrease in cross sectional area in CONIM and EXIM was observed. In addition, there was a significant difference between CONIM and EXIM in the immobilized limb, which demonstrated resistance training’s pre-training effect. Furthermore, there was also a significant difference between the control limb of CONIM and EXIM, which suggested muscle hypertrophy due to resistance training. To obtain more detailed results in the analysis of percent muscle fiber size, Nakamura’s team classified cross sectional area by fiber size (Nakamura et al., 2013). The difference in cross sectional area by fiber size showed that resistance training had an effect on alleviating muscle atrophy.
SPARC expression in skeletal muscle is induced after regular exercise (Aoi et al., 2013), especially in the tibialis anterior muscle (Nakamura et al., 2013). In a previous
study, myofiber atrophy caused by SPARC suppression was evident in fast-type myofibers (Nakamura et al., 2013). In addition, in aged muscle, atrophy occurs more severely in fast-type myofibers than in slow-type myofibers (Gueugneau et al., 2015).
Based on these results, it was proposed that SPARC expression would be changed by atrophy and resistance training would alleviate muscle atrophy specifically in the type 2 muscle fibers dominant in the plantaris. Furthermore, a previous study that introduced SPARC as a novel myokine reported that exercise increased SPARC expression in skeletal muscle (Aoi et al., 2013). However, in our results, fast- and slow-twitch fibers were decreased in cross sectional area (Table 1), and SPARC expression in skeletal muscle was changed only in the plantaris, which contains type 2 dominant muscle fibers (Fig. 4A), but not in the soleus and serum in all groups (Fig. 4A, B). Our data could reflect a compensatory effect of SPARC expression caused by hindlimb immobilization, in agreement with a previous study that showed similar effects in other organs (Gao, Frost, Siegwart, & Norton, 2011).
In conclusion, this study identified a relationship between chronic resistance exercise and SPARC expression under atrophy conditions in skeletal muscle. In addition, a possible compensatory effect for SPARC in skeletal muscle was demonstrated. Further studies will be necessary to determine whether hindlimb immobilization would be a useful method to identify pre-training effects in resistance training. SPARC may be a useful therapeutic target to overcome muscular atrophy and sarcopenia.
REFERENCES
Adams, G. R., Haddad, F., Bodell, P. W., Tran, P. D., & Baldwin, K. M. (2007).
Combined isometric, concentric, and eccentric resistance exercise prevents unloading-induced muscle atrophy in rats. J Appl Physiol (1985), 103(5), 1644- 1654.
Aoi, W., Naito, Y., Takagi, T., Tanimura, Y., Takanami, Y., Kawai, Y., et al. (2013). A novel myokine, secreted protein acidic and rich in cysteine (SPARC), suppresses colon tumorigenesis via regular exercise. Gut, 62(6), 882-889.
Arnold, S. A., & Brekken, R. A. (2009). SPARC: a matricellular regulator of tumorigenesis. J Cell Commun Signal, 3(3-4), 255-273.
Balachandran, A., Krawczyk, S. N., Potiaumpai, M., & Signorile, J. F. (2014). High- speed circuit training vs hypertrophy training to improve physical function in sarcopenic obese adults: A randomized controlled trial. Exp Gerontol, 60, 64- 71.
Baldi, J. C., Jackson, R. D., Moraille, R., & Mysiw, W. J. (1998). Muscle atrophy is prevented in patients with acute spinal cord injury using functional electrical stimulation. Spinal Cord, 36(7), 463-469.
Barber, L., Scicchitano, B. M., & Musaro, A. (2015). Molecular and Cellular Mechanisms of Muscle Aging and Sarcopenia and Effects of Electrical Stimulation in Seniors. Eur J Transl Myol, 25(4), 231-236.
Bellamy, L. M., Joanisse, S., Grubb, A., Mitchell, C. J., McKay, B. R., Phillips, S. M., et al. (2014). The acute satellite cell response and skeletal muscle hypertrophy following resistance training. PLoS One, 9(10), e109739.
Bento, P. C., & Rodacki, A. L. (2014). Muscle function in aged women in response to a water-based exercises program and progressive resistance training. Geriatr Gerontol Int.
Bradshaw, A. D., Graves, D. C., Motamed, K., & Sage, E. H. (2003). SPARC-null mice exhibit increased adiposity without significant differences in overall body weight. Proc Natl Acad Sci U S A, 100(10), 6045-6050.
Braun, T., & Gautel, M. (2011). Transcriptional mechanisms regulating skeletal muscle differentiation, growth and homeostasis. Nat Rev Mol Cell Biol, 12(6), 349-361.
Brekken, R. A., & Sage, E. H. (2001). SPARC, a matricellular protein: at the crossroads of cell-matrix communication. Matrix Biol, 19(8), 816-827.
Cho, S. H., Kim, J. H., & Song, W. (2016). In Vivo Rodent Models of Skeletal Muscle Adaptation to Decreased Use. Endocrinol Metab (Seoul), 31(1), 31-37.
Cohen, S., Nathan, J. A., & Goldberg, A. L. (2015). Muscle wasting in disease:
molecular mechanisms and promising therapies. Nat Rev Drug Discov, 14(1), 58-74.
Czerwinski, S. M., Kurowski, T. G., O'Neill, T. M., & Hickson, R. C. (1987). Initiating regular exercise protects against muscle atrophy from glucocorticoids. J Appl Physiol (1985), 63(4), 1504-1510.
Delany, A. M., Amling, M., Priemel, M., Howe, C., Baron, R., & Canalis, E. (2000).
Osteopenia and decreased bone formation in osteonectin-deficient mice. J Clin Invest, 105(9), 1325.
Della Gatta, P. A., Garnham, A. P., Peake, J. M., & Cameron-Smith, D. (2014). Effect of exercise training on skeletal muscle cytokine expression in the elderly. Brain Behav Immun, 39, 80-86.
Falduto, M. T., Czerwinski, S. M., & Hickson, R. C. (1990). Glucocorticoid-induced muscle atrophy prevention by exercise in fast-twitch fibers. J Appl Physiol (1985), 69(3), 1058-1062.
Gao, H., Frost, M. R., Siegwart, J. T., Jr., & Norton, T. T. (2011). Patterns of mRNA and protein expression during minus-lens compensation and recovery in tree shrew sclera. Mol Vis, 17, 903-919.
Glass, D. J. (2003). Signalling pathways that mediate skeletal muscle hypertrophy and atrophy. Nat Cell Biol, 5(2), 87-90.
Goodpaster, B. H., Park, S. W., Harris, T. B., Kritchevsky, S. B., Nevitt, M., Schwartz, A. V., et al. (2006). The loss of skeletal muscle strength, mass, and quality in older adults: the health, aging and body composition study. J Gerontol A Biol Sci Med Sci, 61(10), 1059-1064.
Gueugneau, M., Coudy-Gandilhon, C., Theron, L., Meunier, B., Barboiron, C., Combaret, L., et al. (2015). Skeletal muscle lipid content and oxidative activity in relation to muscle fiber type in aging and metabolic syndrome. J Gerontol A Biol Sci Med Sci, 70(5), 566-576.
Hairi, N. N., Cumming, R. G., Naganathan, V., Handelsman, D. J., Le Couteur, D. G., Creasey, H., et al. (2010). Loss of muscle strength, mass (sarcopenia), and quality (specific force) and its relationship with functional limitation and physical disability: the Concord Health and Ageing in Men Project. J Am Geriatr Soc, 58(11), 2055-2062.
Hohenester, E., Maurer, P., Hohenadl, C., Timpl, R., Jansonius, J. N., & Engel, J. (1996).
Structure of a novel extracellular Ca(2+)-binding module in BM-40. Nat Struct Biol, 3(1), 67-73.
Horlings, C. G., van Engelen, B. G., Allum, J. H., & Bloem, B. R. (2008). A weak balance: the contribution of muscle weakness to postural instability and falls.
Nat Clin Pract Neurol, 4(9), 504-515.
Hornberger, T. A., Jr., & Farrar, R. P. (2004). Physiological hypertrophy of the FHL muscle following 8 weeks of progressive resistance exercise in the rat. Can J Appl Physiol, 29(1), 16-31.
Kelleher, A. R., Pereira, S. L., Jefferson, L. S., & Kimball, S. R. (2015). REDD2 expression in rat skeletal muscle correlates with nutrient-induced activation of mTORC1: responses to aging, immobilization, and remobilization. Am J Physiol Endocrinol Metab, 308(2), E122-129.
Kos, K., & Wilding, J. P. (2010). SPARC: a key player in the pathologies associated with obesity and diabetes. Nat Rev Endocrinol, 6(4), 225-235.
Krawiec, B. J., Frost, R. A., Vary, T. C., Jefferson, L. S., & Lang, C. H. (2005). Hindlimb casting decreases muscle mass in part by proteasome-dependent proteolysis but independent of protein synthesis. Am J Physiol Endocrinol Metab, 289(6), E969-980.
Lake, D. A. (1992). Neuromuscular electrical stimulation. An overview and its application in the treatment of sports injuries. Sports Med, 13(5), 320-336.
Lane, T. F., Iruela-Arispe, M. L., Johnson, R. S., & Sage, E. H. (1994). SPARC is a source of copper-binding peptides that stimulate angiogenesis. J Cell Biol, 125(4), 929-943.
Lecker, S. H., Goldberg, A. L., & Mitch, W. E. (2006). Protein degradation by the ubiquitin-proteasome pathway in normal and disease states. J Am Soc Nephrol, 17(7), 1807-1819.
Mitch, W. E., & Goldberg, A. L. (1996). Mechanisms of muscle wasting. The role of the ubiquitin-proteasome pathway. N Engl J Med, 335(25), 1897-1905.
Motamed, K., Blake, D. J., Angello, J. C., Allen, B. L., Rapraeger, A. C., Hauschka, S.
D., & Sage, E. H. (2003). Fibroblast growth factor receptor-1 mediates the inhibition of endothelial cell proliferation and the promotion of skeletal myoblast differentiation by SPARC: a role for protein kinase A. J Cell Biochem, 90(2), 408-423.
Nakamura, K., Nakano, S., Miyoshi, T., Yamanouchi, K., & Nishihara, M. (2013). Loss of SPARC in mouse skeletal muscle causes myofiber atrophy. Muscle Nerve, 48(5), 791-799.
Narici, M. V., & de Boer, M. D. (2011). Disuse of the musculo-skeletal system in space and on earth. Eur J Appl Physiol, 111(3), 403-420.
Pedersen, B. K., & Febbraio, M. A. (2012). Muscles, exercise and obesity: skeletal muscle as a secretory organ. Nat Rev Endocrinol, 8(8), 457-465.
Poggiogalle, E., Migliaccio, S., Lenzi, A., & Donini, L. M. (2014). Treatment of body composition changes in obese and overweight older adults: insight into the phenotype of sarcopenic obesity. Endocrine, 47(3), 699-716.
Powers, S. K., Morton, A. B., Ahn, B., & Smuder, A. J. (2016). Redox control of skeletal muscle atrophy. Free Radic Biol Med.
Rivera, L. B., & Brekken, R. A. (2011). SPARC promotes pericyte recruitment via inhibition of endoglin-dependent TGF-beta1 activity. J Cell Biol, 193(7), 1305- 1319.
Ropponen, A., Silventoinen, K., Tynelius, P., & Rasmussen, F. (2011). Association between hand grip/body weight ratio and disability pension due to
musculoskeletal disorders: a population-based cohort study of 1 million Swedish men. Scand J Public Health, 39(8), 830-838.
Sandri, M. (2008). Signaling in muscle atrophy and hypertrophy. Physiology (Bethesda), 23, 160-170.
Schaal, S. M., Kitay, B. M., Cho, K. S., Lo, T. P., Jr., Barakat, D. J., Marcillo, A. E., et al.
(2007). Schwann cell transplantation improves reticulospinal axon growth and forelimb strength after severe cervical spinal cord contusion. Cell Transplant, 16(3), 207-228.
Son, J. S., Kim, J. H., Kim, H. J., Yoon, D. H., Kim, J. S., Song, H. S., & Song, W. (2016).
Effect of resistance ladder training on SPARC expression in skeletal muscle of hindlimb immobilized rats. Muscle Nerve, 53(6), 951-957
Souza, M. V., Leite, R. D., Souza Lino, A. D., Marqueti Rde, C., Bernardes, C. F., Araujo, H. S., et al. (2014). Resistance training improves body composition and increases matrix metalloproteinase 2 activity in biceps and gastrocnemius muscles of diet-induced obese rats. Clinics (Sao Paulo), 69(4), 265-270.
Straight, C. R., Brady, A. O., & Evans, E. (2015). Sex-specific relationships of physical activity, body composition, and muscle quality with lower-extremity physical function in older men and women. Menopause, 22(3), 297-303.
Winklmayr, M., Kluge, C., Winklmayr, W., Kuchenhoff, H., Steiner, M., Ritter, M., &
Hartl, A. (2014). Radon balneotherapy and physical activity for osteoporosis prevention: a randomized, placebo-controlled intervention study. Radiat Environ Biophys.
국 문 초 록
뒷다리를 고정한 쥐의 골격근에서 저항성 운동이 SPARC level의 증가를 완화시키는데 미치는 영향
손 준 석
서울대학교 대학원 체 육 교 육 과
서론: Secreted protein acidic and rich in cysteine (SPARC)은 골격근의 위축에 관여한다고 보고되어 왔다. 본 연구는 12주간의 저항성 사다리 운동이 속근 섬유 의 비중이 높은 plantaris 근육의 근위축 상황에서 SPARC 단백질의 발현에 미치 는 영향에 대한 내용으로 연구되었다. 저항성 운동이 근위축 모델에서 근육의 질 을 개선시키고 SPARC 단백질 발현을 증가 시킬 것으로 사료되었다. 방법:
Sprague-Dawley 수컷 쥐를 연구 대상으로 12주간의 저항성 사다리 운동을 중 재하였고, 그 후 7일간 왼쪽 뒷다리에 석고붕대를 이용해 고정하였고 근위축을 유 발하였다. 앞다리의 악력을 측정하였고, 중재 이후 plantaris 근육의 단면적을 분 석하였다. 또한, 중재 후에 plantaris, soleus, 그리고 혈중 SPARC 단백질의 발현 량을 분석하였다. 결과: 저항성 운동은 근위축 모델의 체중 (P < 0.001), 골격근량 (Soleus; P < 0.01, plantaris; P < 0.05, gastrocnemius medialis; P < 0.05), 그리 고 앞다리의 악력 (P < 0.001)에 긍정적인 영향을 미쳤다. 특히 저항성 운동은 근 위축 유발 상황에서 plantaris 근육의 위축을 완화하였다 (31.82%). 또한, 저항성 운동은 근위축 상황에서 증가하는 plantaris SPARC 수준을 완화하였다 (P <
0.05). 결론: 본 연구는 근위축 유발 모델에서 저항성 운동과 골격근에서 분비되 는 SPARC 수준 간의 상관성을 보고하였다. 더욱이 SPARC 단백질은 골격근에 서 보상기전으로서 작용할 수 있는 가능성을 보였고, 이로 인해 근위축과 근감소 증을 극복할 수 있는 유용한 치료적 물질이 될 수 있을 것이라 사료된다.
주요어: 근위축, 근육의 질, 근단면적, 운동의 사전효과, 보상기전 학번: 2013-21459