저작자표시-비영리-변경금지 2.0 대한민국 이용자는 아래의 조건을 따르는 경우에 한하여 자유롭게
l 이 저작물을 복제, 배포, 전송, 전시, 공연 및 방송할 수 있습니다. 다음과 같은 조건을 따라야 합니다:
l 귀하는, 이 저작물의 재이용이나 배포의 경우, 이 저작물에 적용된 이용허락조건 을 명확하게 나타내어야 합니다.
l 저작권자로부터 별도의 허가를 받으면 이러한 조건들은 적용되지 않습니다.
저작권법에 따른 이용자의 권리는 위의 내용에 의하여 영향을 받지 않습니다. 이것은 이용허락규약(Legal Code)을 이해하기 쉽게 요약한 것입니다.
Disclaimer
저작자표시. 귀하는 원저작자를 표시하여야 합니다.
비영리. 귀하는 이 저작물을 영리 목적으로 이용할 수 없습니다.
변경금지. 귀하는 이 저작물을 개작, 변형 또는 가공할 수 없습니다.
약학박사 학위논문
지역약국 약사의 자발적 보고 자료를 대상으로 한 약물이상반응에 관한 연구
Spontaneous Reporting of Adverse Drug Reactions by Community Pharmacists in Korea
2015년 8월
서울대학교 대학원 약학과 예방
•임상약학전공
유 윤 미
Spontaneous Reporting of
Adverse Drug Reactions
by Community Pharmacists in Korea
4Er? 4l$+
oJ =E.g EEI+^I olgtsE.e-e. 4l€+
zorsH zE
^l gEil oll. 4 olg
EElr+ el*. g+EEld*
++ul
SSul9 EqE^l q9=+g Rl=oJ
zorsH s€
+t g+
++lg+
+l +l
+l +l
+l +l
ABSTRACT
i
Spontaneous Reporting of Adverse Drug Reactions by Community Pharmacists in Korea
Yu, Yun MI College of Pharmacy The Graduate School Seoul National University
Purpose: To evaluate the clinical manifestations and causative drugs associated with adverse drug reactions (ADRs) spontaneously reported by community pharmacists and to compare the ADRs by age.
Methods: ADRs reported to the Regional Pharmacovigilance Center of the Korean Pharmaceutical Association by community pharmacists from January 2013 to June 2014 were included. Causality was assessed using the WHO-Uppsala Monitoring Centre system. The patient population was classified into three age groups. We analyzed 31,398 (74.9%) ADRs from 9,705 patients, identified as having a causal relationship, from a total pool of 41,930 ADRs from 9,873 patients.
Median patient age was 58.0 years; 66.9% were female.
Results: Gastrointestinal system (34.4%), nervous system (14.4%), and psychiatric (12.1%) disorders were the most frequent symptoms.
ii
Prevalent causative drugs were those for acid-related disorders (11.4%), anti-inflammatory products (10.5%), analgesics (7.2%), and antibacterials (7.1%). Comparisons by age revealed diarrhea and antibacterials to be most commonly associated with ADRs in children (p < 0.001), whereas dizziness was prevalent in the elderly (p < 0.001).
Anaphylactic reaction was the most frequent serious event (19.7%), mainly associated with cephalosporins and non-steroidal anti- inflammatory drugs. Among 612 ADRs caused by nonprescription drugs, the leading symptoms and causative drugs were skin disorders (29.6%) and non-steroidal anti-inflammatory drugs (16.2%), respectively.
Conclusions: According to the community pharmacist reports, the leading clinical manifestations and causative drugs associated with ADRs in outpatients differed among age groups.
Keywords: Adverse drug reaction, Spontaneous reporting, Community pharmacy, Outpatients, Age group, Pharmacovigilance
Student Number : 2011-31103
iii
TABLE OF CONTENTS
ABSTRACT i
TABLE OF CONTENTS iv
LIST OF TABLES v
LIST OF FIGURES vi
INTRODUCTION 1
METHODS 5
RESULTS 10
DISCUSSION 39
CONCLUSION 45
REFERENCES 47
APPENDIX 55
국문초록 75
iv
LIST OF TABLES
Table 1. Patient demographics ……….14 Table 2. Clinical manifestation of adverse drug reactions
according to the system-organ classification and preferred term……….16 Table 3. Causative drugs for adverse drug reactions according
to the anatomical therapeutic chemical classification system……….21 Table 4. Clinical manifestation in serious events………….30 Table 5. Causative drugs and clinical manifestation in serious
events………..32 Table 6. Causative drugs and clinical manifestation among the
nonprescription drugs……….36
v
LIST OF FIGURES
Figure 1. The selection process for adverse drug reaction reports
………12 Figure 2. Frequency of adverse drug reactions and causative
drugs according to sex………27 Figure 3. The number of specific adverse drug reaction case and
the proportion of each case among all cases according to specific drug groups.
………28
vi
INTRODUCTION
1
An adverse drug reaction (ADR), as defined by the World Health Organization (WHO), is “a noxious and unintended response of a drug, which occurs at a dose normally used in humans for prophylaxis, diagnosis, or therapy” [1]. Previous reports have suggested that 7–11.2%
of ADRs result in hospitalization [2,3] and that the mean cost of ADRs leading to admission was 2721 Euros per patient [4]. Previous studies on ADRs have focused on inpatient care settings. While hospitalized patients are under close medical monitoring, outpatients are not.
Because the contact is intermittent and consultation hours are constrained, it is difficult for physicians to secure sufficient communication time to ascertain the presence of ADRs in ambulatory care settings. Thus, the risk and expense of treatment of ADRs in outpatients may increase because remedial action is often delayed [5].
Considering the large proportion of prescriptions issued in ambulatory care, knowledge of ADRs in this population is important to prevent medication-related harm.
In outpatients, community pharmacists (CPs) may effectively monitor patient safety and provide adequate information through medication counseling [6,7]. It is easy for patients to visit community pharmacies because of their wide geographical distribution and accessibility without the need for an appointment. As CPs serve
2
patients with and without prescriptions, their active involvement in ADR monitoring and reporting is likely to improve the scope and quality of spontaneous ADR reporting [8].
In 2013, the Korea Institute of Drug Safety and Risk Management (KIDS) added the regional pharmacovigilance center of the Korean Pharmaceutical Association (RPVC-KPA), to existing RPVCs. While the existing RPVCs targeted each regional hub and their ADR reporting was mainly centered on inpatients in affiliated hospitals [9], the activity of RPVC-KPA was conducted on a national scale and focused on outpatients in community pharmacies nationwide. All CPs can report ADRs to RPVC-KPA through the spontaneous reporting system connected to their pharmacy’s billing program or the KIDS website.
Participating community pharmacies comprised 4.0% of the 20,971 registered nationwide community pharmacies in Korea as of March 2014 [10]. The reports by CPs comprised 3.4% of all ADR reports sent to KIDS by healthcare professionals [10]. This is a relatively low proportion in comparison to that in Netherlands, Spain, or Portugal, but it is comparable to the proportion in the UK, France, and Japan [11].
Considering the increase in the proportion of ADR reports by CPs from 0.8% (324 reports) in the first quarter of 2013 to 10.7% (5621 reports) in the second quarter of 2014, the participation of CPs in ADR
3
reporting is expected to expand [10]. Pharmacovigilance in outpatients can be improved by the active participation of CPs.
Although the data from spontaneous ADR reports by CPs may provide more pertinent information for ambulatory patients [12], few studies have been reported on this topic [8]. In addition, few studies have compared the ADR patterns by age group in ambulatory care patients [13]. A systematic review for the ADRs in ambulatory care showed that most studies investigated ADRs leading to hospitalization or emergency department visit [14]. Therefore, we aimed to evaluate the clinical manifestations and causative drugs associated with ADRs spontaneously reported by CPs and compare the ADRs by age.
4
METHODS
5
Data collection
ADRs spontaneously reported to RPC-KPA by CPs nationwide from January 2013 to June 2014 were collected. According to the WHO definition, this study only included ADRs associated with a dose normally used in humans and reports associated with a drug administered for ordinary prophylactic or therapeutic purposes. Reports related to drug abuse, suicide attempts, or medication errors were excluded. To reduce the possibility of duplication, each ADR was individually compared based on the patient’s age, sex, and residence;
location of the participating pharmacy; date of onset of the reaction;
and related drugs.
The patient population was classified into three age groups: children (less than 18 years), adult (19–63 years), and elderly (more than 64 years) groups. Reports without age were excluded. Patient records were anonymized and de-identified prior to analysis. The Institutional Review Board of Seoul National University approved this study (IRB No. 1405/002-006) and waived the requirement of informed consent.
6
Causality assessment
The causality of a drug for ADR was assessed using the World Health Organization-Uppsala Monitoring Centre (WHO-UMC) criteria, which was composed of six categories: certain, probable, possible, unlikely, conditional, and unassessable [15]. Causality was independently assessed by two trained pharmacists. When the pharmacists disagreed on causality, they discussed the difference and achieved consensus in all cases. The inter-rater reliability in initial assessment was calculated and Cohen’s κ score greater than 0.81 was considered “very good agreement” [16]. ADRs classified as “less than possible” in the causality assessment were excluded from subsequent analysis.
Analysis of clinical manifestations and causative drugs
Clinical manifestations were classified using the WHO-adverse reaction terminology (ART) system [17]. The system-organ classes
7
(SOC) and the preferred terms (PT) of the WHO-ART system were used as a main- and sub-category, respectively. Symptoms matched with the same PT were treated as the same event. Two or more PTs reported in one patient and two or more medications involved in one event were counted as different ADRs. The causative drugs were classified using the Anatomical Therapeutic Chemical (ATC) classification system [18].
The frequency of clinical manifestations and causative drugs was compared according to age group. Unlabeled ADRs were identified by assessing whether reported ADRs were included in the label of each causative drug. The relationship between serious ADRs and causative drugs was evaluated by comparing the count of specific ADRs according to specific drugs.
Analysis of serious events and nonprescription drugs
Serious ADRs were defined as cases that were fatal, caused hospitalization or persistent disability, or were life-threatening according to WHO criteria [19]. The patterns of ADRs caused by
8
nonprescription drugs were also analyzed by comparing the number of specific clinical manifestations according to specific drugs.
Statistics
Descriptive statistics were used to summarize the demographic and clinical characteristics of study participants. Means and standard deviations were used for continuous variables, whereas frequencies and percentages were used for categorical variables. The categorical characteristics of three age groups including children, adults, and elderly were compared. Chi-squared test or Fisher’s exact test was applied to compare categorical variables between groups. The significance level was set at p < 0.01. For post hoc analysis, chi- squared test or Fisher’s exact test with Bonferroni correction was employed and the significance level was set at p < 0.003. Data analysis was performed using SPSS version 21.0 (SPSS Inc., Chicago, IL).
9
RESULTS
10
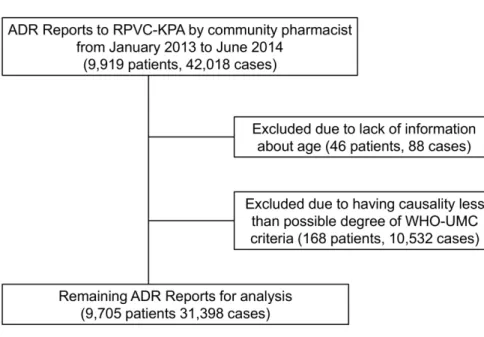
From January 2013 to June 2014, 42,018 ADRs from 9,919 patients were reported. A total of 920 community pharmacies participated. The proportion of participating community pharmacies located in metropolitan versus rural areas was 59.4% versus 40.6%. Forty-six patients (88 ADRs) were excluded because of a lack of information about age. Causality assessment using WHO-UMC criteria for 41,930 ADRs in 9,873 patients classified 1.4% as certain, 5.4% as probable, 68.1% as possible, 24.7% as unlikely, 0.2% as conditional, and 0.2% as unassessable. The κ score was 0.83 showing "very good agreement"
between the initial assessments of causality. After exclusion of the 10,532 ADRs (25.1%) having a less than possible degree of causality, 31,398 ADRs (74.9%) in 9,705 patients were analyzed. The mean number of events per patient was 1.4 and the mean number of causative drugs per event was 2.3.
11
Fig. 1. The selection process for adverse drug reaction reports.
ADR, adverse drug reaction; RPVC-KPA, Regional Pharmacovigilance Center-Korean Pharmaceutical Association; WHO-UMC, World Health Organization-Uppsala Monitoring Centre.
12
Demographic characteristics
The median age of the 9,705 patients was 58.0 years, ranging 3 months to 98 years (Table 1). The adult group comprised the largest portion of patients (64.0%), followed by the elderly group (32.5%) and children (3.5%). Females comprised 66.9% of all patients, with similar distributions in the adult and elderly subgroups. In contrast, female children comprised less than half of the pediatric group, which represented a significant difference from the other age groups (p <
0.001).
13
Table 1. Patient demographics
Characteristics Value
Number of patients 9,705
Female (%) 66.9
Age, median (range, years) 58.0 (0.3–98.0) Age, n (%)
Children 341 (3.5)
<2 years 61 (0.6)
2–11 years 165 (1.7)
12–18 years 115 (1.2)
Adults (19–64 years) 6,209 (64.0)
Elderly 3,155 (32.5)
65–74 years 2,076 (21.4)
75–84 years 965 (9.9)
≥85 years 114 (1.2)
Reported events per patient (mean) 1.4 Reported drugs per event (mean) 2.3 Number of patients with serious events, n 52
14
Clinical manifestations of adverse drug reactions
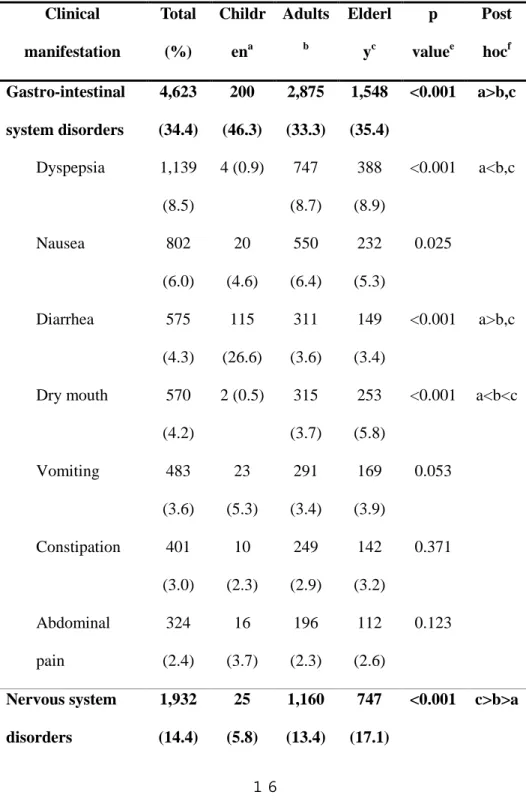
The clinical manifestations most frequently associated with ADRs were gastro-intestinal (GI) system disorders (4,623 events, 34.4%) followed by nervous system disorders (1,932 events, 14.4%) and psychiatric disorders (1,620 events, 12.1%). The most common symptoms were dizziness (1,142 events, 8.5%), dyspepsia (1,139 events, 8.5%), and somnolence (847 events, 6.3%).
A comparison of clinical manifestations according to age revealed that GI system disorders and diarrhea were most common in children, but dry mouth was least frequent in this group (p < 0.001) (Table 2).
The leading drugs causing diarrhea in children were antibacterial agents.
The elderly group showed a significantly higher frequency of ADRs involved in nervous and urinary system disorders (p < 0.001).
Dizziness was reported more frequently in the elderly than in any other age group (p < 0.001). The main drugs causing dizziness in elderly were analgesics and antiepileptics. Psychiatric disorders (including their subcategory somnolence) and skin disorders (including their subgroup rash and urticarial) were more frequent in children and adults (p < 0.001) (Table 2).
15
Table 2. Clinical manifestation of adverse drug reactions according to the system-organ classification and preferred termsd
Clinical manifestation
Total (%)
Childr ena
Adults
b
Elderl yc
p valuee
Post hocf Gastro-intestinal
system disorders
4,623 (34.4)
200 (46.3)
2,875 (33.3)
1,548 (35.4)
<0.001 a>b,c
Dyspepsia 1,139 (8.5)
4 (0.9) 747 (8.7)
388 (8.9)
<0.001 a<b,c
Nausea 802
(6.0)
20 (4.6)
550 (6.4)
232 (5.3)
0.025
Diarrhea 575
(4.3)
115 (26.6)
311 (3.6)
149 (3.4)
<0.001 a>b,c
Dry mouth 570 (4.2)
2 (0.5) 315 (3.7)
253 (5.8)
<0.001 a<b<c
Vomiting 483
(3.6)
23 (5.3)
291 (3.4)
169 (3.9)
0.053
Constipation 401 (3.0)
10 (2.3)
249 (2.9)
142 (3.2)
0.371
Abdominal pain
324 (2.4)
16 (3.7)
196 (2.3)
112 (2.6)
0.123
Nervous system disorders
1,932 (14.4)
25 (5.8)
1,160 (13.4)
747 (17.1)
<0.001 c>b>a
16
Dizziness 1,142 (8.5)
5 (1.2) 658 (7.6)
479 (10.9)
<0.001 c>b>a
Headache 366
(2.7)
3 (0.7) 243 (2.8)
120 (2.7)
0.03
Psychiatric disorders
1,620 (12.1)
71 (16.4)
1,111 (12.9)
438 (10.0)
<0.001 c<a,b
Somnolence 847 (6.3)
37 (8.6)
635 (7.4)
175 (4.0)
<0.001 c<a,b
Insomnia 446
(3.3)
15 (3.5)
279 (3.2)
152 (3.5)
0.758
General disorders 1,551 (11.5)
38 (8.8)
994 (11.5)
519 (11.9)
0.163
Edema 380
(2.8)
3 (0.7) 254 (2.9)
123 (2.8)
0.023
Asthenia 314
(2.3)
9 (2.1) 204 (2.4)
101 (2.3)
0.92
Skin disorders 1,543 (11.5)
68 (15.7)
1,095 (12.7)
380 (8.7)
<0.001 c<a,b
Pruritus 457
(3.4)
15 (3.5)
289 (3.3)
153 (3.5)
0.906
Rash 401
(3.0)
27 (6.3)
294 (3.4)
80 (1.8)
<0.001 c<a,b
17
Urticaria 191 (1.4)
11 (2.5)
150 (1.7)
30 (0.7)
<0.001 c<a,b
Urinary system disorders
572 (4.3)
8 (1.9) 328 (3.8)
236 (5.4)
<0.001 c>a,b
Face edema 340 (2.5)
6 (1.4) 214 (2.5)
120 (2.7)
0.205
Cardiovascular disorders
320 (2.4)
4 (0.9) 210 (2.4)
106 (2.4)
0.131
Palpitation 156 (1.2)
2 (0.5) 115 (1.3)
39 (0.9)
0.033
Respiratory system disorders
252 (1.9)
3 (0.7) 166 (1.9)
83 (1.9)
0.183
Metabolic disorders
227 (1.7)
3 (0.7) 161 (1.9)
63 (1.4)
0.054
Musculo-skeletal system disorders
211 (1.6)
1 (0.2) 129 (1.5)
81 (1.9)
0.023
dNumber of events and percentage of individual events within each group.
eChi-squared test of the three groups.
f Bonferroni correction (p < 0.003) with chi-squared or Fisher’s exact test.
18
Causative drugs
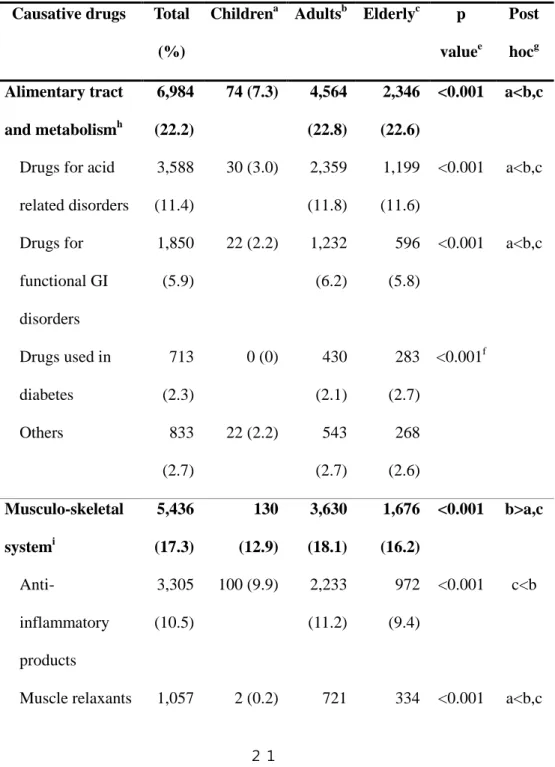
The most prevalent causative drugs were alimentary tract and metabolism drugs (6,984 ADRs, 22.2%), followed by musculoskeletal system drugs (5,436 ADRs, 17.3%) and nervous system drugs (5,210 ADRs, 16.6%). According to the subclassification, drugs for acid- related disorders (3,588 ADRs, 11.4%), anti-inflammatory products (3,305 ADRs, 10.5%), analgesics (2,262 ADRs, 7.2%), and antibacterials (2,240 ADRs, 7.1%) were frequently associated with ADRs.
Drugs acting on the respiratory system and anti-infective drugs were more frequently involved in ADRs in the pediatric population than in other groups (p < 0.001). Drugs for the nervous system, cardiovascular system, genitourinary system and sex hormones, and blood and blood- forming organs were reported more frequently as causative drugs for ADRs in the elderly (p < 0.001) (Table 3). Unlabeled ADRs were not identified. A comparison of causative drugs according to sex revealed that urological agents were more prevalently involved in ADRs in males (p < 0.001) (Fig. 2).
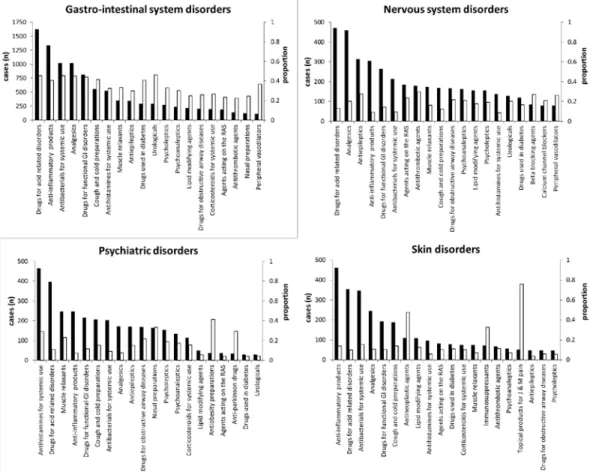
Drugs for acid related disorders and anti-inflammatory products were
19
the most common causative drugs for nervous system adverse reactions.
However, ADRs involving nervous system comprised highest proportions of ADRs which were reported to be related with antithrombotic agents and beta-blocking agents. Also, psychiatric disorders comprised largest proportion of ADRs associated with antiobesity and nasal preparations while antihistamines and drugs for acid related disorders were the most frequent suspect drugs of psychiatric disorders. Among the skin disorders, anti-inflammatory products and drugs for acid related disorders were the most common offending drugs. However the drugs with the highest proportion in skin disorders, were topical products for joint and muscle pain and antineoplastic agents (Figure 3).
20
Table 3. Causative drugs for adverse drug reactions according to the second level of anatomical therapeutic chemical classification systemd
Causative drugs Total (%)
Childrena Adultsb Elderlyc p valuee
Post hocg Alimentary tract
and metabolismh
6,984 (22.2)
74 (7.3) 4,564 (22.8)
2,346 (22.6)
<0.001 a<b,c
Drugs for acid related disorders
3,588 (11.4)
30 (3.0) 2,359 (11.8)
1,199 (11.6)
<0.001 a<b,c
Drugs for functional GI disorders
1,850 (5.9)
22 (2.2) 1,232 (6.2)
596 (5.8)
<0.001 a<b,c
Drugs used in diabetes
713 (2.3)
0 (0) 430 (2.1)
283 (2.7)
<0.001f
Others 833
(2.7)
22 (2.2) 543 (2.7)
268 (2.6) Musculo-skeletal
systemi
5,436 (17.3)
130 (12.9)
3,630 (18.1)
1,676 (16.2)
<0.001 b>a,c
Anti-
inflammatory products
3,305 (10.5)
100 (9.9) 2,233 (11.2)
972 (9.4)
<0.001 c<b
Muscle relaxants 1,057 2 (0.2) 721 334 <0.001 a<b,c
21
(3.4) (3.6) (3.2)
Others 1,074
(3.4)
28 (2.8) 676 (3.4)
370 (3.6) Nervous systemj 5,210
(16.6)
82 (8.1) 3,040 (15.2)
2,088 (20.1)
<0.001 a<b<c
Analgesics 2,262 (7.2)
33 (3.3) 1,444 (7.2)
785 (7.6)
<0.001 a<b,c
Antiepileptics 1,131 (3.6)
26 (2.6) 649 (3.2)
456 (4.4)
<0.001 b<c
Psycholeptics 812 (2.6)
8 (0.8) 443 (2.2)
361 (3.5)
<0.001 c>a,b
Psychoanaleptics 774 (2.5)
13 (1.3) 383 (1.9)
378 (3.6)
<0.001 c>a,b
Others 231
(0.7)
2 (0.2) 121 (0.6)
108 (1.0) Respiratory
systemk
4,280 (13.6)
389 (38.5)
2,784 (13.9)
1,107 (10.7)
<0.001 a>b>c
Antihistamines 1,589 (5.1)
128 (12.7)
1,079 (5.4)
391 (3.8)
<0.001 a>b>c
Cough/cold preparations
1,343 (4.3)
118 (11.7) 874 (4.4)
351 (3.4)
<0.001 a>b>c
Drugs for OA 769 80 (7.9) 433 256 <0.001 a>b,c
22
diseases (2.4) (2.2) (2.5) Nasal
preparations
491 (1.6)
51 (5.0) 347 (1.7)
93 (0.9) <0.001 a>b>c
others 79
(0.3)
12 (1.2) 51 (0.3) 16 (0.2)
Cardiovascular systeml
3,207 (10.2)
4 (0.4) 1,794 (9.0)
1,409 (13.6)
<0.001 a<b<c
Lipid modifying agents
875 (2.8)
1 (0.1) 536 (2.7)
338 (3.3)
<0.001 a<b,c
Agents acting on the RAS
783 (2.5)
1 (0.1) 442 (2.2)
340 (3.3)
<0.001 a<b<c
Calcium channel blockers
375 (1.2)
0 (0) 214 (1.1)
161 (1.6)
<0.001f
Others 1,174
(3.7)
2 (0.2) 602 (3.0)
570 (5.5) Antiinfectives for
systemic usem
2,658 (8.5)
262 (25.9)
1,880 (9.4)
516 (5.0)
<0.001 a>b>c
Antibacterials 2,240 (7.1)
252 (25.0)
1.584 (7.9)
404 (3.9)
<0.001 a>b>c
Others 418
(1.3)
10 (1.0) 296 (1.5)
112 (1.1)
GU system and 874 2 (0.2) 495 377 <0.001 a<b<c
23
sex hormonesn (2.8) (2.5) (3.6) Urologicals 629
(2.0)
1 (0.1) 278 (1.4)
350 (3.4)
<0.001 a<b<c
Others 245
(0.8)
1 (0.1) 217 (1.1)
27 (0.3)
Systemic hormonal preparationso
848 (2.7)
34 (3.4) 611 (3.1)
203 (2.0)
<0.001 c<a,b
Corticosteroids 733 (2.3)
33 (3.3) 536 (2.7)
164 (1.6)
<0.001 c<a,b
Others 115
(0.4)
1 (0.1) 75 (0.4) 39 (0.4)
Blood and blood forming organsp
768 (2.4)
3 (0.3) 412 (2.1)
353 (3.4)
<0.001 a<b<c
Antithrombotic agents
597 (1.9)
1 (0.1) 292 (1.5)
304 (2.9)
<0.001 a<b<c
Others 171
(0.5)
2 (0.2) 120 (0.6)
49 (0.5)
Antineoplasticsq 546 (1.7)
7 (0.7) 434 (2.2)
105 (1.0)
<0.001 b>a,c
Dermatologicalsr 252 (0.8)
14 (1.4) 185 (0.9)
53 (0.5) <0.001 c<a,b
24
GI, gastro-intestinal; OA, obstructive airway; GU, genito-urinary.
dNumber of adverse drug reactions (ADRs) and percentage of individual ADRs within each group.
eChi-squared test among the three groups.
fChi-squared test between the adult and elderly groups.
gBonferroni correction (p < 0.003) with chi-squared test or Fisher’s exact test.
hRanitidine, pantoprazole, levosulpiride, trimbutine, metformin, and glimepiride, etc.
iIbuprofen, loxoprofen, chlorphenesin, and orphenadrine, etc.
jAcetaminophen, combination of acetaminophen and tramadol, valproate, gabapentin, alprazolam, risperidone, donepezil, and duloxetine, etc.
kOlopatadine, levocetirizine, combination of chlorpheniramine and
dihydrocodeine, combination of acetaminophen and ephedrine, montelukast, theophylline, combination of pseudoephedrine and triprolidine, and pseudoephedrine, etc.
lAtorvastatin, pravastatin, combination of valsartan and amlodipine, combination of telmisartan and amlodipine, amlodipine, and diltiazem, etc.
mCombination of amoxicillin and clavulanate, cefaclor, and ciprofloxacin, etc.
Sensory organss 250 (0.8)
6 (0.6) 133 (0.7)
111 (1.1)
0.001 c>b
Others 85
(0.3)
3 (0.3) 61 (0.3) 21 (0.2)
25
nPentosan polysulfate, terazosin, and tolterodine, etc.
oDexamethasone, triamcinolone, and methylprednisolone, etc.
pAspirin, clopidogrel, and warfarin, etc.
qCyclosporine, mycophenolate, and capecitabine, etc.
rTerbinafine, clobetasol propionate, and benzoyl Peroxide, etc.
sHyaluronate, timolol, and fluorometholone, etc.
26
Fig. 2. Frequency of adverse drug reactions and causative drugs according to sex. GI, gastrointestinal; RAS, renin-angiotensin system;
OA, obstructive airway. Black bars: female; white bars: male.
27
Figure 3. The number of specific adverse drug reaction case and the proportion of each case among all cases according to specific drug groups.
28
Serious events
In total, 66 serious events were identified in 52 patients who experienced a life-threatening event (15 patients), hospitalization (36 patients), or persistent disability (1 patient). The life-threatening events included symptoms associated with anaphylactic reactions, dyspnea, and circulatory failure. The persistent disability involved blindness and ocular hemorrhage associated with everolimus, an antineoplastic agent.
The proportion of serious events in adults and elderly groups was 0.58%
and 0.51%, respectively. There were no serious event reports for the pediatric population. Among serious events, the most common symptoms were anaphylactic reaction (13 events, 19.7%) (Table 4).
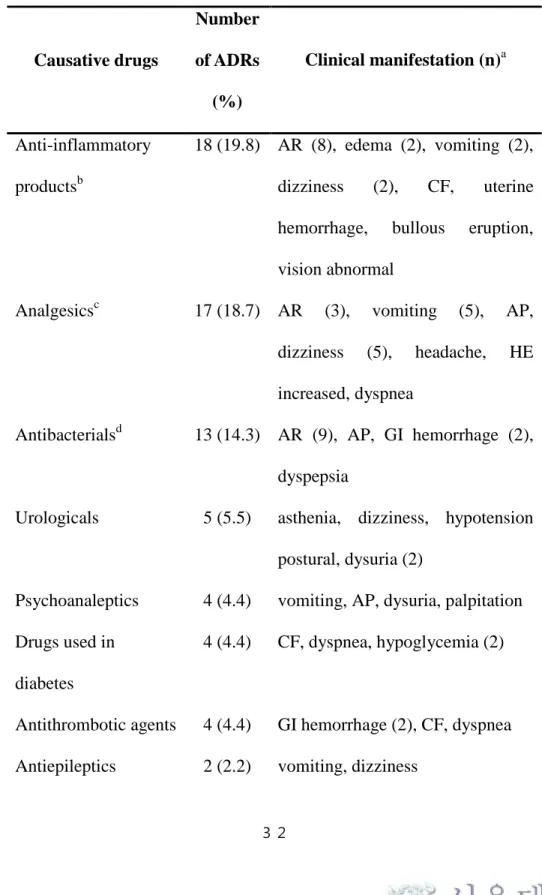
Cephalosporins and non-steroidal anti-inflammatory drugs (NSAIDs) were most frequently associated with this symptom. Non-steroidal anti- inflammatory drugs (NSAIDs) (18 ADRs, 19.8%), analgesics (17 ADRs, 18.7%), and antibacterials (13 ADRs, 14.3%) were the main causative agents for serious adverse events (Table 5).
29
Table 4. Clinical manifestation in serious events
Classification
Number of events
(%)
Clinical manifestation (n) a
General disorders 16 (24.2) Anaphylactic reaction (13), edema (2), asthenia (1)
Gastro-intestinal system disorders
15 (22.7) Vomiting (8), abdominal pain (3), gastro-intestinal hemorrhage (2), dyspepsia (1), tongue disorder (1) Nervous system
disorders
13 (19.7) Dizziness (9), headache (1), vocal cord paralysis (1), dyskinesia (1), dystonia (1)
Cardiovascular disorders
6 (9.1) Circulatory failure (2), ocular hemorrhage (1), palpitation (1), hypertension (1), hypotension postural (1)
Respiratory system disorders
3 (4.5) Dyspnea (3)
Urinary system disorders
3 (4.5) Dysuria (3)
30
Liver and biliary system disorders
3 (4.5) Hepatic enzyme increased
Skin disorders 2 (3.0) Bullous eruption (1), rash (1) Vision disorders 2 (3.0) Blindness (1), vision abnormal (1) Reproductive
disorders
2 (3.0) Uterine hemorrhage (1), intermenstrual bleeding (1) Metabolic
disorders
1 (1.5) Hypoglycemia (1)
aNumbers in parentheses indicate the number of serious events.
31
Table 5. Causative drugs and clinical manifestation in serious events
Causative drugs
Number of ADRs
(%)
Clinical manifestation (n)a
Anti-inflammatory productsb
18 (19.8) AR (8), edema (2), vomiting (2), dizziness (2), CF, uterine hemorrhage, bullous eruption, vision abnormal
Analgesicsc 17 (18.7) AR (3), vomiting (5), AP, dizziness (5), headache, HE increased, dyspnea
Antibacterialsd 13 (14.3) AR (9), AP, GI hemorrhage (2), dyspepsia
Urologicals 5 (5.5) asthenia, dizziness, hypotension postural, dysuria (2)
Psychoanaleptics 4 (4.4) vomiting, AP, dysuria, palpitation Drugs used in
diabetes
4 (4.4) CF, dyspnea, hypoglycemia (2)
Antithrombotic agents 4 (4.4) GI hemorrhage (2), CF, dyspnea Antiepileptics 2 (2.2) vomiting, dizziness
32
Digestives 2 (2.2) tongue disorder, dyskinesia Drugs for acid related
disorders
2 (2.2) GI hemorrhage, hypertension
Drugs for functional GI disorders
2 (2.2) vocal cord paralysis, dystonia
Sex hormones 2 (2.2) dizziness, intermenstrual bleeding Cough and cold
preparations
2 (2.2) AR, rash
Drugs for OA disease 2 (2.2) AR, AP Peripheral
vasodilators
2 (2.2) vomiting, dizziness
Antineoplastic agents 2 (2.2) blindness, ocular hemorrhage Antivirals 1 (1.1) vomiting
Antimycotics 1 (1.1) HE increased Nasal preparations 1 (1.1) dysuria Cardiac therapy 1 (1.1) CF Lipid modifying
agents
1 (1.1) CF
Agents acting on the RAS
1 (1.1) vomiting
33
Immunosuppressants 1 (1.1) HE increased Corticosteroids 1 (1.1) HE increased
ADRs, adverse drug reactions; GI, gastrointestinal; OA, obstructive airway diseases; RAS, renin-angiotensin system; AR, anaphylactic reaction; AP, abdominal pain; HE, hepatic enzyme; CF, circulatory failure.
aNumbers in parentheses indicate the number of adverse drug reactions.
bDexibuprofen, loxoprofen, and celecoxib, etc.
cCombination of acetaminophen and tramadol, buprenorphine, and sumatriptan, etc.
dCefaclor, cefadroxil, and amoxicillin, etc.
34
Nonprescription drugs
Nonprescription drugs were implicated in 394 patients and 680 ADRs. The adult group comprised the largest portion of patients (76.4%), followed by the elderly group (18.8%) and children (4.8%).
Skin disorders (181 events, 29.6%) including rash and pruritus were the most frequently reported manifestations, followed by GI system disorders (155 events, 25.3%) such as dyspepsia and nausea. Among a total of 186 causative drugs, NSAIDs (110 ADRs, 16.2%) and topical products for joint and muscular pain (56 ADRs, 8.2%) were most common. A combination drug containing acetaminophen and chlorzoxazone (40 ADRs, 5.8%) was the most prevalent individual drug, followed by naproxen (37 ADRs, 5.4%) and ibuprofen (29 ADRs, 4.2%) (Table 6). A comparison of ADRs by nonprescription drugs according to age in 394 patients revealed that NSAIDs and GI system disorders were more frequently involved in children than in other groups (p < 0.001). NSAIDs and GI system disorders respectively comprised 48.7% of the ADRs by nonprescription drugs in the pediatric group.
35
Table 6. Causative drugs and clinical manifestation among the nonprescription drugsa
Causative drugs
Number of ADRs
(%)
Clinical manifestation (n)b
Musculo-skeletal system Acetaminophen/c hlorzoxazone
40 (5.8) dizziness (10), pruritus (3), urticaria (3), dyspepsia (3), vomiting (3), nausea (3), rash (2)
Naproxen 37 (5.4) dyspepsia (6), edema (4), pruritus (4), rash (4), abdominal pain (2)
Ibuprofen 29 (4.2) dyspepsia (4), vomiting (3), abdominal pain (3), urticaria (3), dizziness (2)
Ketoprofen patch 17 (2.5) rash (6), pruritus (4), skin exfoliation (2)
Dexibuprofen 16 (2.3) urticaria (6), edema periorbital (3), dizziness (2)
Ibuprofen arginine
15 (2.2) edema periorbital (4), pruritus (3), nausea (2), sweating increase (2)
36
Flurbiprofen patch
13 (1.9) rash (4), pruritus (2), skin exfoliation (2), dermatitis (2)
Clonixin 9 (1.3) urticaria (3) Alimentary tract
Antacid
combinationsc
10 (1.4) constipation (2)
Respiratory system Pseudoephedrine/t riprolidine
18 (2.6) insomnia (4), dizziness (2), sweating increase (2), somnolence (2)
Cetirizine 11 (1.6) headache (2), somnolence (2) Flurbiprofen 8.75
mg
9 (1.3) dizziness (2), palpitation (2)
Nervous system Acetaminophen/m ethionine
25 (3.6) edema (3), nausea (3), rash (3), urticaria (2), vomiting (2), dyspnea (2), drug dependence (2)
Gingko leaf ext. 10 (1.4) pruritus (2), dyspepsia (2) Nicotine patch 9 (1.3) dermatitis (3), pruritus (2) Diphenhydramine 7 (1.0) abdominal pain (2)
GU system and sex hormones
37
Agnus Castus fruit ext.
18 (2.6) abdominal pain (4), rash (2), nausea (2), acne (2)
Desogestrel/
ethinyl Estradiol
14 (2.0) menstrual disorder (4), nausea (2), weight increase (2)
Gestodene/ethinyl Estradiol
12 (1.7) edema (2), acne (2)
Dermatologicals Benzoyl peroxide ointment
8 (1.2) rash (3), pruritus (2)
ADRs, adverse drug reactions; GU, genito-urinary.
a680 adverse drug reactions from 394 patients.
bClinical manifestations reported for more than one adverse drug reaction and the number of adverse drug reactions.
cCombinations of aluminum magnesium silicate/ranitidine/magnesium oxide/aluminum magnesium hydroxide.
38
DISCUSSION
39
To the best of our knowledge, this is the first large-scale study of CP- reported ADRs in outpatients in Korea. Reports of clinical manifestations affecting the GI system, nervous system, and psychiatric disorders were prevalent. The most frequent causative drugs were those used to treat acid-related disorders, anti-inflammatory products, analgesics, and antibacterials. ADR patterns differed by age group. Our findings suggest the need to establish pharmacovigilance strategies adapted to outpatient characteristics and age group.
In this study, females comprised around two-thirds (66.9%) of the study cohort who had experienced ADRs, which could be explained by the epidemiological population distribution (female, 58.3%) among the average daily number of outpatients [20]. A multinational study reported that the ADR reporting rate of antidepressants was not significantly different between men and women when considering drug consumption [21]. However, other studies have suggested a preponderance of ADRs in female patients [13,22,23]. The higher adverse event rate in females has been found to result from differences in pharmacokinetic factors [22], hormonal factors [24], drug prescription rate [23], medical care utilization [20,25], propensity of
40
symptom reporting [25], and a historical lack of drug research in this population [26]. In the present study, women also experienced more than twice the number of anaphylactic reactions compared to men.
Ribeiro-Vaz et al. also showed that females are more likely to experience anaphylaxis [27].
Comparison of the ADR reports by CPs with the entire set of ADR reports to KIDS during the same period showed that the prevalent ADR symptoms were GI and nervous system disorders and the most frequent causative drugs were anti-inflammatory products, analgesics, and antibacterials in both reports [10]. However, the proportion of serious events (0.54%) in reports by CPs was much lower than that in the entire ADR dataset (11.2%) [10], which can be explained mainly by the relatively less severe medical state of outpatients and by the limited experience of CPs in ADR reporting. The non-seriousness that prevails in early periods of pharmacovigilance by a new expert group may be one of the reasons for the low proportion of serious events in this study [28].
The clinical manifestations and causative drugs showed specific trends according to age. In the pediatric group, GI system disorders, especially diarrhea, and antibacterial agents were most frequent. These results are consistent with previous reports. Two systematic reviews
41
and a prospective cohort study showed that antibacterial agents and GI disorders were the leading causes and symptoms, respectively, of ADRs in pediatric outpatients [14,29,30]. In this study, antibacterial agents comprised 46.1% of the drugs causing diarrhea in children.
Infants aged less than 24 months and patients taking broad-spectrum penicillins or cephalosporins accounted for 37.0% and 81.9% of the children who experienced antibacterial-associated diarrhea. These results are consistent with the risk associated with reduced fecal flora in infants and broad-spectrum penicillins and cephalosporins in pediatric diarrhea [31,32].
Dizziness was the most common symptom in the elderly, consistent with reports of a 30% prevalence in older populations [33]. Maarsingh et al. showed that medications were the second leading cause of dizziness following comorbidities such as cardiovascular and peripheral vestibular disease in the elderly [34]. In this study, the main drugs associated with dizziness were those used to treat the nervous system (29.5%), such as combination drugs containing acetaminophen and tramadol (9.3%), gabapentin (3.9%), and pregabalin (3.8%).
Considering the risk of secondary injury resulting from dizziness in the elderly, use of these drugs should be carefully monitored and evaluated.
Cephalosporin antibiotics and NSAIDs were mainly associated with
42
anaphylactic reactions, which was the major clinical manifestation in serious events. A review of a decade of spontaneous ADR reports showed similar results; antibiotics and the combination of NSAIDs and acetaminophen were primarily responsible for the incidence of anaphylaxis [27].
For nonprescription drugs, skin and GI system disorders were most prevalent, and were chiefly caused by NSAIDs such as naproxen and ibuprofen. A prospective multi-center study also reported that the most frequent nonprescription drugs causing ADR-related hospital admissions were NSAIDs including aspirin, diclofenac, and ibuprofen;
the leading symptoms were GI disorders [35].
This study has several limitations. First, we relied on spontaneous reporting, which is subject to under-reporting and lack of information [36,37]. All data were retrospective and we were unable to confirm accuracy or replace missing data. However, spontaneous reporting by CPs has the advantages of providing the direct outpatient complaints [38]. Second, although these pharmacovigilance systems are intended to detect signals, unlabeled ADRs were not identified; therefore, we could not suggest any potential signals. Third, we could not account for the size of the at-risk population because of a lack of information on substantial drug usage (the number of prescriptions for each causative
43
drug at each participating pharmacy) in outpatients. Because commonly prescribed drugs are more likely to be the offenders in ADR events [39], considering the prevalence of drug usage might aid in the interpretation of ADR frequency.
44
CONCLUSION
45
In summary, among the outpatient ADRs spontaneously reported by CPs, those involving the GI system, nervous system, and psychiatric disorders were prevalent. Anti-inflammatory products, analgesics, and antibacterials were the leading causes of ADRs, including serious events. The patterns of outpatient ADRs reported by CPs also differed between age groups.
46
REFERENCES
47
1. World Health Organization. International drug monitoring: the role of national centres. Report of a WHO meeting. World Health Organ Tech Rep Ser. 1972; 488: 1-25.
2. Al Hamid A, Ghaleb M, Aljadhey H, Aslanpour Z.A systematic review of hospitalization resulting from medicine-related problems in adult patients. Br J Clin Pharmacol.2014; 78: 202-217.
doi: 10.1111/bcp.12293.
3. Kongkaew C, Hann M, Mandal J, Williams SD, Metcalfe D, Noyce PR, et al. Risk factors for hospital admissions associated with adverse drug events. Pharmacotherapy. 2013; 33: 827-837.
doi: 10.1002/phar.1287.
4. Lagnaoui R, Moore N, Fach J, Longy-Boursier M, Begaud B.
Adverse drug reactions in a department of systemic diseases- oriented internal medicine: prevalence, incidence, direct costs and avoidability. Eur J Clin Pharmacol. 2000; 56: 181-186.
5. Gandhi TK, Weingart SN, Borus J, Seger AC, Peterson J, Burdick E, et al. Adverse drug events in ambulatory care. N Engl J Med.
2003; 348: 1556-1564. doi: 10.1056/NEJMsa020703
6. Willis A, Rivers P, Gray LJ, Davies M, Khunti K. The effectiveness of screening for diabetes and cardiovascular disease risk factors in a community pharmacy setting. PLoS One. 2014; 9:
48
e91157. doi: 10.1371/journal.pone.0091157
7. Perraudin C, Le Vaillant M, Pelletier-Fleury N. Cost-Effectiveness of a Community Pharmacist-Led Sleep Apnea Screening Program - A Markov Model. PLoS One. 2013; 8: e63894.
8. Leone R, Moretti U, D'Incau P, Conforti A, Magro L, Lora R, et al.
Effect of pharmacist involvement on patient reporting of adverse drug reactions: first Italian study. Drug Saf. 2013; 36: 267-276. doi:
10.1007/s40264-013-0028-8.
9. Shin YS, Lee YW, Choi YH, Park B, Jee YK, Choi SK, et al.
Spontaneous reporting of adverse drug events by Korean regional pharmacovigilance centers. Pharmacoepidemiol Drug Saf. 2009;
18: 910-915.doi: 10.1002/pds.1796.
10. Korea Institute of Drug Safefy & Risk Management. Trends in drug safety information reporting. 2014. Available:
https://www.drugsafe.or.kr/iwt/ds/ko/bbs/EgovBbs.do?bbsId=BBS MSTR_000000000021 /1/10/14.
11. van Grootheest K, Olsson S, Couper M, de Jong-van den Berg L.
Pharmacists' role in reporting adverse drug reactions in an international perspective. Pharmacoepidemiol Drug Saf. 2004; 13:
457-464.
12. van Grootheest AC, de Jong-van den Berg LT. The role of hospital
49
and community pharmacists in pharmacovigilance. Res Social Adm Pharm. 2005; 1: 126-133.
13. Bourgeois FT, Shannon MW, Valim C, Mandl KD. Adverse drug events in the outpatient setting: an 11-year national analysis.
Pharmacoepidemiol Drug Saf.2010; 19: 901-910.
doi:10.1002/pds.1984.
14. Tache SV, Sonnichsen A, Ashcroft DM. Prevalence of adverse drug events in ambulatory care: a systematic review. Ann Pharmacother. 2011; 45: 977-989. doi: 10.1345/aph.1P627.
15. World Health Organization. WHO-UMC causality assessment.
2012. Available:
http://www.who-umc.org/DynPage.aspx?id=98029&
quicksearchquery=umc+category: /1/9/14.
16. Byrt T. How good is that agreement? Epidemiology. 1996; 7: 561.
17. World Health Oganization. The WHO Adverse Reaction Terminology (WHO-ART). 2005. Available:
http://www.umc-products.com/DynPage.aspx?id=73589&
mn1=1107&mn2=1664: /1/9/14
18. World Health Oganization. Anatomical Therapeutic Chemical (ATC) Classification System. 2013. Available:
http://www.whocc.no/atc_ddd_index/ 1/9/14.
50
19. Edwards IR, Aronson JK. Adverse drug reactions: definitions, diagnosis, and management. Lancet. 2000; 356: 1255-1259.
20. Statistics Korea. Statistical database of Korean Statistical Information Service. 2014. Available:
http://kosis.kr/statisticsList/statisticsList_01List.jsp?vwcd=MT_Z TITLE&parentId=D:/1/10/14.
21. D'Incau P, Lapeyre-Mestre M, Carvajal A, Donati M, Salado I, Rodriguezet L, et al. No differences between men and women in adverse drug reactions related to psychotropic drugs: a survey from France, Italy and Spain. Fundam Clin Pharmacol. 2014; 28:
342-348.
22. Tran C, Knowles SR, Liu BA, Shear NH. Gender differences in adverse drug reactions. J Clin Pharmacol. 1998; 38: 1003-1009.
23. Capuano A, Irpino A, Gallo M, Ferrante L, Illiano ML, Rinaldi B, et al. Regional surveillance of emergency-department visits for outpatient adverse drug events. Eur J Clin Pharmacol. 2009; 65:
721-728. doi:10.1007/s00228-009-0641-8.
24. Drici MD, Clement N. Is gender a risk factor for adverse drug reactions? The example of drug-induced long QT syndrome. Drug Saf. 2001; 24: 575-585.
25. Ladwig KH, Marten-Mittag B, Formanek B, Dammann G. Gender
51
differences of symptom reporting and medical health care utilization in the German population. Eur J Epidemiol. 2000; 16:
511-518.
26. Vidaver RM, Lafleur B, Tong C, Bradshaw R, Marts SA. Women subjects in NIH-funded clinical research literature: lack of progress in both representation and analysis by sex. J Womens Health Gend Based Med. 2000; 9: 495-504.
27. Ribeiro-Vaz I, Marques J, Demoly P, Polonia J, Gomes ER. Drug- induced anaphylaxis: a decade review of reporting to the Portuguese Pharmacovigilance Authority. Eur J Clin Pharmacol.
2013; 69: 673-681. doi: 10.1007/s00228-012-1376-5.
28. Conforti A, Opri S, D'Incau P, Sottosanti L, Moretti U, Ferrazin F, et al. Adverse drug reaction reporting by nurses: analysis of Italian pharmacovigilance database. Pharmacoepidemiol Drug Saf, 2012;
21: 597-602. doi: 10.1002/pds.3225.
29. Kaushal R, Goldmann DA, Keohane CA, Christino M, Honour M, Hale AS, et al. Adverse drug events in pediatric outpatients.
Ambul Pediatr. 2007; 7: 383-389.
30. Smyth RM, Gargon E, Kirkham J, Cresswell L, Golder S, Smyth R, et al. Adverse drug reactions in children--a systematic review.
PLoS One. 2012; 7: e24061.doi: 10.1371/journal.pone.0024061
52
31. Wistrom J, Norrby SR, Myhre EB, Eriksson S, Granstrom G, Lagergren L, et al. Frequency of antibiotic-associated diarrhoea in 2462 antibiotic-treated hospitalized patients: a prospective study. J Antimicrob Chemother. 2001; 47: 43-50.
32. Penders J, Thijs C, Vink C, Stelma FF, Snijders B, Kummeling I, et al. Factors influencing the composition of the intestinal microbiota in early infancy. Pediatrics. 2006; 118: 511-521.
33. Sloane PD, Coeytaux RR, Beck RS, Dallara J. Dizziness: state of the science. Ann Intern Med. 2001; 134: 823-832.
34. Maarsingh OR, Dros J, Schellevis FG, van Weert HC, van der Windt DA, ter Riet G, et al. Causes of persistent dizziness in elderly patients in primary care. Ann Fam Med. 2010; 8: 196-205.
doi: 10.1370/afm.1116.
35. Schmiedl S, Rottenkolber M, Hasford J, Rottenkolber D, Farker K, Drewelow B, et al. Self-medication with over-the-counter and prescribed drugs causing adverse-drug-reaction-related hospital admissions: results of a prospective, long-term multi-centre study.
Drug Saf. 2014; 37: 225-235. doi:10.1007/s40264-014-0141-3.
36. Mazzitello C, Esposito S, De Francesco AE, Capuano A, Russo E, De Sarro G. Pharmacovigilance in Italy: An overview. J Pharmacol Pharmacother. 2013; 4: S20-28. doi:10.4103/0976-500-
53
X.120942.
37. Inman WH. Attitudes to adverse drug reaction reporting. Br J Clin Pharmacol. 1996; 41: 434-435.
38. McLernon DJ, Bond CM, Hannaford PC, Watson MC, Lee AJ, Hazell L, et al. Adverse drug reaction reporting in the UK: a retrospective observational comparison of yellow card reports submitted by patients and healthcare professionals. Drug Saf. 2010;
33: 775-788. doi: 10.2165/11536510-000000000-00000.
39. Thomsen LA, Winterstein AG, Sondergaard B, Haugbolle LS, Melander A. Systematic review of the incidence and characteristics of preventable adverse drug events in ambulatory care. Ann Pharmacother. 2007; 41: 1411-1426.
54
APPENDIX
55
Appendix 1.
The Clinical Characteristics of Adverse Drug Reactions Reported from the Community Pharmacy
Objective: To evaluate the clinical manifestations and causative drugs of the outpatient adverse drug reactions (ADRs) reported by community pharmacy.
Methods: From April 2013 to September 2013, all outpatient ADRs reported by community pharmacy to Regional Pharmacovigilance Center of Korean Pharmaceutical Association were included. The causality of ADRs was assessed by the criteria of WHO-Uppsala Monitoring Centre. The clinical features and the offending drugs were analyzed using the WHO-Adverse Reaction Terminology and the classification of American Hospital Formulary Service Drug Information, respectively. Results: 2,826 (97.0%) of the total 2,912 ADRs had causal relationship. The 1,923 patients with mean age of 55.1 years and female fraction of 66.5% were included in the ADRs.
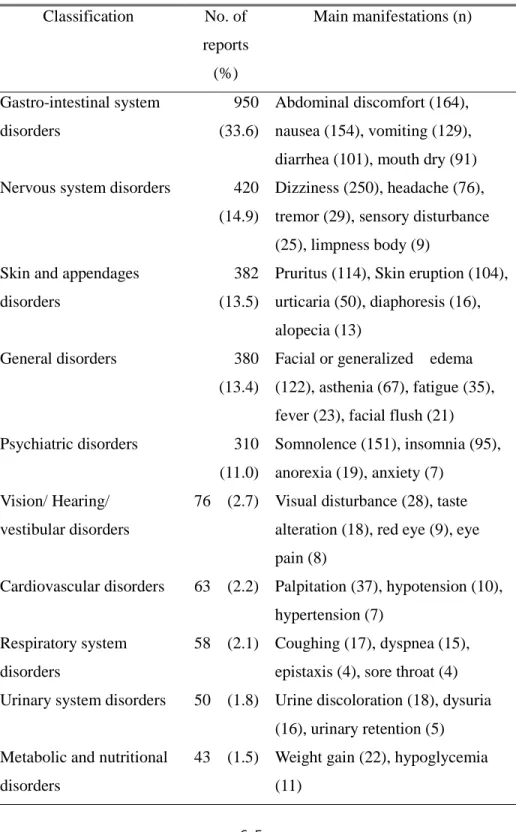
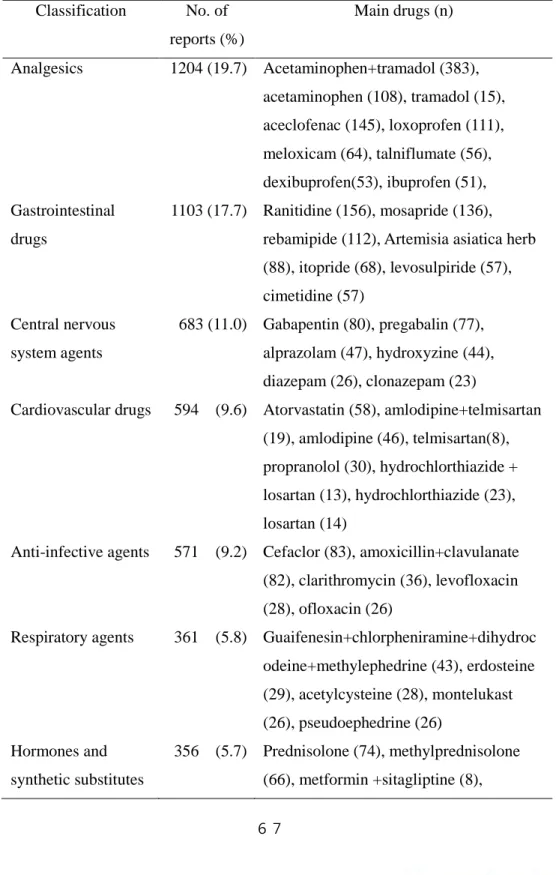
Gastrointestinal (33.6%), nervous system (14.9%), and skin (13.5%) symptoms were common in ADRs. Analgesic drugs (19.7%), gastrointestinal drugs (17.7%), and central nervous system drugs (11.0%) were prevalent offending drugs. The leading causative generic drug was the complex of acetaminophen and tramadol. Among 203 ADRs by the nonprescription drugs, the most common clinical features were skin (37.4%) and gastrointestinal
56