저작자표시-비영리-변경금지 2.0 대한민국 이용자는 아래의 조건을 따르는 경우에 한하여 자유롭게
l 이 저작물을 복제, 배포, 전송, 전시, 공연 및 방송할 수 있습니다. 다음과 같은 조건을 따라야 합니다:
l 귀하는, 이 저작물의 재이용이나 배포의 경우, 이 저작물에 적용된 이용허락조건 을 명확하게 나타내어야 합니다.
l 저작권자로부터 별도의 허가를 받으면 이러한 조건들은 적용되지 않습니다.
저작권법에 따른 이용자의 권리는 위의 내용에 의하여 영향을 받지 않습니다. 이것은 이용허락규약(Legal Code)을 이해하기 쉽게 요약한 것입니다.
Disclaimer
저작자표시. 귀하는 원저작자를 표시하여야 합니다.
비영리. 귀하는 이 저작물을 영리 목적으로 이용할 수 없습니다.
변경금지. 귀하는 이 저작물을 개작, 변형 또는 가공할 수 없습니다.
교육학석사 학위논문
Ferroelectric polarization switching dynamics and wake-up effect
in Si doped HfO 2
실리콘이 도핑된 산화물 하프늄에서의 강유전성 분극 스위칭 동역학과 wake-up 효과
2018년 8월
서울대학교 대학원 과학교육과 물리전공
이 태 윤
Abstract
Ferroelectricity in ultra-thin HfO2 offers a viable alternative for the ferroelectric random access memory. The reliable switching behavior is highly required before commercial applications, whereas many intriguing features have not been understood yet clearly. Herein, we report an increase in the remnant polarization after electric field cycling, known as the wake-up effect, in terms of the change in the polarization switching dynamics of a Si-doped HfO2 thin film.
Compared with the pristine specimen, the Si-doped HfO2 thin film exhibited a partial increase in the polarization value after a finite number of ferroelectric switching behaviors. Polarization switching behaviors were analyzed using the nucleation limited switching model, accompanied by defects charged randomly.
The polarization switching was simulated using the Monte Carlo method with respect to the effect of defects. Comparing the experimental results with the simulations revealed that the wake-up effect of the HfO2 thin film was due to suppression of chemical disorder.
KEYWORDS: Ferroelectricity, HfO2, FeRAM, Defects, Thin films, Domain switching
Student number: 2016-27278
Contents
Abstract ∙ ∙ ∙ ∙ ∙ ∙ ∙ ∙ ∙ ∙ ∙ ∙ ∙ ∙ ∙ ∙ ∙ ∙ ∙ ∙ ∙ ∙ ∙ ∙ ∙ ∙ ∙ ∙ ∙ ∙ ∙ ∙ ∙ ∙ ∙ ∙ ∙ ∙ ∙ ∙ ∙ ∙ ∙ ∙ ∙ ∙ ∙ ∙ ∙ ∙ ∙ ∙ ∙ ∙ ∙ ∙ ∙ ⅰ
Contents ∙ ∙ ∙ ∙ ∙ ∙ ∙ ∙ ∙ ∙ ∙ ∙ ∙ ∙ ∙ ∙ ∙ ∙ ∙ ∙ ∙ ∙ ∙ ∙ ∙ ∙ ∙ ∙ ∙ ∙ ∙ ∙ ∙ ∙ ∙ ∙ ∙ ∙ ∙ ∙ ∙ ∙ ∙ ∙ ∙ ∙ ∙ ∙ ∙ ∙ ∙ ∙ ∙ ∙ ∙ ∙ ⅱ
List of figure ∙ ∙ ∙ ∙ ∙ ∙ ∙ ∙ ∙ ∙ ∙ ∙ ∙ ∙ ∙ ∙ ∙ ∙ ∙ ∙ ∙ ∙ ∙ ∙ ∙ ∙ ∙ ∙ ∙ ∙ ∙ ∙ ∙ ∙ ∙ ∙ ∙ ∙ ∙ ∙ ∙ ∙ ∙ ∙ ∙ ∙ ∙ ∙ ∙ ∙ ∙ ∙ ⅳ
Ⅰ. Introduction ∙ ∙ ∙ ∙ ∙ ∙ ∙ ∙ ∙ ∙ ∙ ∙ ∙ ∙ ∙ ∙ ∙ ∙ ∙ ∙ ∙ ∙ ∙ ∙ ∙ ∙ ∙ ∙ ∙ ∙ ∙ ∙ ∙ ∙ ∙ ∙ ∙ ∙ ∙ ∙ ∙ ∙ ∙ ∙ ∙ ∙ ∙ ∙ ∙ ∙ ∙ ∙ 1
Ⅱ. Structure analysis of Si:HfO2 thin films ∙ ∙ ∙ ∙ ∙ ∙ ∙ ∙ ∙ ∙ ∙ ∙ ∙ ∙ ∙ ∙ ∙ ∙ ∙ ∙ ∙ ∙ ∙ ∙ ∙ ∙ ∙ ∙ ∙ 5
2.1 Structure analysis using XRD and TEM ∙ ∙ ∙ ∙ ∙ ∙ ∙ ∙ ∙ ∙ ∙ ∙ ∙ ∙ ∙ ∙ ∙ ∙ ∙ ∙ ∙ ∙ ∙ ∙ ∙ ∙ ∙ ∙ 5
2.2 Details of the geometric phase analysis (GPA) used for domain mapping ∙ ∙ 8
Ⅲ. Electric properties of Si:HfO2 thin films∙ ∙ ∙ ∙ ∙ ∙ ∙ ∙ ∙ ∙ ∙ ∙ ∙ ∙ ∙ ∙ ∙ ∙ ∙ ∙ ∙ ∙ ∙ ∙ ∙ ∙ ∙ 11
3.1 Ferroelectric hysteresis and wake-up effect in Si:HfO2 ∙ ∙ ∙ ∙ ∙ ∙ ∙ ∙ ∙ ∙ ∙ ∙ ∙ ∙ ∙ ∙ 11
3.2 Double switching current induced by non-uniform dipole defect ∙ ∙ ∙ ∙ ∙ ∙ ∙ ∙ 13
3.3 AC frequency dependence of polarization-voltage hysteresis ∙ ∙ ∙ ∙ ∙ ∙ ∙ ∙ ∙ ∙ ∙ 15
Ⅳ. Ferroelectric polarization switching dynamics of Si:HfO2 thin films ∙ ∙ ∙ ∙ 17
4.1 Time-dependent ferroelectric polarization switching behavior ∙ ∙ ∙ ∙ ∙ ∙ ∙ ∙ ∙ ∙ 17
4.2 E-field cycling effect on ferroeletric polarization switching behavior ∙∙∙∙∙ 20
4.3 Details of the experimental method used for measuring the time-dependent switched polarization under various external voltages ∙ ∙ ∙ ∙ ∙ ∙ ∙ ∙ ∙ ∙ ∙ ∙ ∙ ∙ ∙ ∙ ∙ 23
Ⅴ. Monte Carlo simulation of ferroelectric properties as a function of defect density ∙ ∙ ∙ ∙ ∙ ∙ ∙ ∙ ∙ ∙ ∙ ∙ ∙ ∙ ∙ ∙ ∙ ∙ ∙ ∙ ∙ ∙ ∙ ∙ ∙ ∙ ∙ ∙ ∙ ∙ ∙ ∙ ∙ ∙ ∙ ∙ ∙ ∙ ∙ ∙ ∙ ∙ ∙ ∙ ∙ ∙ ∙ ∙ ∙ ∙ ∙ ∙ ∙ 25
Ⅵ. Conclusion ∙ ∙ ∙ ∙ ∙ ∙ ∙ ∙ ∙ ∙ ∙ ∙ ∙ ∙ ∙ ∙ ∙ ∙ ∙ ∙ ∙ ∙ ∙ ∙ ∙ ∙ ∙ ∙ ∙ ∙ ∙ ∙ ∙ ∙ ∙ ∙ ∙ ∙ ∙ ∙ ∙ ∙ ∙ ∙ ∙ ∙ ∙ ∙ ∙ ∙ ∙ 30
References ∙ ∙ ∙ ∙ ∙ ∙ ∙ ∙ ∙ ∙ ∙ ∙ ∙ ∙ ∙ ∙ ∙ ∙ ∙ ∙ ∙ ∙ ∙ ∙ ∙ ∙ ∙ ∙ ∙ ∙ ∙ ∙ ∙ ∙ ∙ ∙ ∙ ∙ ∙ ∙ ∙ ∙ ∙ ∙ ∙ ∙ ∙ ∙ ∙ ∙ ∙ ∙ ∙ ∙ ∙ 32
Appendix ∙ ∙ ∙ ∙ ∙ ∙ ∙ ∙ ∙ ∙ ∙ ∙ ∙ ∙ ∙ ∙ ∙ ∙ ∙ ∙ ∙ ∙ ∙ ∙ ∙ ∙ ∙ ∙ ∙ ∙ ∙ ∙ ∙ ∙ ∙ ∙ ∙ ∙ ∙ ∙ ∙ ∙ ∙ ∙ ∙ ∙ ∙ ∙ ∙ ∙ ∙ ∙ ∙ ∙ ∙ ∙ 39
국문초록 ∙ ∙ ∙ ∙ ∙ ∙ ∙ ∙ ∙ ∙ ∙ ∙ ∙ ∙ ∙ ∙ ∙ ∙ ∙ ∙ ∙ ∙ ∙ ∙ ∙ ∙ ∙ ∙ ∙ ∙ ∙ ∙ ∙ ∙ ∙ ∙ ∙ ∙ ∙ ∙ ∙ ∙ ∙ ∙ ∙ ∙ ∙ ∙ ∙ ∙ ∙ ∙ ∙ ∙ ∙ ∙ 47
List of figure
Figure 1-1. Schematic diagram of the crystal structure of ferroelectric orthorhombic HfO2 with displacement of oxygen ions for spontaneous polarization. ∙ ∙ ∙ ∙ ∙ ∙ ∙ ∙ ∙ ∙ ∙ ∙ ∙ ∙ ∙ ∙ ∙ ∙ ∙ ∙ ∙ ∙ ∙ ∙ ∙ ∙ ∙ ∙ ∙ ∙ ∙ ∙ ∙ ∙ ∙ ∙ ∙ ∙ ∙ ∙ ∙ ∙ ∙ ∙ ∙ ∙ ∙ ∙ ∙ ∙ 4
Figure 2-1. Grazing-incidence X-ray diffraction (GIXRD) scans for the 8-nm-thick Si:HfO2 film containing 4.2 mol% Si after annealing at 600°C for 20 s.
The inset shows the fitting result for the GIXRD peaks over the 27.5–
32.5° region using Gaussian functions. The green and red peaks correspond to monoclinic and orthorhombic phases, respectively. Sum of their intensities is indicated by red solid line. ∙ ∙ ∙ ∙ ∙ ∙ ∙ ∙ ∙ ∙ ∙ ∙ ∙ ∙ ∙ ∙ ∙ ∙ 6
Figure 2-2. Transmission electron microscopy image of the cross-section of the Si- doped HfO2 film. Domain boundaries are indicated by yellow lines.
Orthorhombic and monoclinic phases are colored red and green, respectively. ∙ ∙ ∙ ∙ ∙ ∙ ∙ ∙ ∙ ∙ ∙ ∙ ∙ ∙ ∙ ∙ ∙ ∙ ∙ ∙ ∙ ∙ ∙ ∙ ∙ ∙ ∙ ∙ ∙ ∙ ∙ ∙ ∙ ∙ ∙ ∙ ∙ ∙ ∙ ∙ ∙ ∙ ∙ ∙ ∙ ∙ ∙ 7
Figure 2-3. (a) High-resolution transmission electron microscopy (HR-TEM) image of the 4.2% Si:HfO2 film capped with TiN electrodes. (b) Fast Fourier transform image of the selected area (red box) in Figure 2-3.
Insets are the phase images of spots 1 and 2. (c) A domain in the εyy
strain map of the Si-doped HfO2 film and (d) the corresponding HR- TEM image. (e) εyy and (f) εxx strain maps with total domain assignments and (g) the corresponding HR-TEM images. ∙ ∙ ∙ ∙ ∙ ∙ ∙ ∙ ∙ ∙ 9
Figure 3-1. Polarization–voltage measurement performed on pristine, preset and woken-up cells having the Pt/TiN/Si:HfO2/TiN capacitor structure.∙ ∙ ∙
∙ ∙ ∙ ∙ ∙ ∙ ∙ ∙ ∙ ∙ ∙ ∙ ∙ ∙ ∙ ∙ ∙ ∙ ∙ ∙ ∙ ∙ ∙ ∙ ∙ ∙ ∙ ∙ ∙ ∙ ∙ ∙ ∙ ∙ ∙ ∙ ∙ ∙ ∙ ∙ ∙ ∙ ∙ ∙ ∙ ∙ ∙ ∙ ∙ ∙ ∙ ∙ ∙ ∙ ∙ 12
Figure 3-2. Switching current was measured during the polarization switching process from down to up domains, and the current data were fitted by the sum (red solid line) of two Lorentzian distributions (orange and green regions) for the (a) preset and (b) woken-up cells. ∙ ∙ ∙ ∙ ∙ ∙ ∙ ∙ ∙ 14
Figure 3-3. Polarization-voltage (P-V) hysteresis loop with various AC frequency from 200 Hz to 20 kHz at room temperature. The inset shows a time- dependent polarization value by 2 kHz pulse.∙ ∙ ∙ ∙ ∙ ∙ ∙ ∙ ∙ ∙ ∙ ∙ ∙ ∙ ∙ ∙ ∙ ∙ ∙16
Figure 4-1. Time-dependent switched polarization (∆P(t)) as a function of external
voltage (Vext) at room temperature for the (a) preset and (b) woken-up cells. The solid lines correspond to the fitting results using the nucleation limited switching (NLS) model with a Lorentzian distribution of the characteristic switching time. ∙ ∙ ∙ ∙ ∙ ∙ ∙ ∙ ∙ ∙ ∙ ∙ ∙ ∙ ∙ ∙ ∙ 19
Figure 4-2. Solid lines and dashed lines correspond to Lorentzian distributions of the fitting functions for the preset and woken-up cells, respectively. ∙∙∙
∙∙∙∙∙∙∙∙∙∙∙∙∙∙∙∙∙∙∙∙∙∙∙∙∙∙∙∙∙∙∙∙∙∙∙∙∙∙∙∙∙∙∙∙∙∙∙∙∙∙∙∙∙∙∙∙ 22
Figure 4-3. Schematic diagram of the pulse trains used to measure the (a) nonswitching polarization (Pns) and the (b) switching polarization (Psw).
∙ ∙ ∙ ∙ ∙ ∙ ∙ ∙ ∙ ∙ ∙ ∙ ∙ ∙ ∙ ∙ ∙ ∙ ∙ ∙ ∙ ∙ ∙ ∙ ∙ ∙ ∙ ∙ ∙ ∙ ∙ ∙ ∙ ∙ ∙ ∙ ∙ ∙ ∙ ∙ ∙ ∙ ∙ ∙ ∙ ∙ ∙ ∙ ∙ ∙ ∙ ∙ ∙ ∙ ∙ ∙ 24
Figure 5-1. Monte Carlo simulations of ferroelectric polarization hysteresis loop as a function of defect ratio. ∙ ∙ ∙ ∙ ∙ ∙ ∙ ∙ ∙ ∙ ∙ ∙ ∙ ∙ ∙ ∙ ∙ ∙ ∙ ∙ ∙ ∙ ∙ ∙ ∙ ∙ ∙ ∙ ∙ ∙ ∙ ∙ ∙ ∙ ∙ 27
Figure 5-2. (a) MCS dependence of ferroelectric polarization switching with external field E = 9.0 (a. u.). (b) Lorentzian distributions of fitting functions for 4% (solid navy line), 16% (solid purple line) and 36%
(solid orange line) defect ratios, respectively. ∙ ∙ ∙ ∙ ∙ ∙ ∙ ∙ ∙ ∙ ∙ ∙ ∙ ∙ ∙ ∙ ∙ ∙ ∙ 28
Figure 5-3. (a) and (b) Snapshots of ferroelectric polarization switching for defect ratios of 0% and 4% with E = 7.0 (a. u.), respectively. ∙∙∙∙∙∙∙∙∙∙∙∙ 29
Ⅰ . Introduction
Extensive research has been conducted on the binary oxide HfO2 and its ferroelectric behavior.1, 2 The unprecedented feasibility of ferroelectric memory using HfO2 is due to its simple structure and compatibility with current complementary metal oxide semiconductor technologies.3 The orthorhombic HfO2
structure can be formed into nanometer-thick films where nonvolatile switchable spontaneous polarization can exist.4 Many studies have reported robust ferroelectricity with a remnant polarization of 10–40 µC/cm2 and a form factor appropriate for high-density memory.2, 5, 6 Newly discovered ferroelectricity in HfO2 is of particular interest for applications such as nonvolatile random access memories and field-effect transistors with negative capacitance.7, 8
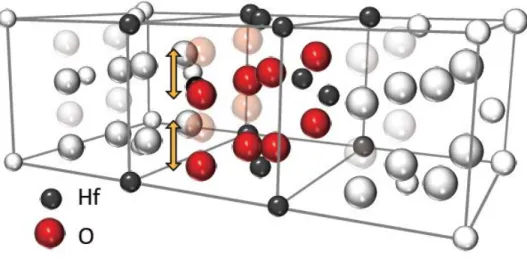
Elucidation of the underlying mechanism governing the overall ferroelectric behavior of HfO2 thin films is crucial for memory applications. The ferroelectric behavior of ultra-thin HfO2 films (less than 10-nm-thick) is attributed to a structural distortion that enables the non-centrosymmetric Pca21 structural phase.9, 10 Oxygen ion movements are believed to be the origin of ferroelectricity in orthorhombic HfO2 films (Figure 1-1). Ferroelectric HfO2 exhibits increased remnant polarization against external field cycling, known as the wake-up effect.
Its origin has been investigated by various methods including simple current–
voltage (I–V) curves, first-principles calculations, transmission electron microscopy (TEM) and phenomenological free-energy modeling for first-order phase transitions.11-13 Concerning the origin of the wake-up effect, the focus has been on structural transitions in terms of non-ferroelectric phases and the
ferroelectric orthorhombic phase.14 Oxygen vacancies and their redistributions have revealed the underlying mechanism of the wake-up effect and structural change.12, 15 Charge injection and oxygen vacancy redistribution within the structural phase has been used to model the wake-up and retention properties.
However, a fundamental understanding of the ferroelectric characteristics is essential for reliable device operation.
Ferroelectric switching dynamics can be used to investigate the underlying mechanism of the wake-up effect according to key features such as oxygen vacancies and dipolar defects on ferroelectric polarization switching. By analyzing the time dependence of polarization switching, we can understand the forms and roles of defects, which are essential to characterize the wake-up effect. In particular, the distribution of characteristic switching time provides a detailed understanding about the defects. For example, Jo et al. reported the presence of dipole defects, and their effect on ferroelectric polycrystalline Pb(ZrxTi1-x)O3 (poly-PZT) films, by analyzing the critical time for ferroelectric switching in terms of the nucleation limited switching (NLS) model with the Lorentzian distribution of the characteristic switching time.16 On the other hand, So et al. reported that the epitaxial PZT film with low defects has a constant characteristic switching time corresponding to the Dirac delta function.17 Furthermore, Kim et al. reported that the epitaxial BFO film has an asymmetric distribution of characteristic switching time due to asymmetric interfacial defects.18 Recently, the characteristic features of NLS such as nucleation rate and critical nucleation number for domain switching in
the HfO2 thin film were also reported by the investigation of ferroelectric domain switching dynamics.19-21
We report herein the polarization switching behaviors of preset and woken-up 4.2% Si-doped poly-HfO2 films. We suggest that the wake-up effect of this Si- doped HfO2 thin film can be attributed to decreased defect density. Ferroelectric switching dynamics, in terms of both ferroelectric domain-wall motion and nucleation, should be considered when studying the role of defects in the switching dynamics of HfO2 films. Experimental ferroelectric polarization switching of polycrystalline Si-doped HfO2 films established that NLS with the Lorentzian distribution of logarithmic characteristic switching time governs domain switching during the initial first two decades of ferroelectric switching. The wake-up effect induced by external bias cycling resulted in retardation of the distribution of the characteristic switching time in the initial first two decades of ferroelectric switching. Monte Carlo simulations, including interactions between ferroelectric dipoles and non-switchable randomly oriented dipole defects, revealed that the retardation of the characteristic switching time is associated with a reduction of defects.
All measurements were conducted using metal–ferroelectric–metal (MFM) planar capacitors with a radius of 50 μm grown on silicon substrates. Stacked
specimens of 4.2% Si-doped HfO2 with top and bottom TiN electrodes were prepared by atomic layer deposition.22 The cation composition and crystallographic phases of the films were examined using X-ray photoemission spectroscopy, grazing-incidence X-ray diffraction (GIXRD; PANalytical X-pert Pro) and TEM.
For electrical characterization, the polarization–voltage hysteresis loop and time- dependent dynamic polarization switching ∆P(t) were measured at room temperature using a ferroelectric tester (TF Analyzer 3000; aixACCT Systems).
Figure 1-1. Schematic diagram of the crystal structure of ferroelectric
orthorhombic HfO2 with displacement of oxygen ions for spontaneous polarization.
Ⅱ . Structure analysis of Si:HfO
2thin films
2.1 Structure analysis using XRD and TEM
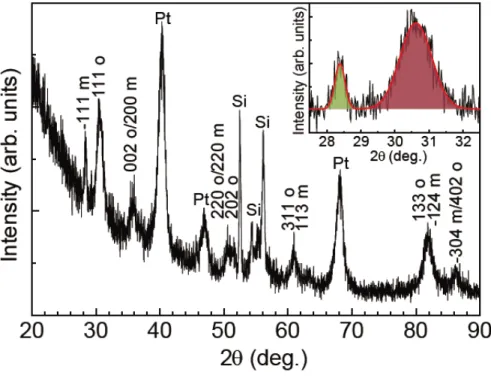
Coexistence of the monoclinic and ferroelectric orthorhombic phases was observed in the Si-doped HfO2 thin film. Figure 2-1 shows the GIXRD spectra of the 4.2% Si-doped HfO2 thin film. This XRD pattern is consistent with mixed monoclinic and orthorhombic phases. The peaks at ~28.4° and ~30.6° are assigned to the monoclinic (1�11 ) and orthorhombic (111) phases, respectively.
Decomposition of the phases was conducted by refining the diffraction pattern using Gaussian peak shapes for each structural phase.23 The green and red peaks in the inset of Figure 2-1 correspond to the monoclinic (1�11) and orthorhombic (111) phases, respectively.
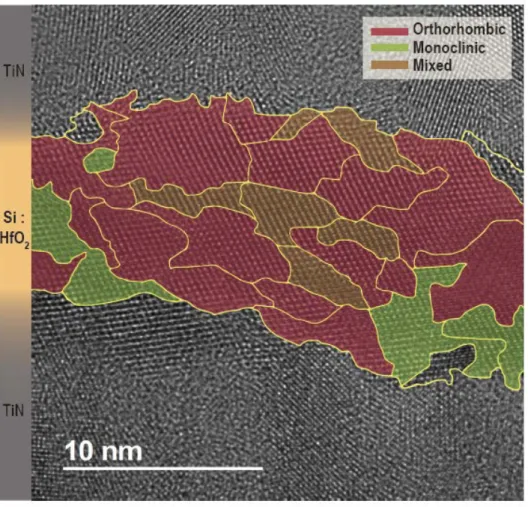
TEM imaging with domain structure analysis also indicated that both orthorhombic and monoclinic phases were present in the 4.2% Si-doped HfO2 film.
TEM cross-sectional images of the film capped with TiN electrodes are presented in Figure 2-2. Domains were defined by geometrical phase analysis (GPA). An average domain size of a few nanometers was observed. Phase analysis was conducted using interplanar spacings and angles obtained for different lattice vectors in reciprocal space. Domains with orthorhombic and monoclinic phases occupied 71.6% and 15.2%, respectively of Si:HfO2 layer in the TEM image. There are domains showing both orthorhombic and monoclinic phases simultaneously, presumably due to the coexistence of multiple domains in the TEM specimen in the out-of-plane direction. A few domains had insufficient crystallographic
information to identify the phase; these are indicated without color. Although the ferroelectricity of HfO2 is due to an intermediate orthorhombic structure having broken inversion symmetry, other structural phases and their variations should be evaluated with respect to their effect on the ferroelectric property of HfO2 films.
Figure 2-1. Grazing-incidence X-ray diffraction (GIXRD) scans for the 8-nm- thick Si:HfO2 film containing 4.2 mol% Si after annealing at 600°C for 20 s. The inset shows the fitting result for the GIXRD peaks over the 27.5–32.5° region using Gaussian functions. The green and red peaks correspond to monoclinic and orthorhombic phases, respectively. Sum of their intensities is indicated by red solid line.
Figure 2-2. Transmission electron microscopy image of the cross-section of the Si-doped HfO2 film. Domain boundaries are indicated by yellow lines.
Orthorhombic and monoclinic phases are colored red and green, respectively.
2.2 Details of the geometric phase analysis (GPA) used for domain mapping
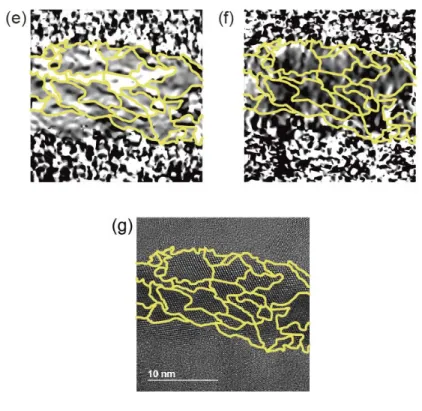
Strain mapping by GPA was used for domain mapping. This technique uses a digital micrograph plug-in developed for calculating displacement and strain from a TEM intensity function. By converting a TEM image into a strain map, it is possible to distinguish domain boundaries objectively because the strains within the domains are nearly zero, but sufficiently high along the boundaries. This is because the displacement calculated by GPA can originate from different stresses, zones and lattice structures. To draw a strain map from a TEM image, GPA transforms the raw intensity values to an exponential form of a Fourier series. A change in phase of the Fourier series intensity represents either a change in the reciprocal lattice vector or the displacement field. The displacement map can be generated from the phase change information. Finally, the strain map is determined by differentiation of the displacement field. The strain map is useful for domain mapping, since examination of the strain map provides information about displacement by either stress or different lattice systems. Application of GPA in domain mapping enables the identification of boundaries between monoclinic and orthorhombic phases in each TEM image.GPA based domain analysis applied to the HRTEM image of 4.2 % Si: HfO2 film is introduced in Figure 2-3.
Figure 2-3. (a) High-resolution transmission electron microscopy (HR-TEM) image of the 4.2% Si:HfO2 film capped with TiN electrodes. (b) Fast Fourier transform image of the selected area (red box) in Figure 2-3. Insets are the phase images of spots 1 and 2. (c) A domain in the εyy strain map of the Si-doped HfO2
film and (d) the corresponding HR-TEM image. (e) εyy and (f) εxx strain maps with total domain assignments and (g) the corresponding HR-TEM images.
Ⅲ . Electric properties of Si:HfO
2thin films
3.1 Ferroelectric hysteresis and wake-up effect in Si:HfO
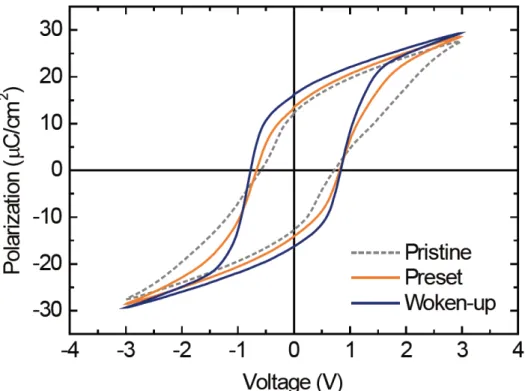
2Repeated polarization switching of the Si-doped HfO2 thin film resulted in the wake-up effect. We prepared pristine, preset and woken-up cells to investigate the effect of repeated electrical stimulation on ferroelectric switching. The pristine cell showed wake-up behavior that was too rapid for measuring stable ferroelectric switching dynamics. Therefore, the preset cell and woken-up cell were prepared by applying 10 and 10000 cycles pulses whose length and voltage are 10 kHz and ±3 V to pristine specimen, respectively. Figure 3-1 shows the ferroelectric polarization hysteresis loops of the pristine, preset and woken-up cells; these are indicated by grey-dashed, orange-solid and blue-solid lines, respectively. Figure 3-1 shows that the wake-up effect was clearly observed with an increase in remnant polarization.
Electric field cycling caused the double-hysteresis-like pinched hysteresis loop of the pristine sample to change into a clear hysteresis loop with increase in both remnant polarization and coercive voltage. Comparing the woken-up cell to the preset cell, the coercive voltages for the Vc+ and Vc- polarities and the remnant polarization were higher by about 2.1, 15.3 and 18.4%, respectively.
Figure 3-1. Polarization–voltage measurement performed on pristine, preset and woken-up cells having the Pt/TiN/Si:HfO2/TiN capacitor structure.
3.2 Double switching current induced by non-uniform dipole deffect
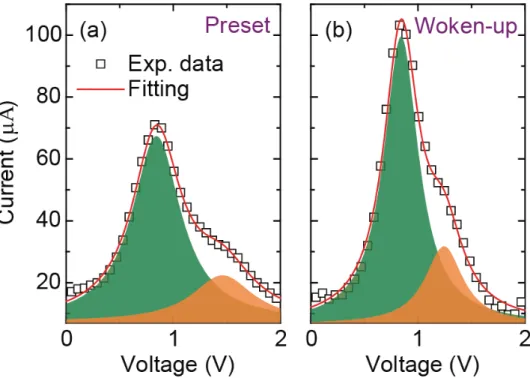
The switching current during the ferroelectric polarization reversal exhibited the characteristic change associated with the wake-up effect. Figure 3-2a and 3-2b show the switching current curves of the preset and woken-up cells measured during polarization switching from downward to upward polarization, respectively.
For the preset case, peaks near 0.84 and 1.46 V are colored green and orange, respectively. For the woken-up cell, the green peak position remained at 0.84 V, while the orange peak shifted to the lower value of 1.24 V. The intensities of the two peaks increased after the wake-up process. Notably, the intensity of the green peak increased by about 10%. The presence of double switching, and its disappearance in oxide thin films, has been explained by non-uniform dipole defects and domain pinning.24 The presence of dipole defects or pinning sites has been considered in ferroelectric doped-HfO2 thin films deposited on a TiN electrode.25 Furthermore, the change in switching current behavior caused by the wake-up effect indicates an adjustment of the defect ratio by the external electric field.
Figure 3-2. Switching current was measured during the polarization switching process from down to up domains, and the current data were fitted by the sum (red solid line) of two Lorentzian distributions (orange and green regions) for the (a) preset and (b) woken-up cells.
3.2 AC frequency dependence of polarization-voltage hysteresis
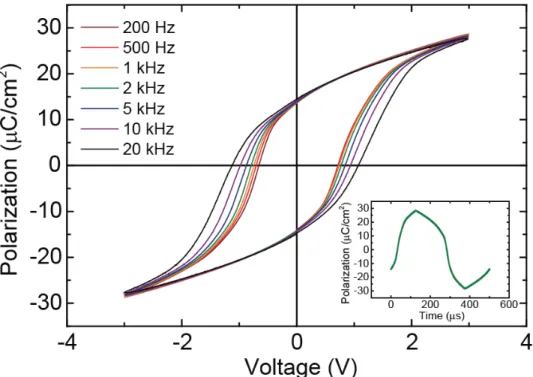
Several studies have reported that ferroelectric switching in doped hafnium thin film is affected by charge injection or trapping.11, 26 To determine whether charge injection or trapping effects are dominant on ferroelectric properties, we investigated the frequency dependence of polarization-voltage hysteresis loop. We obtained polarization-voltage (P-V) hysteresis loop using various frequency of pulse from 200 Hz to 20 kHz (Figure 3-3). The inset of figure 3-3 shows the polarization as a function of time. The direction of the P-V hysteresis curve is counterclockwise. Because artifacts consisting of charge injection induce a clockwise hysteresis curve, we could exclude the possibility of charge injection based on the experimental results.27 In addition, the remnant polarization of P-V hysteresis loops was not significantly affected by frequency variations. This frequency-dependent behavior, especially at high frequencies, eliminates the possibility of charge injection and trapping.28 The results demonstrated that there is little effect by charge injection or trapping on the ferroelectricity of the specimen.
Figure 3-3. Polarization-voltage (P-V) hysteresis loop with various AC frequency from 200 Hz to 20 kHz at room temperature. The inset shows a time-dependent polarization value by 2 kHz pulse.
Ⅳ . Ferroelectric polarization switching dynamics of Si:HfO
2thin films
4.1 Time-dependent ferroelectric polarization switching behavior
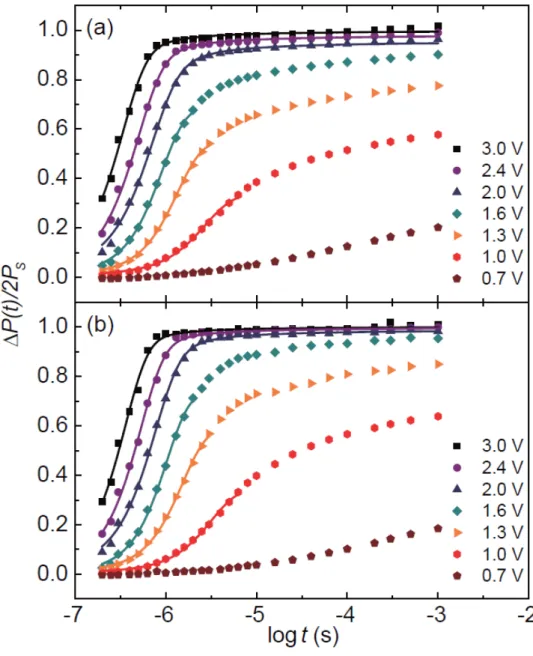
The ferroelectric switching behavior of Si:HfO2 thin films exhibits NLS due to the polycrystallinity of specimens. Figure 4-1a and 4-1b show the ∆P(t)/2Ps value
of the preset and woken-up specimens, respectively, at room temperature as a function of Vext. The ΔP(t)/2Ps curves, at high external bias ranging from 2.0 to 3.0 V, much larger than the coercive field, saturated at about 1.0. On the other hand, the ΔP(t)/2Ps curves at low external bias ranging from 1.0 to 1.6 V did not saturate at the maximum value of 1.0 within the experimental limits. Even though the applied external bias from 1.0 to 1.6 V is comparable to the coercive field observed in figure 3-1, the voltage width/frequency can modulate the coercive field in polarization-voltage hysteresis loop and result in different saturation behavior between slow voltage sweep and fast voltage pulse with high frequency.29 The ΔP(t)/2Ps values were fitted using the NLS model with a Lorentzian distribution of the characteristic switching time according to eqs 1 and 2:16
∆P(t)
2Ps =� �1-exp�-�t
t0�2��F(log t0)d( log t0)
∞
-∞ (1)
where
F(log t0)=A
π� w
(log t0- log t1)2+w2� (2)
where A, w and logt1 are a normalization constant, the half-width at half-maximum of distribution and the mean distribution value, respectively. Note that assigning a distribution other than a delta function to F(logt0) means that the ferroelectric characteristic switching times of the elementary regions (t0)are inhomogeneous.
The solid lines in Figure 4-1a and 4-1b at the point of initial polarization reversal indicate that the polarization switching was governed by NLS with the Lorentzian distribution of the local switching times. Jo et al. and others also used a Lorentzian distribution of the ferroelectric characteristic switching time and attributed broadening of the polarization reversal slope in the early decades to the existence of dipolar defects and their interactions.16, 30
Figure 4-1. Time-dependent switched polarization (∆P(t)) as a function of external
voltage (Vext) at room temperature for the (a) preset and (b) woken-up cells. The solid lines correspond to the fitting results using the nucleation limited switching (NLS) model with a Lorentzian distribution of the characteristic switching time.
4.2 E-field cycling effect on ferroeletric polarization switching behavior
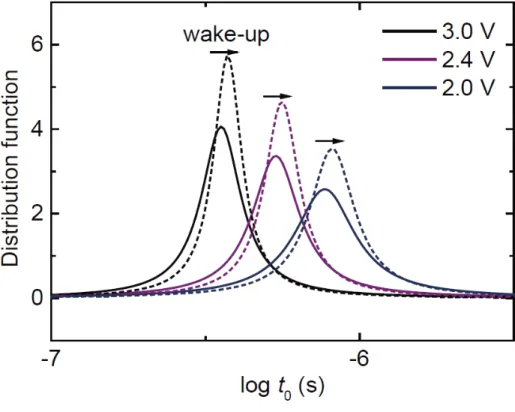
The wake-up effect of the Si-doped HfO2 film was accompanied by a sharpening of the defect density distribution and a delay in the ferroelectric characteristic switching time. Figure 4-2 shows the Lorentzian distribution functions, which are the fitting results of eq 2. The solid lines correspond to the Lorentzian distributions for the preset case, while the dashed lines correspond to the situation after wake-up cycling. Figure 4-2 illustrates the sharpening of the distribution dispersion after the wake-up process. Such sharpening implies that the characteristic switching time of the HfO2 films became more uniform. Note that if the distribution of t0 becomes a delta function due to an identical switching characteristic regardless of the film region, then the switching dynamics follow the Kolmogorov–Avrami–Ishibashi model and correspond to polarization reversal via homogeneous nucleation and domain-wall motion. The peak position t1 for different external electric fields of 3.0, 2.4 and 2.0 V was about 356, 535 and 771 ns, respectively. The wake-up process caused these values to increase by 4.98, 4.65 and 5.70%, respectively.
The retarded t1 value after wake-up is attributed to the annihilation of domain- wall pinning centers. Figure 4-2 illustrates how the t1 value increased after the wake-up process. The mean value of the characteristic switching time t1 can be controlled by the ingredients like defect density; these govern the domain-wall velocity, time needed for nucleation and the average ferroelectric domain size.31, 32 During the wake-up process, the reduction in localized fields produced by charged defects causes the time needed for nucleation and the average domain size enlarged by domain-wall motion to increase.33, 34 Defects with localized fields can induce a
reduction in nucleation bias.35 Also, during sideways domain growth, the ferroelectric dipoles can be pinned to quenched defects whose charge or dipole is opposite to ferroelectric polarization, such that domain-wall propagation can be prevented.36 The decrease in both nucleation and pinning centers induces an increase in the effective domain size. The phase transition from the dielectric monoclinic phase to the ferroelectric orthorhombic phase is another reason for increased effective domain size.12, 14 On the other hand, domain-wall velocity can increase after a wake-up process due to a decrease in the number of domain-wall pinning centers.37 Thus, in the case of the woken-up cell, t1 increased due to the increase in both radius of the effective domain and the waiting time for nucleation, despite the increase in domain-wall velocity.
Figure 4-2. Solid lines and dashed lines correspond to Lorentzian distributions of the fitting functions for the preset and woken-up cells, respectively.
4.3 Details of the experimental method used for measuring the time-dependent switched polarization under various external voltages
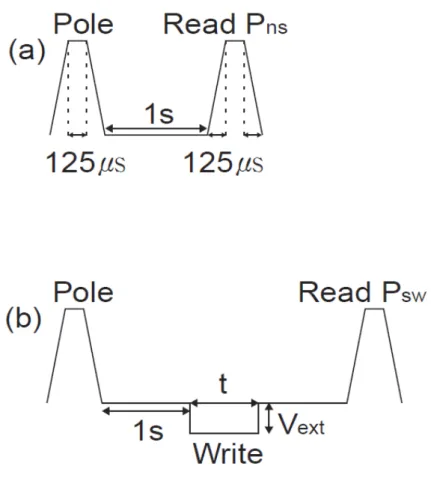
To compare the ferroelectric switching dynamics between the preset and woken- up cells, we measured the ∆P(t) values of our TiN/Si:HfO2/TiN MFM capacitors.
We used a 3-V trapezoidal pulse for the read pulse, whose rise time and duration were 125 μs (Figure 4-3). By subtracting Pns from Psw, we obtained ∆P(t) that did
not include a contribution of leakage current. A poling pulse was identical to the read pulse because the read pulse was sufficient to switch the entire polarization. A rectangular pulse was used as the write pulse, whose voltage and duration were variable. Spontaneous polarization, abbreviated as 2Ps, was measured using a pulse whose shape and magnitude were identical but whose direction was opposite to the read pulse. The duration of the write pulse in our experiments ranged from 200 ns to 1 ms; the shortest duration that the TFA-3000 could generate was about 200 ns.
Since the pristine cell underwent a rapid wake-up effect during field cycling, its characteristics changed during the measurement of switching dynamics. Therefore, we investigated the wake-up effect on polarization switching dynamics using the preset and woken-up cells, but not the pristine cell.
Figure 4-3. Schematic diagram of the pulse trains used to measure the (a) nonswitching polarization (Pns) and the (b) switching polarization (Psw).
Ⅴ . Monte Carlo simulation of ferroelectric properties as a function of defect density.
To elucidate the role of defects on the ferroelectric switching dynamics and the wake-up effect, we investigated the defect ratio dependence of ferroelectricity using Monte Carlo simulations. The Hamiltonian for a long-range dipole–dipole interaction is as follows:38
H=�Pi∙Pj-3(Pi∙n)�Pj∙n�
r3 –Pi∙Eext
j
(3)
where Pi, r and Eext represent the ferroelectric dipole moment at the lattice site i, the distance between dipoles, and the external electric field, respectively. During the simulation, defect sites were assigned to be randomly oriented and fixed against the external electric field, and dipole interactions with other ferroelectric dipoles were included. In the simulation, the defects represent the existence of pinned dipole of domains due to potential defects induced by charged defects such as oxygen vacancies in ferroelectric doped-HfO2 polycrystalline films.11, 12, 20 The magnitude of the potential defect in the Si doped HfO2 thin film has not been reported. We used the arbitrary magnitude of defects for the simulation, and the defect density can be changed by this magnitude. Therefore, the defect density used in the simulation does not represent the exact defect density in the actual film. However, the tendency of the ferroelectricity to change by adjusting the defect ratio is meaningful. We used the value of KBT = 1 in the simulation. The simulations were
performed with two-dimensional squared lattice of size 100 × 100, imposed with periodic boundary conditions.
The ferroelectric polarization reversal by the Monte Carlo simulation demonstrated the characteristic feature of ferroelectric switching behavior of the Si-doped HfO2 film. Figures 5-1, 5-2 and 5-3 show the Monte Carlo simulation results. Ferroelectric hysteresis with decreased defect ratio exhibited increase in both spontaneous polarization and coercive field (Figure 5-1), analogous with the experimental results for the Si-doped HfO2 film. Figure 5-2a shows the Monte Carlo step (MCS) dependence of the ΔP(t)/2Ps values well-fitted eqs 1 and 2. As
the defect ratio decreased, the Lorentzian distributions became sharper and the t1
values increased (Figure 5-2b); this behavior matched the experimental results.
Figures 5-3a and 5-3b show the ferroelectric domain switching in ferroelectric media with 0% and 4% dipole defect density, respectively. In both cases, ferroelectric domains switched through domain-wall motion after nucleation.
However, the waiting time for initial nucleation was longer in the simulation with lower defect density than in the case of higher defect density. Also, the effective domain radius was larger in simulations with lower versus higher defect densities.
The results of Monte Carlo simulations with reduced defects showed the same trend as the experimental results after wake-up.
Figure 5-1. Monte Carlo simulations of ferroelectric polarization hysteresis loop as a function of defect ratio.
Figure 5-2. (a) MCS dependence of ferroelectric polarization switching with external field E = 9.0 (a. u.). (b) Lorentzian distributions of fitting functions for 4%
(solid navy line), 16% (solid purple line) and 36% (solid orange line) defect ratios, respectively.
Figure 5-3. (a) and (b) Snapshots of ferroelectric polarization switching for defect ratios of 0% and 4% with E = 7.0 (a. u.), respectively.
Ⅵ . Conclusion
The initial increase of ferroelectric polarization, i.e., the wake-up effect, is attributed to the annihilation of defects in the Si-doped HfO2 film. The retardation of the Lorentzian peak in Figure 4-2 is associated with the increase in t1, whose value is determined by the domain size, waiting time for nucleation and domain- wall speed.30, 31 Ferroelectric polarization switching can be controlled by nucleation and domain-wall motion via pinning–depinning processes at defect sites.39 The defect density variation affects the elastic propagation of the domain walls and nucleation at defect centers having different pinning potentials.40 The retardation of the Lorentzian peak and increased spontaneous polarization should be interpreted as a reduction of defects and the emergence of ferroelectric dipoles. This defect suppression could also induce the shift of the satellite switching current in the I–V curves shown in Figure 3-2. Investigations using TEM reported that the structural change from the monoclinic phase to the orthorhombic phase of HfO2 thin films can involve intermediate structural phases.41 Such a structural change can coincide with a redistribution of oxygen vacancies.12 During wake-up, various defects, such as monoclinic HfO2 or dipoles having oxygen vacancies, should be considered in terms of interactions with ferroelectric dipoles. Their annihilation during device cycling is essential for increasing spontaneous polarization and retarding the mean characteristic switching time t1.
Summarizing, we investigated the polarization switching behaviors of both preset and woken-up polycrystalline 4.2% Si-doped HfO2 thin films. Over the entire switching bias, the switching kinetics of both the preset and woken-up cells can be
explained by the NLS model with a Lorentzian distribution of the characteristic switching time. Comparing switching kinetics between the preset and woken-up cells, the characteristic switching time increased due to increase in both effective domain radius and nucleation waiting time after wake-up. The results of Monte Carlo simulations with reduced defects showed the same trend as the experimental results after wake-up. Our results provide insight into the mechanism of
polarization switching and wake-up phenomena in HfO2-based ferroelectric thin films.
References
(1) Böscke, T. S.; Müller, J.; Bräuhaus, D.; Schröder, U.; Böttger, U.
Ferroelectricity in hafnium oxide thin films. Appl. Phys. Lett. 2011, 99 (10), 102903.
(2) Park, M. H.; Lee, Y. H.; Kim, H. J.; Kim, Y. J.; Moon, T.; Kim, K. D.;
Müller, J.; Kersch, A.; Schroeder, U.; Mikolajick, T.; Hwang, C. S. Ferroelectricity and Antiferroelectricity of Doped Thin HfO2-Based Films. Adv. Mater. 2015, 27 (11), 1811-1831.
(3) Böscke, T. S.; Müller, J.; Bräuhaus, D.; Schröder, U.; Böttger, U.
Ferroelectricity in hafnium oxide: CMOS compatible ferroelectric field effect transistors. IEEE Int. Electron Devices Meet. 2011, DOI:
10.1109/IEDM.2011.6131606.
(4) Yurchuk, E.; Müller, J.; Knebel, S.; Sundqvist, J.; Graham, A. P.; Melde, T.;
Schröder, U.; Mikolajick, T. Impact of layer thickness on the ferroelectric behaviour of silicon doped hafnium oxide thin films. Thin Solid Films 2013, 533 (Supplement C), 88-92.
(5) Lee, K.; Lee, T. Y.; Yang, S. M.; Lee, D. H.; Park, J.; Chae, S. C.
Ferroelectricity in epitaxial Y-doped HfO2 thin film integrated on Si substrate. Appl.
Phys. Lett. 2018, 112 (20), 202901.
(6) Müller, J.; Polakowski, P.; Mueller, S.; Mikolajick, T. Ferroelectric Hafnium Oxide Based Materials and Devices: Assessment of Current Status and Future Prospects. ECS J. Solid State Sci. Technol. 2015, 4 (5), N30-N35.
(7) Khan, A. I.; Chatterjee, K.; Wang, B.; Drapcho, S.; You, L.; Serrao, C.;
Bakaul, S. R.; Ramesh, R.; Salahuddin, S. Negative capacitance in a ferroelectric capacitor. Nat. Mater. 2014, 14, 182
(8) Michael, H.; Milan, P.; Korok, C.; I., K. A.; Sayeef, S.; Stefan, S.; Uwe, S.;
Thomas, M. Direct Observation of Negative Capacitance in Polycrystalline Ferroelectric HfO2. Adv. Funct. Mater. 2016, 26 (47), 8643-8649.
(9) Huan, T. D.; Sharma, V.; Rossetti, G. A.; Ramprasad, R. Pathways towards ferroelectricity in hafnia. Phys. Rev. B 2014, 90 (6), 064111.
(10) Sang, X.; Grimley, E. D.; Schenk, T.; Schroeder, U.; LeBeau, J. M. On the structural origins of ferroelectricity in HfO2 thin films. Appl. Phys. Lett. 2015, 106 (16), 162905.
(11) Schenk, T.; Hoffmann, M.; Ocker, J.; Pešić, M.; Mikolajick, T.; Schroeder,
U. Complex Internal Bias Fields in Ferroelectric Hafnium Oxide. ACS Appl. Mater.
Interfaces 2015, 7 (36), 20224-20233.
(12) Pešić, M.; Fengler, F. P. G.; Larcher, L.; Padovani, A.; Schenk, T.; Grimley,
E. D.; Sang, X.; LeBeau, J. M.; Slesazeck, S.; Schroeder, U.; Mikolajick, T.
Physical Mechanisms behind the Field-Cycling Behavior of HfO2-Based Ferroelectric Capacitors. Adv. Funct. Mater. 2016, 26 (25), 4601-4612.
(13) Park, M. H.; Kim, H. J.; Lee, Y. H.; Kim, Y. J.; Moon, T.; Kim, K. D.;
Hyun, S. D.; Hwang, C. S. Two-step polarization switching mediated by a nonpolar intermediate phase in Hf0.4Zr0.6O2 thin films. Nanoscale 2016, 8 (29), 13898-13907.
(14) Grimley, E. D.; Schenk, T.; Sang, X.; Pešić, M.; Schroeder, U.; Mikolajick,
T.; LeBeau, J. M. Structural Changes Underlying Field-Cycling Phenomena in Ferroelectric HfO2 Thin Films. Adv. Electron. Mater. 2016, 2 (9), 1600173.
(15) Starschich, S.; Menzel, S.; Böttger, U. Evidence for oxygen vacancies movement during wake-up in ferroelectric hafnium oxide. Appl. Phys. Lett. 2016, 108 (3), 032903.
(16) Jo, J. Y.; Han, H. S.; Yoon, J. G.; Song, T. K.; Kim, S. H.; Noh, T. W.
Domain Switching Kinetics in Disordered Ferroelectric Thin Films. Phys. Rev. Lett.
2007, 99 (26), 267602.
(17) So, Y. W.; Kim, D. J.; Noh, T. W.; Yoon, J. G.; Song, T. K. Polarization switching kinetics of epitaxial Pb(Zr0.4Ti0.6)O3 thin films. Appl. Phys. Lett. 2005, 86 (9), 092905.
(18) Kim, T. H.; Baek, S. H.; Yang, S. M.; Kim, Y. S.; Jeon, B. C.; Lee, D.;
Chung, J. S.; Eom, C. B.; Yoon, J. G.; Noh, T. W. Polarity-dependent kinetics of ferroelectric switching in epitaxial BiFeO3(111) capacitors. Appl. Phys. Lett. 2011, 99 (1), 012905.
(19) Mulaosmanobic, H.; Ocker, J., Müller, S.; Schroeder, U.; Müller, J.;
Polakowski, P.; Flachowsky, S.; van Bentum, R.; Mikolajick, T.; Slesazeck, S.
Switching Kinetics in Nanoscale Hafnium Oxide Based Ferroelectric Field-Effect Transistors. ACS Appl. Mater. Interfaces 2017, 9 (4), 3792-3798.
(20) Buragohain, P.; Richter, C.; Schenk, T.; Lu, H. Mikolajick, T.; Schroeder, U.; Gruverman, A. Nanoscopic studies of domain structure dynamics in ferroelectric La:HfO2 capacitors. Appl. Phys. Lett. 2018, 112 (22), 222901.
(21) Gong, N.; Sun, X.; Jiang, H.; Chang-Liao, K. S.; Xia, Q.; Ma, T. P.
Nucleation limited switching (NLS) model for HfO2-based metal-ferroelectric- metal (MFM) capacitors: Switching kinetics and retention characteristics. Appl.
Phys. Lett. 2018, 112 (26), 262903.
(22) Yoo, H. K.; Kim, J. S.; Zhu, Z.; Choi, Y. S.; Yoon, A.; MacDonald, M. R.;
Lei, X.; Lee, T. Y.; Lee, D.; Chae, S. C.; Park, J.; Hemker, D.; Langan, J. G.; Nishi, Y.; Hong, S. J. Engineering of ferroelectric switching speed in Si doped HfO2 for high-speed 1T-FERAM application. IEEE Int. Electron Devices Meet. 2017, DOI:
10.1109/IEDM.2017.8268424.
(23) Park, M. H.; Kim, H. J.; Kim, Y. J.; Lee, W.; Moon, T.; Hwang, C. S.
Evolution of phases and ferroelectric properties of thin Hf0.5Zr0.5O2 films according to the thickness and annealing temperature. Appl. Phys. Lett. 2013, 102 (24), 242905.
(24) Lee, D.; Yoon, A.; Jang, S. Y.; Yoon, J. G.; Chung, J. S.; Kim, M.; Scott, J.
F.; Noh, T. W. Giant Flexoelectric Effect in Ferroelectric Epitaxial Thin Films.
Phys. Rev. Lett. 2011, 107 (5), 057602.
(25) Zhou, D.; Xu, J.; Li, Q.; Guan, Y.; Cao, F.; Dong, X.; Müller, J.; Schenk, T.;
Schröder, U. Wake-up effects in Si-doped hafnium oxide ferroelectric thin films.
Appl. Phys. Lett. 2013, 103 (19), 192904.
(26) Pešić, M.; Slesazeck, S.; Schenk, T.; Schroeder, U.; Mikolajick, T. Impact
of charge trapping on the ferroelectric switching behavior of doped HfO2. Phys.
Status Solidi 2016, 213(2), 270-273.
(27) Scott, J. F. Ferroelectric Memories; Springer-Verlag: Berlin, 2000.
(28) Agarwal, R.; Sharma, Y.; Chang, S.; Pitike, K.C.; Sohn, C.; Nakhmanson, S.M.; Takoudis, C.G.; Lee, H.N.; Tonelli, R.; Gardner, J.; Scott, J.F.; Katiyar, R. S.;
Hong, S. Room-temperature relaxor ferroelectricity and photovoltaic effects in tin titanate directly deposited on a silicon substrate. Phys. Rev. B 2015, 97 (5), 054109.
(29) Scott, J. F.; Kammerdiner, L.; Parris, M.; Traynor, S.; Ottenbacher, V.;
Shawabkeh, A.; Oliver, W. F. Switching kinetics of lead zirconate titanate submicron thin‐film memories. J. Appl. Phys. 1988, 64 (2), 787-792.
(30) Van Vleck, J. H. The Dipolar Broadening of Magnetic Resonance Lines in Crystals. Phys. Rev. 1948, 74 (9), 1168-1183.
(31) Ishibashi, Y.; Takagi, Y. Note on ferroelectric domain switching. J. Phys.
Soc. Jpn. 1971, 31 (2), 506-510.
(32) Avrami, M. Granulation, Phase Change, and Microstructure Kinetics of Phase Change. Ⅲ. J. Chem. Phys. 1941, 9 (2), 177-184.
(33) Pramanick, A.; Prewitt, A. D.; Forrester, J. S.; Jones, J. L. Domains, Domain Walls and Defects in Perovskite Ferroelctric Oxides: A Review of Present Understanding and Recent Contributions. Crit. Rev. Solid State Mater. Sci. 2012, 37 (4), 243-275.
(34) Morozovska, A. N.; Svechnikov, S. V.; Eliseev, E. A.; Rodriguez, B. J.;
Jesse, S.; Kalinin, S. V. Local polarization switching in the presence of surface- charged defects: Microscopic mechanisms and piezorepsonse force spectroscopy observations. Phys. Rev. B 2008, 78 (5), 054101.
(35) Gao, P.; Nelson, C. T.; Jokisaari, J. R.; Baek, S.-H.; Bark, C. W.; Zhang, Y.;
Wang, E.; Schlom, D. G.; Eom, C.-B.; Pan, X. Revealing the role of defects in ferroelectric switching with atomic resolution. Nat. Commun. 2011, 2, 591.
(36) Yang, S. M.; Yoon, J.-G.; Noh, T. W. Nanoscale studies of defect-mediated polarization switching dynamics in ferroelectric thin film capacitors. Curr. Appl.
Phys. 2011, 11 (5), 1111-1125.
(37) Nelson, C. T.; Gao, P.; Jokisaari, J. R.; Heikes, C.; Adamo, C.; Melville, A.;
Baek, S.-H.; Folkman, C. M.; Winchester, B.; Gu, Y.; Liu, Y.; Zhang, K.; Wang, E.;
Li, J.; Chen, L.-Q.; Eom, C.-B.; Schlom, D. G.; Pan, X. Domain Dynamics During Ferroelectric Switching. Science 2011, 334 (6058), 968-971.
(38) Wu, Y.-Z.; Yao, D.-L.; Li, Z.-Y. Monte-Carlo simulation of the switching behavior in ferroelectrics with dipolar defects. Solid State Commun. 2002, 122 (7), 395-400.
(39) Jo, J. Y.; Yang, S. M.; Kim, T. H.; Lee, H. N.; Yoon, J. G.; Park, S.; Jo, Y.;
Jung, M. H.; Noh, T. W. Nonlinear Dynamics of Domain-Wall Propagation in Epitaxial Ferroelectric Thin Films. Phys. Rev. Lett. 2009, 102 (4), 045701.
(40) Jesse, S.; Rodriguez, B. J.; Choudhury, S.; Baddorf, A. P.; Vrejoiu, I.; Hesse, D.; Alexe, M.; Eliseev, E. A.; Morozovska, A. N.; Zhang, J.; Chen, L.-Q.; Kalinin, S. V. Direct imaging of the spatial and energy distribution of nucleation centres inferroelectric materials. Nat. Mater. 2008, 7, 209.
(41) Grimley, E. D.; Schenk, T.; Mikolajick, T.; Schroeder, U.; LeBeau, J. M.
Atomic Structure of Domain and Interphase Boundaries in Ferroelectric HfO2. Adv.
Mater. Interfaces 2018, 5 (5), 1701258.
Appendix
<A. 1> Experimental method for time-dependent switched polarization
The polarization change due to the full-switching (FS) pulse and the polarization change due to the non-switching (NS) current should be obtained using TFA-3000.
These measurements can be made using the pulse measurement menu in TFA-3000.
For a reading pulse that measures the polarization change, a sufficient voltage and length are required to reverse almost all polarization in the film. In this paper, a trapezoidal pulse with a rise and fall time of 125 microseconds and a duration time of 125 microseconds is used. When the amount of polarization change is measured using a leading pulse after polling using a pulse different from the leading pulse only in the direction, it is possible to know the amount of change when all the polarization is inverted. This value is called FS polarization. Of course, this variation includes the effect of leakage current. Therefore, it is necessary to measure the amount of polarization change with the leading pulse again in the state that the polling is not performed in the opposite direction, that is, in the state where the polling is performed with the leading pulse. This value is called NS polarization.
By subtracting NS from FS, we can obtain a polarization change by pure polarization inversion. This value is called spontaneous or switchable polarization (2PS).
To investigate the polarization switching dynamics, we experimented with changing the size and length of the polling pulse. To reduce the effects of phenomena such as fatigue or wakeup, it is better to start with a small voltage and
experiment with short pulses. In this study, we have proposed a method that uses a 200ns, 250ns, 300ns, 400ns, 500ns, 630ns, 800ns, 1us, 1.3us, 1.6us, 2us, 2.5us, 3us, 4us, 5us, 6.3us, 8us, 10us, 16us, 25us, 40us, 63us, 100us, 200us, 300us, 500us and 1ms pulses. These pulses used for polling were square waves. The shortest pulse is 200ns because the shortest pulse that the TFA-3000 can make is 140ns and is believed to be reliable from 200ns pulse. The reason why the longest pulse is 1 ms is because a pulse having a length of 1 ms is a sufficient length to flip the ferroelectric polarization. Since the x-axis of the graph of time dependent switched polarization is usually the time of the logarithmic scale, it is recommended to change the length of the pulse to the logarithmic scale. Variations in polarization can be obtained by using the leading pulse on cells polled by pulses of various bolts and lengths. By subtracting the amount of change in polarization due to NS from the amount of change in polarization, only a response due to polarization change can be obtained. This value is specified as ∆P(t). We can see how a fraction of the polarization is switched by comparing ∆P(t) to 2PS.
Enter the information (thickness, capacitor size) of the measurement sample and verify the ferroelectricity of the cell using the appropriate length and pulse of volt.
You can use DHM mode at this time.
When ready to measure Time-dependent switched polarization, first polling is performed in PM mode using a pulse that is opposite in direction to the reading pulse, and the full switching (FS) current is measured using a reading pulse. At this time, the reading pulse should be of sufficient voltage and sufficient length to flip almost all the polarization of the film. A rise / fall time of 125us and a duration time of 125us is sufficient.
The measurement result can be confirmed by a polarization versus time graph.
For all measurements, only the maximum value of the graph of the change in polarization over time is used.
If the measurement is done without poling immediately after the FS measurement is completed, a response by the non-switching (NS) current can be obtained. By subtracting the change in polarization due to NS from the polarization change due to FS, the polarization switching amount except the influence due to leakage can be obtained. FS-NS =2PS
After all polarization is poled by up pulse, by using down pulse of arbitrary voltage and length as a poling pulse, it is possible to measure how much the polarization is inverted by the voltage and the length. In this case, the poling pulse is a square wave whose rise time is 0 s. The ∆P(t) value can be obtained by subtracting the influence of NS from the amount of polarization change obtained from this measurement.
<A. 2> Deposition condition of HfO
2film using ALD system.
We deposited thin HfO2 films using NCD's D100 equipment. The process conditions using the TEMAHf source provided by the company were assist 0.3s, pulse time 0.5s, purge time 10s, and ozone pulse 3s. However, this condition is not optimized for making ferroelectric hafnium thin films. When deposition is performed using this condition, the growth rate is about 0.06 to 0.08 nm per 1 cycle.
The growth rate affects the ferroelectricity of the hafnium thin film. Previously reported hafnium films showed good ferroelectricity when the growth rate was about 0.1 nm per cycle. We could achieve growth rate of 0.1nm per cycle by modifying Hf pulse time, purge time and ozone pulse to 1s, 20s, and 48s, respectively.
국문초록
산화물 하프늄 박막의 강유전성은 강유전성 랜덤 억세스 메모리에 대 한 실용적인 대안을 제공한다. 상업적 응용에 앞서 신뢰성있는 스위칭 동작이 요구되지만 많은 흥미로운 기능들은 아직 명확하게 이해되지 않 았다. 본 연구에서는 실리콘이 도핑된 산화물 하프늄 박막을 이용하여 wake-up 효과로 알려진 외부 전기장 사이클링에 의한 잔류 분극의 증 가를 강유전성 분극 스위칭 동역학 변화의 관점에서 보고한다. wake- up 과정을 겪지 않은 실리콘이 도핑 된 산화물 하프늄 박막은 한정된 수의 분극 스위칭 거동 후에 잔류 분극 값의 증가를 나타낸다. 분극 스 위칭 거동은 nucleation limited switching 모델을 사용하여 분석되었다.
분극 스위칭 거동의 분석과정에서 박막내에 무작위로 존재하는 전하를 띈 결함이 고려되었다. 몬테카를로 시뮬레이션을 통해 분극 스위칭에서 결함이 미치는 영향에 대해 조사하였다. 시뮬레이션 결과와 실험 결과를 비교하면 산화물 하프늄 박막의 wake-up 효과는 화학적 무질서의 감 소 때문인 것으로 생각된다.
주요어: 강유전성, 산화물 하프늄, FeRAM, 결함, 박막, 구역 스위칭
학번: 2016-27278
감사의 글
어느덧 석사과정 학생으로서 공부한지 2년이 다 되어갑니다. 서울대학 교 물리교육과에 입학한 뒤 6년 넘는 기간 동안 많은 시간을 13동에서 보내왔기에, 이곳을 떠나야 할 시기가 다가왔다는 것이 실감나지 않습니 다. 돌이켜보면 지난 2년은 매우 값진 시간이었고, 저희 연구실과 제가 변화하기에도 짧지만은 않은 시간이었습니다.
많은 가르침을 주신 채승철 교수님께 가장 먼저 감사의 마음을 전하고 싶습니다. 항상 가까이에서 저희를 지켜봐 주셨고 디테일한 부분까지도 세심하게 지도해주셨습니다. 연구 경험이 부족했던 저는 실험과 과제 수 행 과정에서 여러 번 난관에 부딪혔습니다. 그때마다 교수님께서 지도해 주시고 격려해주셨기에 어려움을 극복할 수 있었습니다. 지난 2년 동안 교수님께 많은 것을 배웠습니다. 연구 분야에 대한 지식에서부터 연구자 로서의 소양과 살아가면서 필요한 지혜까지 얻을 수 있었습니다. 교수님 의 소중한 가르침들을 잊지 않겠습니다. 다시 한번 진심으로 감사드립니 다.
실험에 많은 도움을 주신 전동렬 교수님께 감사드립니다. 교수님께서 여러 장비를 대여해주시고 장비 사용에 대한 노하우를 전해주셨기에 다 양한 실험을 할 수 있었습니다. 또한 바쁘신 일정에도 졸업논문 심사위 원장을 맡아주셔서 감사합니다. 제 논문 심사를 위해 시간을 내어주신 유준희 교수님께 감사드립니다. 교수님의 강의들이 제 대학원 생활에 많 은 도움이 되었습니다. 이경호 교수님께 감사드립니다. 복도에서 뵐 때 마다 교수님께서 저를 걱정해주시고 위해주셨던 순간들은 잊을 수 없습 니다. 여러 학생들의 롤모델이신 송진웅 교수님께도 감사드립니다. 교수
님께 연구자로서 갖춰야 할 자세를 배울 수 있었습니다.
연구실에서 함께 생활하며 많은 도움을 주신 선배님, 후배님들께 감사 의 마음을 보냅니다. 초기 멤버로서 연구실 발전에 많은 기여를 한 경준 이형에게 고맙다는 말 전하고 싶습니다. 실험실을 꾸리느라 함께 고생 했던 기억은 잊을 수 없는 추억이 되었습니다. 제가 어려움을 겪을 때마 다 자기 일처럼 도와주는 모습은 닮고 싶은 선배의 모습이었습니다. 최 근 전문연구요원에 합격한 것을 진심으로 축하합니다. 앞으로 더욱 성장 하여 훌륭한 연구자가 되길 응원하겠습니다. 함께 여러 과제와 연구를 수행한 종찬이형에게도 고맙습니다. 형이 책임감을 갖고 맡은 실험들을 잘 수행해주었기 때문에 많은 도움이 되고 의지가 되었습니다. 과제 수 행 과정에서 많은 어려움이 있었는데 형과 함께 했기에 무사히 극복할 수 있었습니다. 앞으로도 좋은 연구결과가 있기를 응원하겠습니다. 이준 행 선생님께도 감사합니다. 연구뿐 아니라 모든 수업에 최선을 다하시는 선생님께 본받을 점이 많았습니다. 또한 코딩과 관련된 문제가 생기면 언제나 선생님께 조언을 구했습니다. 매번 친절히 답해주셔서 감사합니 다. 그리고 연구실의 막내 홍헌이에게도 고마운 마음을 전합니다. 일 처 리를 꼼꼼하게 하여 연구실 운영에 큰 도움이 되고 있습니다. 여러 주제 에 대해 관심을 가지고 연구를 하느라 아직은 주제가 구체화되지 않았지 만, 지금처럼 성실히 연구해 나간다면 반드시 훌륭한 연구자가 될 것이 라 믿어 의심치 않습니다.
마지막으로 가족들에게 감사의 말을 남기고 싶습니다. 저를 항상 응원 해주신 아버지, 감사합니다. 아버지의 믿음과 지원이 있었기에 여기까지 올 수 있었습니다. 저를 든든하게 지켜주시는 어머니, 감사합니다. 자상 하신 어머니의 가르침 덕택에 긍정적인 삶의 자세를 배울 수 있었습니다.
어릴 적부터 관심과 사랑으로 보살펴주신 큰외삼촌께도 감사드립니다.
학부생 시절부터 진로에 대해 조언과 격려를 아낌없이 보내주셨고 학교 생활의 큰 도움이 되었습니다.
제가 앞서 감사를 표하지 못하였더라도 용서해 주시길 부탁드립니다.
제가 공부하는 동안 도움을 주신 모든 분들께 감사드립니다.