저작자표시-비영리-변경금지 2.0 대한민국 이용자는 아래의 조건을 따르는 경우에 한하여 자유롭게
l 이 저작물을 복제, 배포, 전송, 전시, 공연 및 방송할 수 있습니다. 다음과 같은 조건을 따라야 합니다:
l 귀하는, 이 저작물의 재이용이나 배포의 경우, 이 저작물에 적용된 이용허락조건 을 명확하게 나타내어야 합니다.
l 저작권자로부터 별도의 허가를 받으면 이러한 조건들은 적용되지 않습니다.
저작권법에 따른 이용자의 권리는 위의 내용에 의하여 영향을 받지 않습니다. 이것은 이용허락규약(Legal Code)을 이해하기 쉽게 요약한 것입니다.
Disclaimer
저작자표시. 귀하는 원저작자를 표시하여야 합니다.
비영리. 귀하는 이 저작물을 영리 목적으로 이용할 수 없습니다.
변경금지. 귀하는 이 저작물을 개작, 변형 또는 가공할 수 없습니다.
공학석사학위논문
Study of Acid Leaching of Rare Earth Elements Ore from Mushgai Khudag Area, Mongolia 몽골 무시가이쿠닥 희토류 광석의
산 침출 특성에 대한 연구
2014 년 2 월
서울대학교 공과대학원
에너지시스템공학부
김 리 나
Study of Acid Leaching of Rare Earth Elements Ore from Mushgai Khudag Area, Mongolia
지도교수 조 희 찬
이 논문을 공학석사학위논문으로 제출함
2013 년 12 월
서울대학교 대학원
에너지시스템공학부
김 리 나
김리나의 석사학위논문을 인준함
2014 년 1 월
Abstract
In 2010, reduction of Rare Earth Elements (REE) exports quota of China, and the dispute between China and Japan caused a dramatic increase in REE prices. Therefore, it is important to obtain a stable supply of REE globally, as problems with increasing REE prices in Korea are serious.
When REE prices were low, the REE product processing technology had not yet been developed in Korea. Instead, Korea imported finished or half-finished REE products from other countries. Although REE prices are currently relatively stable, they can soar again. Thus, Korea needs to prepare countermeasures for resources security, and a R&D project was set up to explore REE deposits. As part of the R&D project, this study looks at the acid leaching of REE ore. The REE ore sample was collected from the High Grade Zone (HGZ), which is in the Mushgai Khudag area of Mongolia. The total REE content was relatively high at approximately 10 %, so if adequate processing technologies are available, a mass supply of REE to Korea can be possible
For optimum leaching conditions, experiments were performed at various settings where sulfuric, hydrochloric, and nitric acid were used as leaching reagents. The leaching experiments were performed utilizing 3 reagents to determine the basic leaching characteristics of leaching reaction and optimum leaching time. Additionally, the optimum leaching reagent and its concentration were identified through leaching
experiments that changed the leaching reagent concentrations.
After the leaching time, reagent, and concentration were determined, the leaching experiments were conducted to improve the REE leaching levels. Generally, chemical reaction rates can be sped up at higher temperatures. Thus, experiments were conducted at low leaching reagent concentrations at elevated temperatures. Fe was removed in the leachate by using magnetic separated samples. If there is a large amount of Fe in the leachate, the process cost can increase. In addition, the particle size change in the leaching experiment was studied. At an optimum particle size, target materials can be extracted efficiently due to the enhanced liberation degree. At an adequate solid to liquid ratio, optimum leaching levels are obtained so that an economical amount of leaching reagent can be determined.
As a result, when 2.0 M of hydrochloric acid or nitric acid was used, more than 90 % REE leached out in an hour.
However, when sulfuric acid was used, 70 ~ 80 % REE leached out even at high acidic concentrations of 13.0 M due to sulfate formation. The optimum leaching conditions were identified using 2.0 M hydrochloric acid with a leaching time of 1 ~ 2 hours. The optimum temperature was 25 ℃ as it was determined there is no benefit in operating at a higher temperature. The optimum particle size was 90 % passing 50 mesh, since there was no big difference in the REE leaching levels at a finer particle size. The optimum pulp density to leach REE was 10 ~ 15 %, because at 25 %, most of the
REE disappeared and leaching levels of some impurities were high. Thus, the impurities can be removed by solid-liquid separation.
Keywords: REE, acid leaching, apatite, magnetic separation Student Number: 2011-21090
Table of contents
1. Introduction ··· 1
1.1. Research background ··· 1
1.2. Recent studies ··· 7
1.3. Research purpose ··· 10
2. Background theory ··· 13
2.1. Chemical properties of REE ··· 13
2.2. Analysis of thermodynamic data ··· 16
2.3. Leaching methods of REE ores ··· 20
2.3.1. Monazite ··· 20
2.3.2. Bastnasite ··· 22
2.3.3. Apatite ··· 24
3. Materials and methods ··· 29
3.1. Sample characteristic ··· 29
3.2. Experimental methods ··· 35
3.2.1. Leaching experiment ··· 35
3.2.2. Magnetic separation ··· 36
3.2.3. Nitro-hydrochloric acid digestion - the sample concentration measurement ··· 37
4. Results and discussion ··· 38
4.1. Leaching kinetics ··· 38
4.2. Effect of acid concentration and type on leaching levels ··· 43
4.3. Effect of temperature on leaching levels ··· 49
4.4. Effect of magnetic separation ··· 53
4.5. Effect of particle size ··· 58
4.6. Effect of pulp density ··· 61
4.7. Process proposal ··· 66
5. Conclusion ··· 68
References ··· 72
초 록 ··· 75
List of tables
Table 1. Analysis of thermodynamic data about REE
phosphates 18
Table 2. Analysis of thermodynamic data about REE
carbonates 18
Table 3. Analysis of thermodynamic data about
fluorapatite 19
Table 4. Analysis of thermodynamic data about
hydroxyapatite 19
Table 5. Analysis of thermodynamic data about Ca
phosphate 19
Table 6. Chemical contents of HGZ sample 31 Table 7. Size analysis of HGZ sample (d90: 50 mesh)
32 Table 8. Size analysis of HGZ sample (d90: 100 mesh)
33 Table 9. Size analysis of HGZ sample (d85: 200 mesh)
34 Table 10. Experiment conditions of leaching kinetics (1)
39 Table 11. Experiment conditions of leaching kinetics (2)
40 Table 12. Experiment conditions of leaching kinetics (3)
42
Table 13. Experiment conditions of effect of acid
concentration (1) 44
Table 14. Experiment conditions of effect of acid
concentration (2) 46
Table 15. Experiment conditions of effect of acid
concentration (3) 47
Table 16. Experiment conditions of effect of temperature
(1) 49
Table 17. Experiment conditions of effect of temperature
(2) 51
Table 18. Fe and REE contents of raw sample and
magnetic separated samples 55
Table 19. Experiment conditions of leaching of magnetic
separated sample 56
Table 20. Experiment conditions of effect of particle size 59 Table 21. Experiment conditions of effect of pulp density 61
List of Figures
Figure 1. Worldwide distribution of REE deposits,
reserves and operating mines (Okuya, 2011) 3 Figure 2. Price of REE in recent 10 years (KORES, 2013) 4 Figure 3. Generalized phases of REE processing
for magnet alloy production (Retrieved from homepage of Great Western Minerals Group) 6
Figure 4. Periodic table 14
Figure 5. Many kinds of REE metals 15
Figure 6. Decomposition and leaching process of
monazite (Park et al., 2012) 21
Figure 7. Sulfuric acid leaching process of bastnasite
(Park et al., 2012) 23
Figure 8. Recovery of pure REE oxides from wet
process phosphoric acid by crystallization
(Habashi, 1985) 25
Figure 9. Recovery of REE from Kola phosphate by crystallization (A) or precipitation (B)
(Habashi, 1985) 27
Figure 10. Recovery of REE from phosphate rock by HCl leaching process (Habashi, 1985) 28 Figure 11. Location of Mushgai Khudag, in Mongolia
(KORES, 2011) 30
Figure 12. Sampling in HGZ 31
Figure 13. Apatite sample 31 Figure 14. Cumulative size distribution of HGZ sample
(d90: 50 mesh) 32
Figure 15. Cumulative size distribution of HGZ sample
(d90: 100 mesh) 33
Figure 16. Cumulative size distribution of HGZ sample
(d85: 200 mesh) 34
Figure 17. Change of leaching levels with time (leaching reagent: 13.0 M sulfuric acid) 39 Figure 18. Change of leaching levels with time (leaching
reagent: 2.0 M hydrochloric acid) 41 Figure 19. Change of leaching levels with time (leaching
reagent: 2.0 M nitric acid) 42
Figure 20. Change of leaching levels at various sulfuric
acid concentrations 44
Figure 21. Result of XRD analysis about residue from leaching with 13.0 M of sulfuric acid 45 Figure 22. Change of leaching levels at various
hydrochloric acid concentrations 46 Figure 23. Change of leaching levels at various nitric
acid concentrations 48
Figure 24. Comparison of leaching using 13.0 M sulfuric
acid at 25 ℃ and 80 ℃ 50
Figure 25. Comparison of leaching using 1.0 M
hydrochloric acid at 25 ℃, 50 ℃, and 80 ℃ 52 Figure 26. Comparison of leaching levels for REE of the
raw sample and the magnetic separated sample 57 Figure 27. Concentration of Fe in the leachate of the
raw sample and the magnetic separated sample 57 Figure 28. Comparison of leaching levels with change of
sample particle size 60
Figure 29. Comparison of concentration of elements in leachate with change of sample particle size
60 Figure 30. Change of leaching levels with time at 10 %
of pulp density 62
Figure 31. Change of leaching levels with time at 15 %
of pulp density 63
Figure 32. Change of leaching levels with time at 25 %
of pulp density 64
Figure 33. Change of leaching levels with time at 40 %
of pulp density 65
Figure 34. Proposed REE processing of the HGZ ore 67
1. Introduction
1.1. Research background
Rare Earth Elements (REE), oft known as the 'vitamin of industry,' are significant materials used for the modern high-tech industry. The elements are used for many applications like computers, mobile phones, optical glasses, phosphors, lasers, etc. However, China, which produces 97 % of the REE in the world, announced a reduction in the export quota of REE in July 2010. In September 2010, China declared a REE export ban to Japan after a dispute over the Senkaku Islands between China and Japan. As a result, China's export restraints on REE caused a spike in prices and raised fears of an unstable supply (Hong, 2012). Therefore, it became imperative to obtain a stable supply of REE throughout the whole world especially as the importance of REE is rising in Korea.
REE refer to the fifteen metallic elements in the lanthanide series (atomic numbers 57 ~ 71) with the chemically similar yttrium (39), and occasionally scandium (21) (Gupta et al., 1992). They are divided into two or three groups; in two groups, atomic numbers 57 through 63 (La ~ Eu) are "Light REE (LREE)" and 64 through 71 (Gd ~ Lu) and 39 (Y) are
"Heavy REE (HREE)." For 3 groups, 57 ~ 60 (La ~ Nd) are LREE, 61 ~ 64 (Pr ~ Gd) are "Medium REE (MREE)," and 65
~ 71 (Tb ~ Lu) and 39 (Y) are HREE. Scandium, when it is classified as a REE, is not included in either the LREE or HREE classifications (Gupta et al., 1992).
Unlike as is referenced by the name, REE are not rare, because they were named before technology had been developed. The amount of the rarest REE in the Earth's crust is greater than that of precious metals like gold or platinum.
The total rare earth oxide (TREO) concentration in the crust is about 220 ppm, which is more than the 200 ppm concentration of carbon. Ce is the 25th most abundant element at 68 ppm and is similar to copper (Anderson et al., 2011).
Recently, there have been confirmed REE reserves of 88 million tons worldwide with possible reserves up to 150 million tons. China is known to have 30.9 % of the confirmed reserves and 57.71 % of possible reserves, which is then followed by the Commonwealth of Independent States (CIS), US, Australia, India, Brazil, and Malaysia (Kim, 2011). In Figure 1, the world distribution of REE deposits, reserves, and operating mines are shown. Due to environmental problems and mass production of REE in China, REE production outside of China has ceased since the late 1990s.
Figure 1. Worldwide distribution of REE deposits, reserves and operating mines (Okuya, 2011)
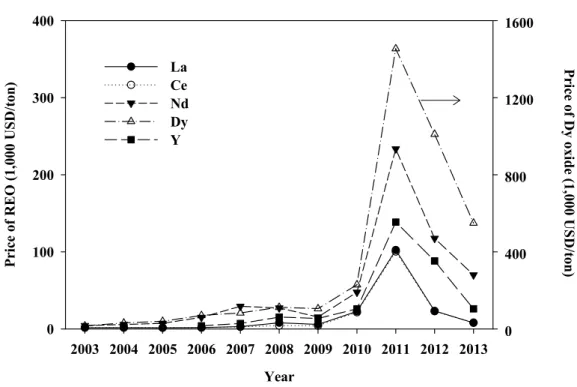
The side effects of China's REE monopoly are serious since China uses REE as weapon during diplomatic disputes with other countries. China wins the dispute by stopping the REE export as with the case of the Senkaku Islands. Thus, between 2010 and 2011, REE prices soared dramatically (Figure 2). Now, REE prices have decreased to a little higher level than they were in 2010, but countries that import REE cannot rely on China if they want to prevent a similar problem from occurring in the future.
Year
2003 2004 2005 2006 2007 2008 2009 2010 2011 2012 2013
Price of REO (1,000 USD/ton)
0 100 200 300 400
Price of Dy oxide (1,000 USD/ton)
0 400 800 1200 1600
La Ce Nd Dy Y
Figure 2. Price of REE in recent 10 years (KORES, 2013)
In Korea, the problems involved with REE prices increases are more serious. When REE prices were cheap, the technologies for processing REE products had not yet been developed. Instead, Korea imported finished or half-finished REE products from other countries such as Japan or China, which led to few REE processing technologies in Korea. Thus, the import costs increase more when prices of raw REE materials soar. Although the REE prices are relatively stable now, they can soar again. Therefore, Korea needs to take countermeasures for resources security since there are no economical REE ore deposits within the nation. REE mines in overseas locales and REE processing technologies are crucially needed.
According to a 2009 estimate by the U.S. Geological Survey, Mongolia has 31 million tons of REE reserves, or 16.77 percent of the world's total, which is exceeded only by China. In light of Chinese restrictions, Mongolia has become a leading contender in the new rush for REE resources. At present, Mongolia is planning to massively increase its transportation infrastructure in order to ship mineral resources across the country to Russia's Far East. Therefore, Korea can potentially receive Mongolian resources as a major metal supplier. A R&D project was set up through international collaboration to explore one of the REE deposits in Mongolia.
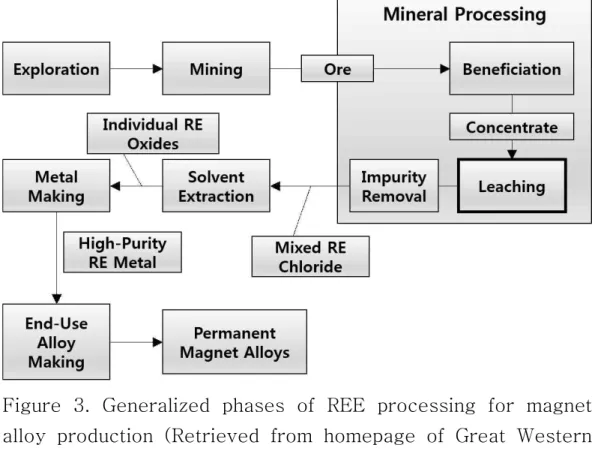
Every ore deposit has a unique mixture of elements and minerals, requiring the development of a process uniquely
suitable for separating the minerals from each ore deposit. As shown in Figure 3, the exploration, mining, mineral processing, purification of leachate, metal making, and magnet making are currently under process. This study reports on the project with an emphasis on developing an effective leaching method to extract REE from the ore.
Figure 3. Generalized phases of REE processing for magnet alloy production (Retrieved from homepage of Great Western Minerals Group)
1.2. Recent studies
REE research has been limited in Korea. From the late 1980s to 1990s, monazite ore deposits were discovered Hongcheon, in Gangwon. In 2011, 150 thousand tons of REE ore were confirmed in that location. REE mineral processing research began in the 1990s by Korea Institute of Geoscience and Mineral Resources (KIGAM). In 2004, REE leaching studies using Hongcheon monazite were carried out and extraction of valuable materials from Hongcheon REE ores was tried in 2010 ~ 2011 for government task, but the results of these studies were not commercialized. On the other hand, the US, Australia, China, and other countries conducted a significant amount of research due to the plethora of high grade REE ore deposits. In the recent 20 ~ 30 years, China has been a significant source of research.
There are no economic REE ore deposits in Korea, so overseas REE ore developments have been attempted. One of them is "Mushgai Khudag REE project in Mongolia." From 1980s, studies about geology, mineralization, exploration method were carried out about that area. In the early 1980s, the mineral prospecting study was carried out at Mushgai Khudag by Geological Information Center in Russia, and the Mongolian geological survey team conducted drilling surveys and made geological maps.
Garamjav and Jargalan studied Mongolian REE matellogeny in 2009, while Yoo and Koh, in KIGAM, studied Mushgai
Khudag ore types, in 2011. On-site surveys for R&D projects were carried out by Korea Resources Corporation (KORES) in 2011. From these studies, Mushgai Khudag geology and ore type information was obtained. However, it seemed that hydrometallurgical studies involved in Mushgai Khudag materials were rare.
REE are mainly produced from bastnasite (R2(CO)3F3) and monazite (RPO4) while Y can be produced from xenotime (YPO4). There are many leaching studies based on these minerals, and common leaching methods were established.
Monazite ore undergoes grinding, spiraling, and magnetic separating; the concentration is leached through the concentrated sulfuric acid method or NaOH method. Monazite has been mined in Australia, India, US, and other areas to a lesser degree (Anderson et al., 2011). Bastnasite ore is crushed, ground, classified, and concentrated by flotation, and the concentrated ore undergoes HCl digestion. The residue is reacted with NaOH to produce REE hydroxides, which then repeat HCl leaching. In addition, the ore can be leached with sulfuric acid after oxidization roasting. Bastnasite is primarily mined in the US and China (Anderson et al., 2011).
In this study, the major REE mineral is apatite, which does not yet have a established hydrometallurgical method.
However, from the 1950s, studies about REE contained in phosphate rock as well as REE extraction from phosphate rock were conducted. Recently, laboratory studies about REE leaching from Chardormalu apatite was conducted in Iran
(Esmaeil Jorjani et al., 2011). Phosphate rock contains up to 1
% REE oxides present in isomorphous substitution for Ca2+
(Habashi, 1985).
1.3. Research purpose
Before China announced a reduction in REE export quota in 2010, REE prices were very low. REE processing technology development was rarely done in Korea as China produces approximately 97 % of the world production of REE. However, the reduction of REE exports quota and the dispute between China and Japan led to increases in prices. The prices have decreased somewhat since then, but are still higher than they were in 2009. In the future, an imbalance between REE supply and demand is expected due to industry developments in developing countries and the application of high-technology associated with REE in advanced countries. Thus, REE prices will remain high, so Korea has to develop overseas REE ore deposits and obtain processing technologies.
REE hydrometallurgical research was performed in this study to derive REE acid leaching. Leaching is the first step for extracting REE from the ore, and the amount of REE extracted in this step determines the amount of REE product.
The scope of this study is as follows:
1) First, basic leaching kinetics experiments were conducted.
This work is basic to other experiments. The possibility of reaction can be figured out. Also, optimum leaching time can be determined.
2) Leaching level changes were evaluated at various
concentrations of the leaching reagent. Several leaching reagents were used to find the optimal concentrations and types.
3) From the results, the optimum leaching reagent was selected keeping the price in mind. Leaching reagent must extract materials effectively, too. Sulfuric acid, hydrochloric acid, and nitric acid were used as leaching reagents.
4) To improve leaching levels, experiments were performed at different temperatures. Since the reaction rate can increase at higher temperatures, the leaching levels can be improved when temperatures increase. In some cases, increasing the temperature can be more economical than increasing concentration of reagents. Therefore, the temperature effect needs to be studied.
5) The leaching experiments with magnetic separated sample were carried out. REE minerals are usually associated with Fe minerals. Therefore, Fe needs to be removed to improve REE leaching levels and remove impurities. The leaching experiments were done with both raw samples and magnetic separated samples before evaluating the leaching levels and concentrations of REE and Fe in leachate.
6) A study about the changes in leaching levels was conducted as the sample particle size changed. To extract
target materials efficiently, an accurate liberation degree is needed. The smaller the sample particle size, the larger its surface area; thus, contact between the sample and reagent can occur more frequently. However, if the particle size is too small, impurities can be leached out, which means the sample particle size needs to be controlled accurately.
7) Leaching experiments were conducted with pulp density changes. Generally, the lower the pulp density, the higher the leaching levels. However, if the pulp density is too low, the consumption of leaching reagent increases and increases the cost. When there is a high pulp density, the target materials cannot be extracted. Thus, it is important to determine the optimum pulp density.
The final goal of this study is to achieve 80 % leaching levels that lead to the optimum leaching conditions and remove impurities.
2. Background theory
2.1. Chemical properties of REE
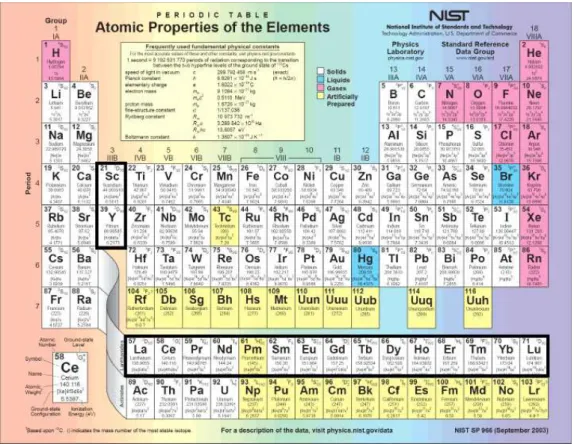
REE consist of 17 elements - 15 lanthanide elements from No. 57 to 71 in the periodic table, as shown in Figure 4, lanthanum (La), cerium (Ce), praseodymium (Pr), neodymium (Nd), promethium (Pm), samarium (Sm), europium (Eu), gadolinium (Gd), terbium (Tb), dysprosium (Dy), holmium (Ho), erbium (Er), thulium (Tm), ytterbium (Yb), lutetium (Lu), and No. 21 scandium (Sc), No. 39 yttrium (Y). The atomic numbers 57 through 71 are similar with lanthanum, so they were named lanthanide. In addition, No. 21 Sc is classified as a REE because its property is similar to lanthanide and Y.
The properties of REE are similar because they have the same number of peripheral electrons. This makes it difficult to separate them from each other. In the past, REE were not separated but made into mixed REE or mischmetal. Recent developments into REE separation and purification show that REE can be separated at very high purity (Kim et al., 2010).
Figure 4. Periodic table
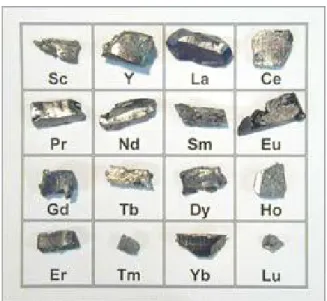
REE can be separated by adjusting the OH- concentration or adding oxidant / reductants, despite the chemical similarity of these metal ions (Kim et al., 2014). Most of the REE are present in nature in a +3 valance state. However, some REE such as Ce, Pr, and Tb can exist at a +3 or +4 valance state, and other REE such as Sm, Eu, Tm, and Yb are in a +2 or +3 state. These different valance states can be used to separate these elements from others as shown in Figure 5, which shows separated REE metals.
Figure 5. Many kinds of REE metals
In nature, REE exist in over 200 minerals. However, 95 % of REE are found in bastnasite, monazite, and xenotime along with various kinds of REE minerals: patite, cheralite, eudialyte, loparite, phosphorites, rare-earth-bearing (ion adsorption) clays, secondary monazite, and spent uranium solutions.
2.2. Analysis of thermodynamic data
Thermodynamic data (Firsching et al., 1991; Kim et al., 2014; La Iglesia, 2009; Oxtoby et al., 2002) was analyzed to identify the mechanism of REE ore leaching. Through analysis, theoretical leaching pH's were found, and established the experimental pH.
The theoretical leaching pH's of REE phosphates and carbonates as well as apatite were calculated. Such calculations have practical importance since REE occur in nature in association with phosphate, as is the case of the monazite type deposits, carbonate in the bastnasite type (Kim et al., 2014), or apatite ore in the Mushgai Khudag research area.
To calculate the leaching pH, ΔGf° values of REE phosphates and carbonates, apatite, and REE ions must be known. The ΔGf° values of apatite, REE ions, and Ca phosphate were found easily, but those of REE phosphates and carbonates were calculated from Ksp values.
In Tables 1 and 2, the leaching pH's of REE phosphates and carbonates are shown. The fluorapatite, hydroxyapatite, and Ca phosphate are shown in Tables 3 to 5. Leaching pH's were calculated according to Eq. (1) to (5), where leaching pH's were calculated on the assumption that 0.1 mol/L of REE were dissolved in the solution.
→ (1)
→ (2)
→ (3)
→ (4)
→ (5)
From the results in Table 1, REE phosphates can be leached at pH of about -1. The dissolution of REE from phosphates by an acid has been very difficult, requiring very high acid consumption (Kolonin et al., 2008; Shwe et al., 2008), but REE carbonates can be leached more easily than phosphate at pH 2 ~ 4. For apatite, leaching pH varied with type. From Tables 3 and 4, it is shown that fluorapatite could be leached out at pH of about 0.9 and hydroxyapatite at pH of about 2.9. Ca phosphates can be leached at pH 1.8 (Table 5). With this information, effective experimental leaching pH can be determined.
The leaching pH of Ce phosphate and carbonate were not calculated due to lack of data. However, chemical properties of REE are similar, which means that leaching pH may be similar as well.
REE Phosphates
ΔGf° (kcal/mol)
RPO4 H+ R3+ H3PO4 ΔG° pH
YPO4 -441.22 0.00 -164.10 -272.94 4.18 -0.69 LaPO4 -453.52 0.00 -174.50 -272.94 6.08 -1.15 PrPO4 -449.20 0.00 -170.30 -272.94 5.95 -1.12 NdPO4 -446.95 0.00 -168.20 -272.94 5.80 -1.09 SmPO4 -445.80 0.00 -167.00 -272.94 5.86 -1.10 GdPO4 -443.78 0.00 -165.80 -272.94 5.04 -0.90 Table 1. Analysis of thermodynamic data about REE phosphates
REE Carbonates
ΔGf° (kcal/mol)
R2(CO3)3 H+ R3+ H2CO3 ΔG° pH
Y2(CO3)3 -749.45 0.00 -164.10 -148.85 -25.30 3.42 Sc2(CO3)3 -714.45 0.00 -143.70 -148.85 -19.50 2.72 La2(CO3)3 -768.06 0.00 -174.50 -148.85 -27.50 3.69 Pr2(CO3)3 -764.13 0.00 -170.30 -148.85 -23.02 3.15 Nd2(CO3)3 -761.17 0.00 -168.20 -148.85 -21.78 2.99 Sm2(CO3)3 -759.19 0.00 -167.00 -148.85 -21.35 2.94 Gd2(CO3)3 -758.21 0.00 -165.80 -148.85 -19.94 2.77 Table 2. Analysis of thermodynamic data about REE carbonates
ΔGf°(kJ/mol)
Ca10(PO4)6F2 H+ Ca2+ H3PO4 HF ΔG° pH
-12885.9 0 -553.58 -1142.54 -296.82 -98.78 0.87 Table 3. Analysis of thermodynamic data about fluorapatite
ΔGf°(kJ/mol)
Ca10(PO4)6(OH)2 H+ Ca2+ H3PO4 H2O ΔG° pH
-12503.5 0 -553.58 -1142.54 -237.18 -361.9 2.88 Table 4. Analysis of thermodynamic data about hydroxyapatite
ΔGf°(kJ/mol)
Ca3(PO4)2 H+ Ca2+ H3PO4 ΔG° pH
-3884.82 0 -553.58 -1142.54 -61 1.78
Table 5. Analysis of thermodynamic data about Ca phosphate
2.3. Leaching methods of REE ores
The most typical REE minerals are monazite and bastnasite.
Thus, the hydrometallurgical studies about these minerals have been conducted for a long time and established common leaching methods. In this study, the target mineral is apatite.
Therefore, to conduct more effective experiments, a case study on the leaching of monazite, bastnasite, and apatite was conducted.
2.3.1. Monazite
[19]For the hydrometallurgical treatment of monazite, a concentrated sulfuric acid method and NaOH method are mainly used. The concentrated sulfuric acid method can be used even for ore contained in low concentrations of REE and large particles. However, sulfuric acid can corrode facilities and lead to environmental problems. It’s difficult to recover phosphorus in the ore as well.
The particle sizes of sample must be very fine in the NaOH method. However, the maintenance of facilities is not difficult and environment problems rarely occur. Since it is possible to recover phosphorus, in most monazite processes, the NaOH method is used at normal pressure.
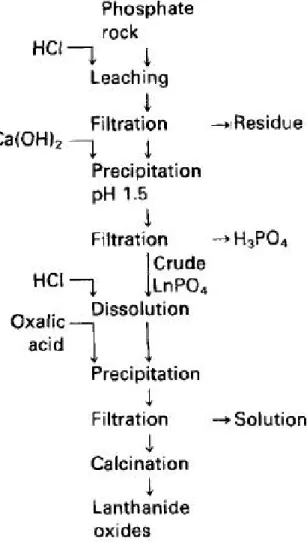
As shown in Figure 6, monazite is first reacted with NaOH to acquire REE hydroxides. At this time, thorium (Th) is changed to be insoluble Th hydroxide, whereas phosphorus is
changed to be soluble sodium phosphate as shown in Eq. (6) and (7). Then, the REE hydroxides are leached with HCl (Eq.
(8)).
Figure 6. Decomposition and leaching process of monazite (Park et al., 2012)
→ (6)
→ (7)
→ (8)
2.3.2. Bastnasite
[19]Bastnasite can be leached in two methods: hydrochloric acid leaching and sulfuric acid leaching. Bastnasite leaching with HCl is conducted at 90 ℃ (Eq. (9)).
→
(9)
After Eq. (9), REF3 solids are reacted with 20 % NaOH, which produce REE hydroxides (Eq. (10)). These hydroxides are used to neutralize excess HCl from Eq. (9) through the reaction shown in Eq. (11).
→ ↑ (10)
→ (11)
When bastnasite is leached with HCl, there are many advantages: low acid consumption, low cost, and a high level of REE recovery. However, the highly concentrated HCl can corrode facilities.
As shown in Figure 7, when using sulfuric acid, the ore has to be oxidized and then leached with sulfuric acid. Bastnasite can be leached effectively with sulfuric acid once the ore is roasted (Eq. (12)). Through the roasting, Ce is oxidized from +3 to +4 valance state and Ce separation from other elements is possible using this property.
→ (12)
Figure 7. Sulfuric acid leaching process of bastnasite (Park et al., 2012)
2.3.3. Apatite
[7]REE in the Earth's crust is 0.015 % and in phosphate rock it can be as high as 1 % (Habashi, 1985). In contrast to igneous rocks, REE in phosphorites do not form their own minerals but enter into the crystal lattice of calcium phosphate in isomorphous substitutions for Ca2+.
Sulfuric, nitric, and hydrochloric acids have been used as leaching reagents to extract REE from apatite (Esmaeil Jorjani et al., 2011). The recovery of REE and leaching product types vary depending on the leaching reagent.
When apatite is leached with sulfuric acid to obtain phosphoric acid, most of REE are lost to gypsum according to Eq. (13).
→
·
(13)
REE in gypsum are present by isomorphous substitution with Ca2+. The losses, amounting to about 70 %, can be minimized if the leaching is conducted at low temperatures with less concentrated H2SO4 (Habashi, 1985). Through leaching with nitric acid, REE can be recovered from gypsum.
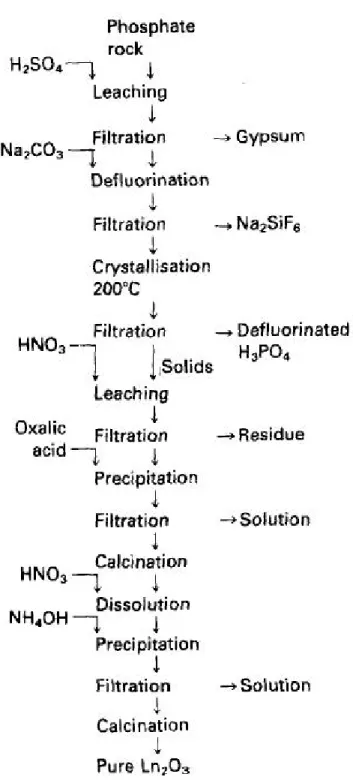
Figure 8 shows the flow sheet of REE recovery from wet process phosphoric acid by crystallization.
Figure 8. Recovery of pure REE oxides from wet process phosphoric acid by crystallization (Habashi, 1985)
When apatite is leached with nitric acid, all of REE are dissolved well. Thus, most of REE can be recovered from the ore. Apatite is easily leached at 60 ℃, using 50 ~ 60 % of nitric acid by Eq. (14).
→ (14)
After filtering to remove silica, the filtrate is cooled to –5
°C to crystallize about 70 % of the · which is separated by centrifuging. The solution is defluorinated at times by adding sodium nitrate.
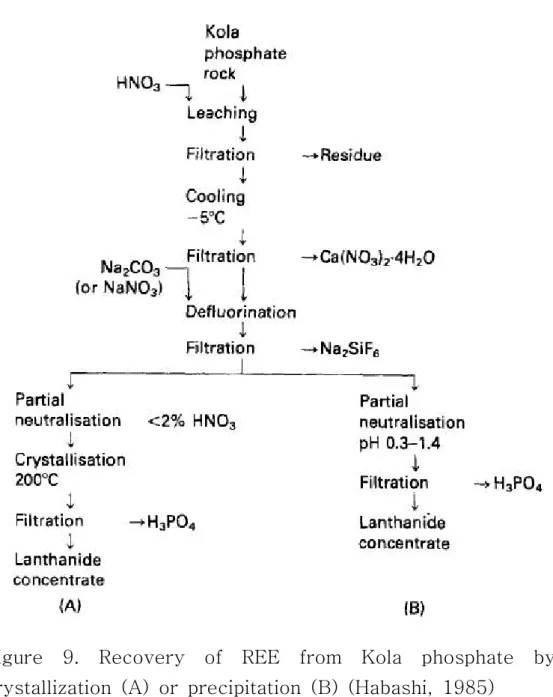
Next process can be done in two ways: crystallization and REE precipitation. In crystallization, the solution is crystallized into REE phosphates at an elevated temperature by neutralizing the solution using NH4OH and heating it at 200 ℃ for an hour to make REE phosphate crystal.
REE precipitation by adjusting pH is when the solution is adjusted to 0.3 ~ 1.4 at temperatures of 70 ~ 90 ℃. The REE phosphate can be obtained and purified through the oxalate method or solvent extraction. Figure 9 shows the REE recovery by crystallization or precipitation.
Figure 9. Recovery of REE from Kola phosphate by crystallization (A) or precipitation (B) (Habashi, 1985)
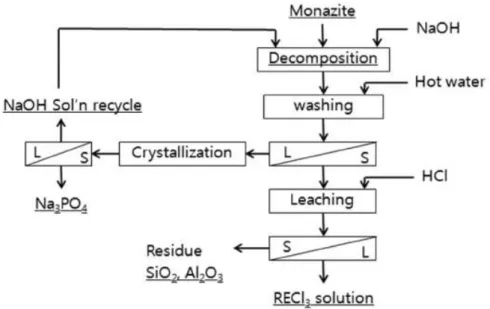
When apatite is leached with hydrochloric acid, the REE will be found in the solution. They can be isolated by precipitation as phosphate with Ca(OH)2 to pH 1.5 ~ 1.6. The separated phosphate is redissolved with HCl and re-precipitated with oxalic acid. Then, REE oxalate is calcined at 800 ℃ and REE oxide containing 90 % REE is recovered as shown in Figure 10.
Figure 10. Recovery of REE from phosphate rock by HCl leaching process (Habashi, 1985)
3. Materials and methods
3.1. Sample characteristic
As shown in Figure 11, the Mushgai Khudag REE deposit is located in Mandal-Oboo, Omnogovi, Mongolia: 44° 21' 28'' ∼ 44° 24' 08'' north latitude, 103° 29' 07'' ∼ 104° 03' 09'' east longitude (Yoo et al., 2011).
The Mushgai Khudag REE deposit in southern Mongolia is composed of sheet-like magnetite-apatite ore bodies along the Jurassic syenite porphyry and host Paleozoic sedimentary rocks. The magnetite-apatite ores consist mainly of apatite, barian celestite, magnetite, hematite goethite, fluorite, gypsum, phlogopite, carbonates (mostly calcite), pyrite and monazite-(Ce) (Sanematsu et al., 2010).
Figure 11. Location of Mushgai Khudag, in Mongolia (KORES, 2011)
The sample was collected from the High Grade Zone (HGZ) Mushgai Khudag area in Mongolia (Figure 12). A mineral analysis revealed that the main REE-bearing minerals are apatite (Figure 13) with small amounts of monazite and xenotime.
A chemical analysis of the sample is shown in Table 6, which shows total REE content at about 10 % of LREE with Ce being the most abundant element followed by La, Nd, Pr, and Y.
Figure 12. Sampling in HGZ Figure 13. Apatite sample
Formula wt.% Formula wt.%
CaO 32.75 MgO 0.53
Fe2O3 22.91 SrO 0.47
P2O5 18.3 Na2O 0.45
SiO2 9.65 Pr6O11 0.42
CeO2 5.8 MnO 0.29
La2O3 3.01 Y2O3 0.28
SO3 1.8 K2O 0.25
Nd2O3 1.48 ThO2 0.06
Al2O3 0.87 ZnO 0.05
TiO2 0.62 CuO 0.04
Table 6. Chemical contents of HGZ sample
The sample was crushed to -1 mm in stages by a jaw crusher and disk mill. It was then ground by ball mill or centrifugal mill to prepare three different sizes: (1) 90 % passing 50 mesh (0.3 mm), (2) 90 % passing 100 mesh (0.15 mm), and (3) 85 % passing 200 mesh (0.075 mm). The complete size distributions are shown in Tables 7 ~ 9 and Figures 14 ~ 16.
Mesh Size (mm) Wt. (g) Cumulative wt. (g)
Cumulative
% passing
16 1.18 0.04 34.53 100
20 0.85 0.21 34.49 99.9
30 0.6 0.64 34.28 99.3
40 0.425 2.42 33.64 97.4
50 0.3 3.46 31.22 90.4
70 0.212 4.53 27.76 80.4
100 0.15 4.02 23.23 67.3
140 0.106 3.62 19.21 55.6
200 0.075 3.7 15.59 45.1
270 0.053033 3.86 11.89 34.4
400 0.0375 8.03 8.03 23.3
Total 34.53
Table 7. Size analysis of HGZ sample (d90: 50 mesh)
Size (mm)
0.01 0.1 1 10
Cumulative % passing
0.1 1
Figure 14. Cumulative size distribution of HGZ sample (d90: 50 mesh)
Mesh Size (mm) Wt. (g) Cumulative wt. (g)
Cumulative
% passing
16 1.18 0 34.63 100
20 0.85 0 34.63 100
30 0.6 0 34.63 100
40 0.425 0.03 34.63 100
50 0.3 0.67 34.6 99.9
70 0.212 2.43 33.93 98.0
100 0.15 3.98 31.5 91.0
140 0.106 4.17 27.52 79.5
200 0.075 5.26 23.35 67.4
270 0.053033 7.61 18.09 52.2
400 0.0375 10.48 10.48 30.3
Total 34.63
Table 8. Size analysis of HGZ sample (d90: 100 mesh)
Size (mm)
0.01 0.1 1 10
Cumulative % passing
0.1 1
Figure 15. Cumulative size distribution of HGZ sample (d90: 100 mesh)
Size (mm) Cumulative %passing
0.631 100
0.417 100
0.316 99.9
0.209 99.1
0.158 97.6
0.105 92.6
0.079 87.0
0.0525 75.8
0.0347 63.6
0.0263 55.5
0.0174 44.3
0.0132 37.5
Table 9. Size analysis of HGZ sample (d85: 200 mesh)
Size (mm)
0.01 0.1 1 10
Cumulative % passing
0.1 1
Figure 16. Cumulative size distribution of HGZ sample (d85: 200 mesh)
3.2. Experimental methods
3.2.1. Leaching experiment
Sulfuric, hydrochloric, and nitric acid at various concentrations (0.1 ~ 13.0 M for sulfuric acid, 0.6 ~ 3.85 M for hydrochloric acid, and 1.0 ~ 5.5 M for nitric acid) were used as leaching reagents for leaching experiments. The pH of the acid solution was measured and when the pH stabilized, the ore sample was added to a 600 mL beaker containing the acid solution. When testing at increased temperatures, the sample was added to a double-walled glass vessel after the temperature reached the target point. The solution temperature was maintained by circulating hot water and the slurry was then agitated with an impeller-type stirrer at 300 rpm. Solution samples were collected at regular intervals and filtered using 0.45 ㎛ cellulose acetate filter.
The filtrate was diluted 10 times with 1.0 M HCl and subjected to ICP analysis. Leaching tests were conducted at three different temperatures: 25 ℃, 50 ℃, and 80 ℃ to investigate the temperature effect on leaching.
3.2.2. Magnetic separation
To remove Fe, wet magnetic separation was performed using a laboratory magnetic separator (ERIEZ, Wet high intensity magnetic separator L-4). 10 g of the sample and 0.01 g of aerosol-OT was added to a 2 L beaker containing 90 mL of water. The slurry was mixed by hand-shaking and was put into the magnetic separator with an applied magnetic field at various magnetic intensities: 1000 gauss, 4000 gauss, and 12000 gauss. The beaker and the separator were washed with ample water and then some slurry was recovered as the non-magnetic portion.
After removing the magnetic field, the separator was washed again and the remaining slurry was recovered as the magnetic portion. The separated product was dried in the oven at 110 ℃ for 12 hours, weighed, and recovered.
3.2.3. Nitro-hydrochloric acid digestion – the sample concentration measurement
After the leaching experiment was completed, the residue was separated from leachate. The concentration of leachate, and raw sample and residue digested using nitro-hydrochloric acid were analyzed through Inductively Coupled Plasma Optical Emission Spectrometer (ICP-OES).
The nitro-hydrochloric acid digestion was prepared by adding 4 mL of acid to 0.25 g of each sample. The digestion was progressed at 70 ℃ for an hour until the acid slurry was filtered using 0.45 ㎛ cellulose acetate filter. Distilled water was added to filtrate to make 10 mL.
4. Results and discussion
4.1. Leaching kinetics
To determine the optimum leaching time for the HGZ sample, leaching levels were evaluated at various leaching times. 13.0 M sulfuric acid, 2.0 M hydrochloric and nitric acid were used as leaching reagents and Tables 10 ~ 12 show the detailed leaching conditions. The leaching kinetics were very fast for all REE with less than 1 hr to reach maximum leaching levels.
Figure 17 shows the typical results when 13.0 M sulfuric acid was used and the leaching levels decreased after 3 hrs.
This is probably due to the precipitation of REE with SO42- as discussed in detail in the next section.
Content Condition
Acid type Sulfuric acid
Acid concentration 13.0 M
Pulp density 10 %
(sample 10 g, acid solution 90 mL) Sample size d90: 50 mesh (0.3 mm)
Residence time 5 hrs
Agitation speed 300 rpm
Temperature room temperature (25 ℃) Table 10. Experiment conditions of leaching kinetics (1)
Time (hour)
0 1 2 3 4 5 6
Percent leaching
0 20 40 60 80 100
Ce La Nd Pr
Figure 17. Change of leaching levels with time (leaching reagent: 13.0 M sulfuric acid)
Figure 18 shows that leaching levels change with time when 2.0 M of hydrochloric acid was used as a leaching reagent.
90 % REE were leached out in 10 minutes, and after 1 hr, almost 100 % REE were leached. Unfortunately, radioactive elements U and Th were leached out together with REE, indicating that radioactive elements removal from the leachate may be necessary by using separation techniques such as selective precipitation or solvent extraction method.
Content Condition
Acid type Hydrochloric acid
Acid concentration 2.0 M
Pulp density 10 %
(sample 10 g, acid solution 90 mL) Sample size d90: 50 mesh (0.3 mm)
Residence time 2 hrs
Agitation speed 300 rpm
Temperature room temperature (25 ℃) Table 11. Experiment conditions of leaching kinetics (2)
Time (min)
0 20 40 60 80 100 120 140
Percent leaching
0 20 40 60 80 100
Fe P Ca Ce La Nd Pr Y U Th
Figure 18. Change of leaching levels with time (leaching reagent: 2.0 M hydrochloric acid)
When nitric acid was used as the leaching reagent, leaching levels were high like with hydrochloric acid. As shown in Figure 19, 80 ~ 90 % REE were leached out in 30 minutes, and leaching levels reached 100 % at 3 hrs. There are also high levels of impurities.
Content Condition
Acid type Nitric acid
Acid concentration 2.0 M
Pulp density 10 %
(sample 10 g, acid solution 90 mL) Sample size d90: 50 mesh (0.3 mm)
Residence time 3 hrs
Agitation speed 300 rpm
Temperature room temperature (25 ℃) Table 12. Experiment conditions of leaching kinetics (3)
Time (min)
0 20 40 60 80 100 120 140 160 180
Percent leaching
0 20 40 60 80 100
Fe P Ca Ce La Nd Pr Y U Th
Figure 19. Change of leaching levels with time (leaching reagent: 2.0 M nitric acid)
4.2. Effect of acid concentration and type on leaching levels
To dissolve target materials in the ore, a suitable acid concentration must be maintained. At low acid concentration, materials cannot be dissolved adequately. On the contrary, various impurities can be leached with target materials at high acid concentration, which can cause deleterious effects. Thus, before leaching, the optimum leaching pH has to be determined with thermodynamic data.
Leaching experiments were performed at various acid concentrations to find optimum acid concentrations for leaching REE in the ore. Additionally, changes in leaching efficiency was studied using sulfuric, hydrochloric, and nitric acid as leaching reagents to determine the optimum leaching reagent.
Figure 20 shows the changes in leaching efficiency at 25 ℃ for various sulfuric acid concentrations and the experimental conditions are listed in Table 13. When the acid concentration was less than 5.0 M, the leaching levels were below 50 %.
The leaching level increased with increased sulfuric acid, but did not go beyond 80 % even at 13.0 M of sulfuric acid. As discussed previously, this may be from the co-precipitation of REE during calcium sulfate formation (Habashi, 1985). The XRD analysis of the residue shows the presence of CaSO4
(Figure 21). Therefore, sulfuric acid may not be suitable for this ore as leaching is limited due to formation of sulfates.
Content Condition
Acid type Sulfuric acid
Acid concentration 0.1 M, 1.0 M, 2.0 M, 5.0 M, 9.0 M, 13.0 M
Pulp density 10 %
(sample 10 g, acid solution 90 mL) Sample size d90: 50 mesh (0.3 mm)
Residence time 5 hrs
Agitation speed 300 rpm
Temperature room temperature (25 ℃)
Table 13. Experiment conditions of effect of acid concentration (1)
Acid concentration (mol/L)
0 2 4 6 8 10 12 14
Percent leaching
0 20 40 60 80 100
Ce La Nd Pr
Figure 20. Change of leaching levels at various sulfuric acid concentrations
Figure 21. Result of XRD analysis about residue from leaching with 13.0 M of sulfuric acid
Figure 22 shows the change in leaching levels at different concentrations of hydrochloric acid with the leaching conditions shown in Table 14. None of the REE was leached out when the acid concentration was less than 1.0 M, but at higher concentrations of hydrochloric acid, the leaching levels started to increase sharply and reach 97 ~ 98 % at 2.0 M. At acid concentration of 2.75 M, nearly 100 % REE were leached out. However, the concentrations of Fe and Ca ions in the leachate were found to be very high (Fe: 260 ppm, Ca: 28000 ppm), which can increase the level of impurities when the REE is recovered as oxalate or carbonate precipitates from REE chloride solution.
Content Condition Acid type Hydrochloric acid
Acid concentration 0.6 M, 1.0 M, 1.5 M, 2.0 M, 2.4 M, 2.75 M, 3.85 M
Pulp density 10 %
(sample 10 g, acid solution 90 mL) Sample size d90: 50 mesh (0.3 mm)
Residence time 5 hrs
Agitation speed 300 rpm
Temperature room temperature (25 ℃)
Table 14. Experiment conditions of effect of acid concentration (2)
Acid concentration (mol/L)
0 1 2 3 4
Percent leaching
0 20 40 60 80 100
Fe P Ca Ce La Nd Pr Y U Th
Figure 22. Change of leaching levels at various hydrochloric acid concentrations
The leaching experiments when nitric acid was used are shown in Figure 23 while Table 15 shows detailed leaching conditions. The results are similar for hydrochloric acid. REE were not leached at 1.0 M, but leaching levels were increased dramatically to about 100 % at 2.0 M. However, many impurities were leached out, which means they must be removed. Furthermore, nitric acid is more expensive than hydrochloric acid, which may not be viable for economical processes.
Content Condition
Acid type Nitric acid
Acid concentration 1.0 M, 2.0 M, 5.5 M
Pulp density 10 %
(sample 10 g, acid solution 90 mL) Sample size d90: 50 mesh (0.3 mm)
Residence time 5 hrs
Agitation speed 300 rpm
Temperature room temperature (25 ℃)
Table 15. Experiment conditions of effect of acid concentration (3)
Concentration (mol/L)
0 1 2 3 4 5 6
Percent leaching
0 20 40 60 80 100
Fe P Ca Ce La Nd Pr Y U Th
Figure 23. Change of leaching levels at various nitric acid concentrations
4.3. Effect of temperature on leaching levels
Generally, the chemical reaction rate is faster at a higher temperature. The leaching reaction is also one of the chemical reactions, thus the leaching levels may increase at elevated temperatures. The leaching tests were conducted at elevated temperatures.
To determine the effect temperature has on the reaction, leaching experiments were performed using 13.0 M sulfuric acid at room temperature (25 ℃) and 80 ℃. The leaching time was 3 hours at 80 ℃ with detailed experimental conditions given in Table 16 and results in Figure 24.
Content Condition
Acid type Sulfuric acid
Acid concentration 13.0 M
Pulp density 10 %
(sample 10 g, acid solution 90 mL) Sample size d90: 50 mesh (0.3 mm)
Residence time 3 hrs
Agitation speed 300 rpm
Temperature 25 ℃, 80 ℃
Table 16. Experiment conditions of effect of temperature (1)
When the temperature was increased to 80 ℃, the leaching levels of most REE increased significantly up to over 80 %.
However, the same leaching levels can be obtained with hydrochloric acid under much milder conditions. Therefore, hydrochloric acid is a better choice as a leaching reagent for this ore.
Figure 24. Comparison of leaching using 13.0 M sulfuric acid at 25 ℃ and 80 ℃
Leaching experiments were performed at some temperatures using hydrochloric acid as the leaching reagent with leaching conditions listed in Table 17. Since almost 100 % REE were leached out with 2.0 M hydrochloric acid, tests were conducted using 1.0 M hydrochloric acid at 25 ℃, 50 ℃, and 80 ℃.
Content Condition Acid type Hydrochloric acid
Acid concentration 1.0 M
Pulp density 10 %
(sample 10 g, acid solution 90 mL) Sample size d90: 50 mesh (0.3 mm)
Residence time 3 hrs
Agitation speed 300 rpm
Temperature 25 ℃, 50 ℃, 80 ℃
Table 17. Experiment conditions of effect of temperature (2)
As shown in Figure 25, there was not much increase in the leaching levels for REE, but other impurity ions (Fe, P, Ca, U) were leached out as the temperature increased. Therefore, there was no benefit to operating at higher temperatures and it is better to o