https://doi.org/10.20307/nps.2017.23.1.9
9
Optimization of Extraction Conditions for Active Compounds of Herbal Medicinal Formula, DF, by Response Surface Methodology
Birang Jeong1, Seong Yeon Choi1, Hyeon Seok Jang1, Guijae Yoo2, Seung Hyun Kim2, Jung-Hwan Kim3, Yong Soo Kwon1, Jong Seong Roh4, Yoosik Yoon5, Soon Shik Shin4, and Heejung Yang1,*
1College of Pharmacy, Kangwon National University, Chuncheon 24341, Korea
2College of Pharmacy, Yonsei Institute of Pharmaceutical Science, Yonsei University, Incheon 21983, Korea
3Department of Pharmacology, School of Medicine, Institute of Health Sciences, Gyeongsang National University, Jinju 52727, Korea
4Department of Formula Sciences, College of Korean Medicine, Dong-Eui University, Busan 47227, Korea
5Department of Microbiology, College of Medicine, Chung-Ang University, Seoul 06974, Korea
Abstract − DF formula is comprised of three traditional herbs, Ephedra intermedia, Rheum palmatum and Lithospermum erythrorhizon, and locally used for treating of the metabolic diseases, such as obesity and diabetes in Korea. We tried to optimize the extraction conditions of two major components, (−)-ephedrine and (+)- pseudoephedrine, in DF formula using response surface methodology with Box-Behnken design (BBD). The experimental conditions with 70% for EtOH concentrations, 4.8 hour for extraction hours and 8.7 times for the solvent to material ratio were suggested for the optimized extraction of DF formula with the highest amounts of (−)-ephedrine and (+)-pseudoephedrine in the designed model.
Keywords − Response surface methodology, Ephedra intermedia, (−)-ephedrine, (+)-pseudoephedrine, HPLC
Introduction
Traditional medicinal herbs have been modernized with the scientific guidelines, such as regulatory guidelines, good-manufacturing-practice guidelines and pharmaco- vigilance guideline.1 Although many medicinal herbs are processed to increase their efficacy or reduce the toxicity with the state-of-art technologies and Westernized scientific scope, the complexity of multiple components existed in a single herb or the herbal combinations still remains the main hurdle for the quality control of the herbal products.
The extraction conditions, such as temperature, extraction time, the types of the extraction solvents, play a role in the proportional changes of the bioactive components in the manufacturing process.2
DF formula is an herbal formulation composed of three medicinal herbs, Ephedra intermedia Schrenk C. A. Meyer, Rheum palmatum Linne, and Lithospermum erythrorhizon Siebold et Zuccarini. It is locally used for the treatment of diabetes, obesity and the metabolic diseases in Korea. E.
intermedia (Ma Huang) which is native to Northern China or Inner Mongolia is one of Ephedra species and its aerial parts are using for the treatment of asthma, bronchial spasms and coughing.3 Its bioactive compounds are adren- ergic alkaloids, such as (−)-ephedrine, (+)-pseudoephedrine, (−)-norephedrine and (+)-norpseudoephedrine, which are pharmacologically sympathomimetic agonists acting on both α- and β-adrenergic receptors.4 Recently, E.
intermedia herb has received considerable attention as the therapeutic agents for the treatment of obesity due to its CNS stimulatory action.5-6 However the overuse of E.
intermedia preparations may give rise to severe adverse effects, such as cardiovascular symptoms, glaucoma and hyperthyroidism.7-8 Thus, products containing of E.
intermedia were rigorously regulated according to the amounts of ephedra alkaloids. R. palmatum (Da Huang) is one of Rheum species and is widely used for the treatment of constipation for a long time in Asian countries. Its cathartic effect is caused by several anthraquinones, such as emodin, chrysophanol, rhein, aloe-emodin, and physcion.9 Also those compounds have been reported to exhibit a wide range of pharmacological effects including of anti- inflammatory, anticancer and antimicrobial activities.
Besides, the improper use of R. palmatum may cause
*Author for correspondence
Heejung Yang, College of Pharmacy, Kangwon National University, Chuncheon 24341, Korea.
Tel: +82-33-250-6919; E-mail: [email protected]
or the manufacturing process for products in the industrial fields.2,13 The polynomial model for the desired experi- mental conditions was fitted by the least squares method obtained through performing of a small number of well- designed experiments. It is an effective statistical method for determining the effects of experimental parameters for the chemical markers or the bioactive components in the manufacturing process for the natural products. In the present study, Box-Behnken design which is three-level incomplete factorial design for RSA was performed for the optimization of extraction parameters including EtOH concentrations, extraction hours and the solvent to material ratio for two active components, (−)-ephedrine and (+)-pseudoephedrine, in DF formula.
Experimental
Chemicals− (−)-ephedrine and (+)-pseudoephedrine were gifted from Dr. Sang Hyun Sung, a professor of College of Pharmacy, Seoul National University. Sodium dodecyl sulfate (SDS) was purchased at Sigma-Aldrich (St. Louis, MO, USA) and HPLC-grade acetonitrile at TEDIA (Fairfield, OH, USA). Water was purified with a Milli-Q system (Nihon Millipore, Tokyo, Japan).
Plant materials− The air-dried plant materials, E.
intermedia (EI, 1 kg), R. palmatum (RP, 1 kg) and L.
erythrorhizon (LE, 1 kg) and DF formula were provided from Dr. Soon Shik Shin, a professor of the Department of Korean medicine, Dong-eui University, identified by Dr. Yong Soo Kwon, a professor of College of Pharmacy, Kangwon National University. Three herbs were deposited in the Herbarium of College of Pharmacy, Kangwon National University (KNUPH-EI-1, KNUPH-RP-1 and KNUPH-LE-1).
Extraction of DF formula− DF formula was prepared with the patented technologies. Briefly, DF formula is a decoction consisting of three traditional medicinal herbs including of E. intermedia (EI), R. palmatum (RP) and L.
Chromatographic conditions− High performance liquid chromatography (HPLC) was carried out on Agilent 1260 Infinity system consisting of 1260 quaternary pump, autosampler and multiple wavelength detector (Agilent Technologies Mfg GmbH&Co.KG, Waldbronn, Germany) and a Hector-M C18 column (250 mm× 4.6 mm i.d.; 5 µm, RStech, Daejeon, Korea), and all chromatograms were measured at 215 nm with the mixtures of HPLC- grade H2O buffered with 25mM sodium dodecyl sulfate (solvent A) and acetonitrile (AcCN solvent B). The gradient elution condition was 60% solvent A (0 - 25 min) and 60 - 40% solvent A (25 - 35 min) and 40% solvent A (35 - 40 min) and 40 - 20% solvent A (40 - 50 min) and 20% solvent A (50 - 60 min) and 20 - 60% solvent A (60 - 60.1 min) and 60% solvent A (60 - 70 min) with the flow rate of 1.0 ml/min. Thus, the calibration curves were followed as y = 11697.7819x + 54.081 (linearity R2= 1) for EP and y = 18703.4036x + 40.7734 (R2= 0.9999) for PSEP.
Software− The response surface methodology was calculated using the Design Expert (Version 7.0.0, Stat- Ease Inc., Minneapolis) statistical software. A second- order polynomial model was used to analyze experi- mental data and regression coefficients as a function of the independent variables. It was fitted in the response surface analysis as following equation (1):
(1)
where β0, βi, βii and βij are the regression coefficients for intercept, linear, quadratic and interaction terms, respectively, and Xi, and Xj are the independent variables.
The software generated the response surfaces and contour plots while holding a variable constant in the second- order polynomial model.
Result and Discussion
Y β0 βiXi
i 1=
∑3 βiiXi 2 i 1=
∑3 βijXiXj j 1=
∑3 i 1=
∑2
+ + +
=
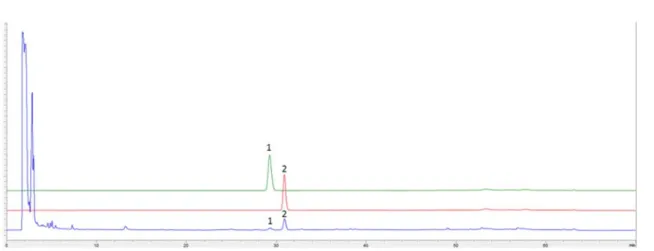
To obtain the optimized extraction condition for DF formula, we firstly tried to determine the HPLC analytical condition for the chemical markers of each herb in DF formula. Because E. intermedia comprised the largest portion from DF formula, (−)-ephedrine (EP) and (+)- pseudoephedrine (PSEP) which are the main bioactive components in E. intermedia were apparently detected, but any components from R. palmatum and L. erythrorhizon
were not (Fig. 1). Thus, we choose EP and PSEP as the chemical markers, which were the main biological components for DF formula due to their thermogenic properties causing the weight loss.14 The HPLC conditions were optimized to obtain higher resolution of two components in DF formula. They are well separated from other components under the gradient solvent condition buffered with 25 mM SDS.15
In the preliminary study, we found that three variables, Fig. 1. HPLC chromatograms of (+)-pseudoephedrine (1), (−)-ephedrine (2) and DF formula. The detailed HPLC conditions described in Experimental section.
Table 1. Experimental design and responses of the dependent variables to extraction conditions
Std ordera Run orderb
Coded variables Independent variables Dependent variables
(responses) X1 X2 X3 EtOH concentration
(%)
Extraction time (hour)
Solvent to material ratio
(ml/g)
EP (mg/g extract)
PSEP (mg/g extract)
1 4 1 1 0 70 6.0 10 37.65 6.55
2 1 -1 -1 0 0 1.0 10 37.00 6.10
3 6 1 0 -1 70 3.5 5 37.05 6.45
4 7 -1 0 1 0 3.5 15 36.45 6.20
5 5 -1 0 -1 0 3.5 5 32.75 5.25
6 10 0 1 -1 35 6.0 5 30.80 5.15
7 16 0 0 0 35 3.5 10 35.15 5.95
8 14 0 0 0 35 3.5 10 35.40 6.05
9 13 0 0 0 35 3.5 10 35.65 6.05
10 9 0 -1 -1 35 1.0 5 32.55 5.40
11 17 0 0 0 35 3.5 10 35.05 5.95
12 3 -1 1 0 0 6.0 10 34.25 5.65
13 8 1 0 1 70 3.5 15 35.90 6.65
14 11 0 -1 1 35 1.0 15 34.10 5.85
15 15 0 0 0 35 3.5 10 35.05 5.90
16 12 0 1 1 35 6.0 15 33.60 5.70
17 2 1 -1 0 70 1.0 10 34.75 6.55
a)Randomized, b)No randomized.
ethanol concentration (X1, %), extraction time (X2, hour) and solvent to material ratio (X3, ml/g), had significantly influenced on the extraction yields of two components.
They were used as the experimental factors for response surface analysis (RSA). Three process variables were applied to the Box-Bekhen design (Table 1). The response variables were the amounts of EP and PSEP.
First, the regression equation of EP in coded units was given in the following equation (2).
EP contents = 35.26 + 0.61X1− 0.26X2+ 0.88X3+ 1.42
X1X2− 1.20X1X3+ 0.30X2X3+ 1.73X12− 1.07X22− 1.44X32
(2)
As shown in Table 2 and Fig. 2., the quadratic of X1
was the largest effect on the amount of EP during the process of the extraction, followed by the quadratic of X3
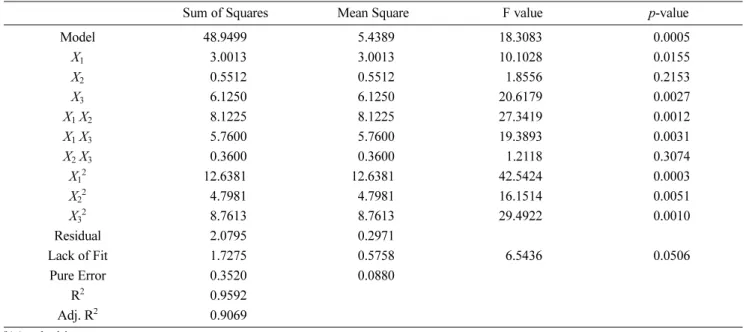
and the interaction effect of X1 and X2. The total determination coefficient, R2= 0.9592, implied that the amount of EP was significantly attributable to three factors (Table 3). Also, the value of “Prob > F” was less
Residual 2.0795 0.2971
Lack of Fit 1.7275 0.5758 6.5436 0.0506
Pure Error 0.3520 0.0880
R2 0.9592
Adj. R2 0.9069
a(−)-ephedrine
Table 3. ANOVA for the response surface quadratic model of PSEPb
Sum of Squares Mean Square F value p-value
Model 3.1033 0.3448 79.7255 < 0.0001
X1 1.0952 1.0952 253.2254 < 0.0001
X2 0.0903 0.0903 20.8815 0.0026
X3 0.5886 0.5886 136.0954 < 0.0001
X1X2 0.0552 0.0552 12.7688 0.0091
X1X3 0.1406 0.1406 32.5145 0.0007
X2 X3 0.0064 0.0064 1.4798 0.2632
X12 0.7252 0.7252 167.6666 < 0.0001
X22 0.1813 0.1813 41.9166 0.0003
X32 0.2792 0.2792 64.5513 < 0.0001
Residual 0.0303 0.0043
Lack of Fit 0.0159 0.0053 1.4699 0.3494
Pure Error 0.0144 0.0036
R2 0.9903
Adj. R2 0.9779
b(+)-pseudoephedrine
than 0.001 indicating the significance of the model. The 3D surface plots easily showed the main and interactive effects of the independent variables on the extraction of
EP. Especially, the ethanol concentration significantly exerted a positive quadric effect on the amount of EP, which were least extracted in about 35% EtOH and Fig. 2. 3D surface plots of the EtOH concentrations versus the extraction hours (a), the EtOH concentrations versus solvent to material ratio (b) and the extraction hours versus solvent to material ratio (c) for the yield of (−)-ephedrine (e), and the EtOH concentrations versus the extraction hours (d), the EtOH concentrations versus solvent to material ratio (e) and the extraction hours versus solvent to material ratio (f) for the yields of (+)-pseudoephedrine.
EP by p value of 0.2153, its yield was changed depending on the extraction time when the ethanol concentration factor was kept at its zero level. The conditions of extraction times and solvent to material ratio generated the contour plot in the designed range. (Fig. 2c) The higher yield of EP was extracted in the medium conditions of the extraction time of about 3.5 hour and a solvent to material ratio of 10 time.
The relationship between the extraction variables and the amount of PSEP was expressed as follows equation (3).
PSEP contents = 5.99 + 0.37X1− 0.11X2+ 0.27X3+0.12X1X2
− 0.19X1X3+ 0.04X2X3+ 0.41X12− 0.21X22− 0.26X23
(3) The three most significant variables influencing on the amount of PSEP were the linear terms of X1 and X3, and the quadratic term of X1 with the higher F values of 253.23, 136.10 and 167.67, respectively (Table 2). Also all their corresponding p values were significant at less than 0.0001. The coefficient of determination (R2) was calculated to be 0.9903 for the amount of PSEP, which meant the model can well predict the amount of PSEP (Table 3). In a 3D surface plot, an EtOH concentration factor showed a linear effect on PSEP. The yield of PSEP was increased up to 70% EtOH which is the highest ratio of ethanol regardless of the extraction time and solvent to material ratio (Fig. 2d and e). The contour plot by the extraction time and solvent to material ratio demonstrated maximum at about 3 hour and 12.5 times, respectively (Fig. 2f).
The optimized extraction conditions to yield the maxi- mum amounts of EP and PSEP were suggested based on the experimental results. The predictable variables with the highest desirability were engaged to verify the predictive capacity of the model (Table 4). With the slight modified extraction conditions (ethanol concentration of 70%, extraction time 4.8h, and solvent to material ratio 8.7:1).
mg/g extract in the experimental values, respectively, which indicated the modified conditions were adequate for extraction.
The Box-Behnken design was successfully employed to determine the optimum extraction conditions for yielding the maximum contents of EP and PSEP which the major components of DF formula. ANOVA analyses revealed that the EtOH concentrations, followed by the solvent to material ratio (X3, ml/g) and the extraction hours (X2, hour), showed the most significant factor on the yields of EP and PSEP. The experimental values generated by the optimized extraction parameters were well consistent with the predicted values. These results showed the extraction conditions optimized in the study can be useful to enhance the efficacy of a large-scale extraction system for the manufacturing of DF formula.
Acknowledgments
This research was supported by a grant of the Korea Health Technology R&D Project through the Korea Health Industry Development Institute (KHIDI), funded by the Ministry of Health & Welfare, Republic of Korea (No.
HI15C0075) and by the 2014 Research Grant from Kangwon National University (No. 120140653).
References
(1) Uzuner, H.; Bauer, R.; Fan, T. P.; Guo, D. A.; Dias, A.; El-Nezami, H.; Efferth, T.; Williamson, E. M.; Heinrich, M.; Robinson, N.; Hylands, P. J.; Hendry, B. M.; Cheng, Y. C.; Xu, Q. J. Ethnopharmacol. 2012, 140, 458-468.
(2) Ferreira, S. L.; Bruns, R. E.; da Silva, E. G.; Dos Santos, W. N.;
Quintella, C. M.; David, J. M.; de Andrade, J. B.; Breitkreitz, M. C.;
Jardim, I. C.; Neto, B. B. J. Chromatogr. A 2007, 1158, 2-14.
(3) Roman, M. C. J. AOAC Int. 2004, 87, 1-14.
(4) Ma, G.; Bavadekar, S. A.; Davis, Y. M.; Lalchandani, S. G.;
Nagmani, R.; Schaneberg, B. T.; Khan, I. A.; Feller, D. R. J. Pharmacol.
Exp. Ther. 2007, 322, 214-221.
(5) Fleming, R. M. Expert Opin. Drug Saf. 2008, 7, 749-759.
(6) Stohs, S. J.; Badmaev, V. Phytother. Res. 2016, 30, 732-740.
(7) Pittler, M. H.; Schmidt, K.; Ernst, E. Obes. Rev. 2005, 6, 93-111.
(8) Stohs, S. J. Plast. Reconstr. Surg. 2013, 132, 876e-877e.
(9) Aichner, D.; Ganzera, M. Talanta 2015, 144, 1239-1244.
(10) Wang, H.; Song, H.; Yue, J.; Li, J.; Hou, Y. B.; Deng, J. L.
Cochrane Database Syst. Rev. 2012, CD008000.
(11) Papageorgiou, V. P.; Assimopoulou, A. N.; Ballis, A. C. Curr. Med.
Chem. 2008, 15, 3248-3267.
(12) Hu, Y.; Jiang, Z.; Leung, K. S.; Zhao, Z. Anal. Chim. Acta 2006, 577, 26-31.
(13) Aslan, N; Cebeci, Y. Fuel 2007, 86, 90-97.
(14) Schaneberg, B. T.; Crockett, S.; Bedir, E.; Khan, I. A. Phytochemistry 2003, 62, 911-918.
(15) Ichikawa, M.; Udayama, M.; Imamura, K.; Shiraishi, S.; Matsuura, H. Chem. Pharm. Bull. 2003, 51, 635-639.
Received August 3, 2016 Revised October 5, 2016 Accepted October 6, 2016