http://e-nrp.org
An association of urinary sodium-potassium ratio with insulin resistance among Korean adults
Yeong Mi Park
1, Chang Keun Kwock
2, Seyeon Park
3, Heather A. Eicher-Miller
4and Yoon Jung Yang
1,4§1Department of Foods and Nutrition, Dongduk Women’s University, 60, Hwarang-ro 13-gil, Seongbuk-gu, Seoul 02748, Korea
2Nutrition and Diet Research Group, Korea Food Research Institute, Jeonbuk 55365, Korea
3Department of Applied Chemistry, Dongduk Women’s University, Seoul 02748, Korea
4Department of Nutrition Science, Purdue University, 700 W. State Street, West Lafayette, IN 47907, USA
BACKGROUND/OBJECTIVES: This study was conducted to investigate the effects of sodium-potassium ratio on insulin resistance and sensitivity in Korean adults.
SUBJECTS/METHODS: Subjects were 3,722 adults (1,632 men and 2,090 women) aged 40-69 years participating in the Korean genome and epidemiology study_Ansan and Ansung study. Insulin resistance was assessed using homeostasis model assessment of insulin resistance (HoMA-IR) and fasting insulin, and insulin sensitivity was assessed by using the quantitative insulin sensitivity check index (QUICKI). The 24-h urinary sodium and potassium excretion were estimated from spot urinary samples using the Tanaka formula. The generalized linear model was applied to determine the association between urinary sodium-potassium ratio and insulin resistance.
RESULTS: HoMA-IR (P-value = 0.029, P-trend = 0.008) and fasting insulin (P-value = 0.017, P-trend = 0.005) levels were positively associated with 24-h estimated urinary sodium-potassium ratio in the multivariable model. QUICKI was inversely associated with 24-h estimated urinary sodium-potassium ratio in all models (P-value = 0.0002, P-trend < 0.0001 in the multivariate model).
CONCLUSION: The present study suggests that high sodium-potassium ratio is related to high insulin resistance and low insulin sensitivity. Decreasing sodium intake and increasing potassium intake are important for maintaining insulin sensitivity. Further studies are needed to confirm these findings in longitudinal studies.
Nutrition Research and Practice 2018;12(5):443-448; https://doi.org/10.4162/nrp.2018.12.5.443; pISSN 1976-1457 eISSN 2005-6168
Keywords: Sodium, potassium, insulin resistance, insulin sensitivity
INTRODUCTION
10)According to the annual report of the causes of death statistics in Korea, 116.9 per 1,000 Korean people (110.8 in men, 123 people in women) died from cardiovascular diseases (CVD) in 2015; the death rate was higher among elderly population aged more than 70 years [1]. High insulin resistance was related to high risk of CVD according to several studies [2-5]. Thus, a decrease in insulin resistance may provide health benefits.
Several studies suggest that high sodium diet [6-9] and low potassium diet [9,10] are positively associated with insulin resistance, while others show an inverse association between sodium diet and insulin resistance [11-14] or provide no evidence of these associations [15,16]. In addition, according to the 2015 Korea National Health and Nutrition Examination Survey, Koreans had a higher sodium intake (327% in men, 228% in women) and lower potassium intake (96% in men, 78% women) compared with the Adequate Intake of dietary sodium and potassium [17].
Thus, determination of the effects of sodium and potassium on insulin resistance among Korean is a pressing issue with
relevance to the health of the Korean population.
Sodium-potassium ratio is a more sensitive indicator than individual sodium and potassium levels to affect blood pressure [18], but there is no study that examines the association between sodium-potassium ratio and insulin resistance to our knowledge.
Furthermore, urinary sodium and potassium are more closely related to real digested sodium and potassium in the body compared to the self-reported dietary sodium and potassium intakes provided through dietary assessment of participants [19]. Therefore, the present study was conducted to elucidate how 24-h estimated urinary sodium-potassium ratio relates to insulin resistance or insulin sensitivity among Korean adults.
SUBJECTS AND METHODS
Study populationThe Korean genome and epidemiology study (KoGES)_Ansan and Ansung study is one of the population-based cohorts in the KoGES, developed to investigate the genetic etiology and epidemiology of complex diseases (i.e., hypertension, obesity,
This research was funded by the Korea Food Research Institute (E0150308-04), and provided with bioresources from National Biobank of Korea, the Centers for Disease Control and Prevention, Republic of Korea.
§Corresponding Author: Yoon Jung Yang, Tel. 82-2-940-4465, Fax. 82-2-940-4193, Email. [email protected] Received: April 2, 2018, Revised: July 5, 2018, Accepted: September 20, 2018
This is an Open Access article distributed under the terms of the Creative Commons Attribution Non-Commercial License (http://creativecommons.org/licenses/by-nc/3.0/) which permits unrestricted non-commercial use, distribution, and reproduction in any medium, provided the original work is properly cited.
n 3,772 Age (yrs)
40-49 1,994 (53.6)1)
50-59 937 (25.2) 60-69 791 (21.2) Sex
Men 2,090 (56.2)
Women 1,632 (43.8)
Smoking status
Non-smokers 2,262 (62.2)
Past smokers 404 (11.1)
Current smokers 969 (26.7)
Alcohol consumption
Non-drinkers 1,813 (49.5)
Past drinkers 218 (6.0)
Current drinkers 1,630 (44.5)
Regular exercise
Yes 1,498 (43.1)
No 1,979 (56.9)
Education status
≤ Elementary school graduated 1,268 (34.5)
Middle school graduated 887 (24.1)
High school graduated 1,108 (30.1)
+ College graduated 417 (11.3)
Household income
> 2 KRW/month 2,492 (69.0)
+ 2 KRW/month 1,117 (31.0)
Recruited area
Ansan city 1,802 (48.4)
Ansung city 1,920 (51.6)
Body mass index (kg/m2) 24.3 ± 3.22)
Daily energy intake (kcal/day) 2,046.9 ± 815.3
24HUNa (mEq/day) 163.9 ± 36.4
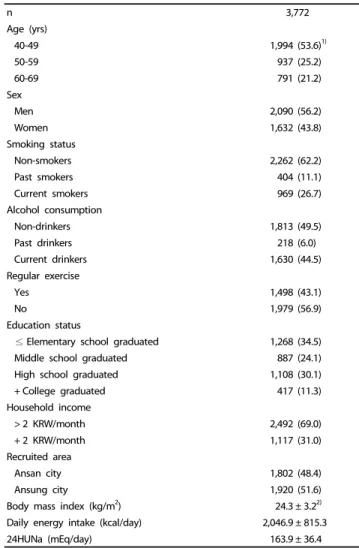
Table 1. General characteristics of the study participants
metabolic syndrome, and cancer) and causes of death with long-term follow-up among the Korea population in 2001.
Detailed explanation of this cohort is reported in a previous study [20]. The base-line data collected in 2001-2002 was used for the present study. The KoGES_Ansan and Ansung study included 10,030 participants (5,012 from Ansan city and 5,018 from Ansung city) at the base-line. A total of 3,722 participants aged 40-69 years were included in this study after excluding participants who had not provided urine samples (n = 5,054);
were treated with steroids (n = 20); had a history of hypertension (n = 757); were diagnosed with diabetes (n = 193), myocardial infarction (n = 26), congestive heart failure (n = 6), coronary artery disease (n = 21), peripheral vascular disease (n = 12), cerebro- vascular disease (n = 22), kidney disease (n = 108), or cancer (n
= 75); and had no documented records of fasting insulin and fasting glucose (n = 14). Written informed consent was obtained from all study participants, and this study was approved by the electronic institutional review board (e-IRB) of the Korea national institute for bioethics policy (KoNIBP) (P01-201603-21-006).
Measurement
Data regarding socio-demographic status, life-style, and medical history were collected by trained interviewers through questio- nnaires. These included age, sex, recruitment area, education status, monthly household income, occupation, marital status, alcohol consumption, cigarette smoking, and presence of diseases (hypertension, diabetes, CVD, kidney disease, and cancer). The daily energy intake was estimated using a food frequency questionnaire (FFQ) including 103 items, which was developed [21] and validated [22] for the KoGES. Height (cm) was measured using a stadiometer. Body mass index (BMI, kg/m
2) was calculated by dividing weight (kg) by height in meters squared.
Urinary samples were self-collected by the participants themselves after more than 8 h of fasting, and were transported in conical centrifuge tubes for quantification by biochemical assays in the central laboratory (Seoul Clinical Laboratories, Seoul, Republic of Korea). Similar to our previous study [23], the current study calculated the 24-h estimated sodium and potassium levels, reflecting the actual ingested sodium and potassium in the body [19]. Tanaka equation was formulated in Japan to estimate the 24-h urinary sodium and potassium levels [24] and used to estimate the 24-h urinary sodium and potassium levels using spot urinary samples as in other studies [25-27].
The homeostatic model assessment of insulin resistance (HoMA-IR) and fasting circulating insulin levels were used as indices of insulin resistance and the quantitative insulin sensitivity check index (QUICKI) was used as index of insulin sensitivity. The HoMA-IR and QUIKI were obtained using fasting insulin and fasting glucose levels as shown in the equations below.
HoMA-IR = fasting insulin (mU/L) × fasting glucose (mg/dL) ÷ 405 [28].
QUICKI = 1 / {[log fasting insulin (uIU/mL)] + [log fasting glucose (μIU/mL)]} [29].
Statistical analysis
The study participants were divided into quartile groups
according to the 24-h estimated urinary excretion. The general linear model for continuous variables and the Cochran-Mantel- Haenszel test for categorical variables were used to describe the general characteristics of participants after adjustment for age and sex and to determine the potential confounding factors. Subjects’ age, BMI, daily energy intake (kcal), sex, cigarette smoking status, alcohol consumption status, regular exercise status, and household income were adjusted in the multivariable models. The least square means and standard errors of insulin resistance indices according to urinary factors were calculated using the general linear model. When statistically significant effects were demonstrated, Tukey’s post hoc comparison test was used to identify group differences. The results were considered statistically significant if the P-value < 0.05 in this study. All statistical analyses were conducted using SAS version 9.4 (SAS Institute, Inc., Cary, North Carolina).
RESULTS
General characteristics
Table 1 shows the general characteristics of the study
participants. Among the total subjects, 53.6% were in their 40s
and 56.2% were male. The means of 24HUNa, 24HUK, and
24HUK (mEq/day) 43.5 ± 10.3
24HUNa-K ratio 3.9 ± 0.8
Fasting glucose (mg/dL) 83.0 ± 14.3
Fasting insulin (μIU/mL) 7.8 ± 5.7
HoMA-IR 1.61 ± 1.24
QUICKI 0.164 ± 0.031
24HUNa, 24-h estimated urinary sodium; 24HUK, 24-h estimated urinary potassium;
24HUNa-K ratio, 24-h urinary sodium-potassium ratio; HoMA-IR, homeostasis model assessment of insulin resistance; QUICKI, quantitative insulin sensitivity check index; KRW, Korean Won.
1)n (%)
2)Mean ± SD Table 1. continued
24HUNa-K ratio
P-value1) P-trend1)
Q1 (n = 930) Q2 (n = 931) Q3 (n = 931) Q4 (n = 930)
24HUNa (mEq/day) 3,003.7 ± 1,389.62) 3,129.4 ± 1,831.9 3,174.4 ± 1,382.0 3,292.1 ± 1,451.0
24HUK (mEq/day) 2,455.9 ± 684.5 2,474.4 ± 676.0 2,513.5 ± 731.8 2,536.8 ± 823.2
24HUNa-K ratio 1.26 ± 0.45 1.26 ± 0.44 1.28 ± 0.44 1.28 ± 0.42
Age (yrs)3) 52.8 ± 0.3c,4) 51.6 ± 0.3b 51.3 ± 0.3ab 50.3 ± 0.3a < 0.0001 0.0005
Body mass index (kg/m2)5) 24.2 ± 0.1 24.4 ± 0.1 24.2 ± 0.1 24.2 ± 0.1 0.445 0.376
Fasting glucose (mg/dL)5) 82.5 ± 0.5 82.5 ± 0.5 83.4 ± 0.5 84.1 ± 0.5 0.055 0.021
Fasting insulin (μIU/mL)5) 7.6 ± 0.2 7.8 ± 0.2 7.7 ± 0.2 7.7 ± 0.2 0.770 0.709
HoMA-IR5) 1.57 ± 0.04 1.62 ± 0.04 1.61 ± 0.04 1.60 ± 0.04 0.766 0.755
QUICKI5) 0.166 ± 0.001b 0.163 ± 0.001ab 0.162 ± 0.001a 0.163 ± 0.001ab 0.028 0.713
Energy intake (kcal/day)5) 2,152.4 ± 27.6b 2,051.0 ± 27.7ab 2,025.0 ± 27.4a 1,999.4 ± 27.2a 0.0005 0.161
Sex, women (%)6) 525 (56.8)7) 541 (58.1) 551 (59.3) 473 (50.7) 0.001 0.019
Smoking, current (%)8) 264 (29.2) 240 (27.7) 216 (25.1) 249 (24.7) 0.018 0.002
Alcohol consumption, current (%)8) 405 (44.9) 393 (43.7) 383 (43.0) 449 (46.1) 0.417 0.641
Regular exercise, yes (%)8) 556 (64.7) 521 (59.7) 462 (52.8) 440 (51.1) < 0.0001 < 0.0001
Area, Ansan (%)8) 245 (28.4) 417 (44.7) 587 (62.1) 674 (70.6) < 0.0001 < 0.0001
Income, ≥ 2M KRW (%)8) 205 (24.1) 257 (29.0) 312 (34.2) 343 (35.0) < 0.0001 < 0.0001
Q, quartile; 24HUNa-K Ratio, 24-hour urinary sodium-potassium ratio; 24HUNa, 24-hour urinary sodium; 24HUK, 24-hour urinary potassium; HoMA-IR, homeostasis model assessment of insulin resistance; QUICKI, quantitative insulin sensitivity check index; KRW, Korean Won.
1)P-value and P-trend were calculated by applying general linear model for continuous variables and Cochran-Mantel-Haenszel test for categorical variables.
2)Mean ± SD
3)Adjusted for sex (men, women)
4)Lsmean ± SE for continuous variables. Tukey’s multiple comparison test, P< 0.05
5)Adjusted for age (continuous) and sex (men, women)
6)Adjusted for age (< 50 yrs, + 50 yrs)
7)Percent for categorical variables
8)Adjusted for age (< 50 yrs, + 50 yrs) and sex (men, women)
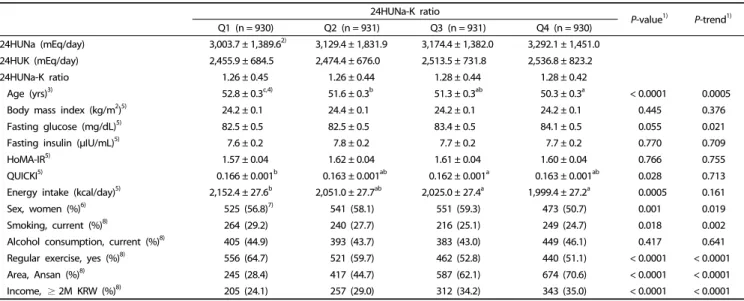
Table 2. General characteristics of the study participants based on 24-h estimated urinary sodium-potassium ratio
24HUNa-K ratio
P-value1) P-trend1)
Q1 (n = 930) Q2 (n = 931) Q3 (n = 931) Q4 (n = 930)
HoMA-IR
Model 12) 1.57 ± 0.043) 1.62 ± 0.04 1.61 ± 0.04 1.60 ± 0.04 0.766 0.586
Model 24) 1.53 ± 0.04a,5) 1.63 ± 0.04ab 1.69 ± 0.04b 1.69 ± 0.04b 0.029 0.008
Fasting insulin (mIU/L)
Model 1 7.56 ± 0.19 7.83 ± 0.19 7.75 ± 0.19 7.72 ± 0.19 0.770 0.647
Model 2 7.33 ± 0.20a 7.85 ± 0.19ab 8.08 ± 0.19b 8.12 ± 0.19b 0.017 0.005
QUICKI
Model 1 0.166 ± 0.001b 0.163 ± 0.001ab 0.162 ± 0.001a 0.163 ± 0.001ab 0.028 0.018
Model 2 0.168 ± 0.001b 0.164 ± 0.001a 0.162 ± 0.001a 0.161 ± 0.001a 0.0002 < 0.0001
Q, quartile; 24HUNa-K Ratio, 24-h urinary Na-K ratio; HoMA-IR, homeostasis model assessment of insulin resistance; QUICKI, quantitative insulin sensitivity check index.
1)P-value and P-trend were calculated by applying general linear model.
2)Adjusted for age (continuous) and sex (men, women)
3)Lsmean ± SE
4)Adjusted for age (continuous), sex (men, women), body mass index (continuous, kg/m2), cigarette smoking status (current smoker, non/past smoker), alcohol consumption status (current drinker, non/past drinker), regular exercise status (yes, no), and recruitment area (Ansan, Ansung)
5)Tukey’s multiple comparison test, P< 0.05
Table 3. Adjusted means and standard errors of HoMA-IR, fasting insulin, and QUICKI according to 24-h estimated urinary sodium-potassium ratio
24HUNa-K ratio were 163.9 mEq/day, 43.5 mEq/day, and 3.9, respectively. Furthermore, the means of fasting glucose, fasting insulin, HoMA-IR, QUICKI were 83.0 mg/dL, 7.8 μIU/mL, 1.61, and 0.164, respectively.
Table 2 lists the characteristics of study participants according
to 24-h estimated urinary sodium-potassium ratio. The higher
the 24HUNa-K ratio, the lower the age, proportion of women,
percentage of current smokers, and percentage of people
regularly exercising. On the other hand, the higher the
24HUNa-K ratio, the higher fasting glocose, Ansan residents, and
proportion of high income.
Associations between urinary sodium-potassium ratio and insulin resistance
Table 3 shows adjusted means and standard error of HoMA-IR, fasting insulin, and QUICKI according to 24-h estimated urinary excretion of sodium-potassium ratio. Significantly positive correlation of 24HUNa-K ratio with HoMA-IR (P-value = 0.029,
P-trend = 0.008) and fasting insulin (P-value = 0.017, P-trend =0.005) is shown in Model 2. QUICKI was inversely associated with 24HUNa-K ratio in all models (P-value = 0.0002, P-trend
< 0.0001 in Model 2).
DISCUSSION
This study was conducted to identify the effects of 24-h estimated urinary sodium-potassium ratio on insulin resistance or sensitivity among Korean adults. Our results suggest that the urinary sodium-potassium ratio was positively associated with insulin resistance and negatively related to insulin sensitivity.
Since there are no studies examining the effect of sodium- potassium ratio on insulin resistance or insulin sensitivity, previous studies examined the effects of sodium or potassium on insulin resistance or insulin sensitivity, respectively. Several studies reported a positive association of high-sodium diet [6-9] or low-potassium diet [10-11] with insulin resistance that cohere with these results. Sodium intake estimated by the urinary sodium to urinary creatinine ratio was positively associated with insulin resistance among Korean children or adolescents [30,31].
Ames RP et al. [6] investigated the effect of modest sodium restriction on insulin resistance during 4 weeks in a cross-over design, and suggested that sodium restriction was associated with reduced insulin resistance. Kuroda S et al. [7] conducted a clinical trial to examine the causal effect of sodium sensitivity on insulin resistance with hypertension over 7 days, and found that a low-salt diet decreased insulin resistance. Dziwura et al.
[8] conducted a cohort study to determine the relationship between salt sensitivity and insulin resistance. The groups of treatment were divided into amount of salt as low-, normal-, and high-salt. Results indicated that, participants of the high salt group had an increased HoMA-IR. Wan Z et al. [9] conducted a clinical trial to examine the effects of sodium and potassium on insulin resistance during 7 days, and found that a high salt diet was positively associated with insulin resistance and potassium supplements inversely associated with insulin resistance. Chatterjee R et al. [10] piloted a double-blinded randomized controlled trial to compare the effects of potassium supplements (40 mEq K/d) with matching placebo during 3 months, and found a significant trend for improved insulin sensitivity among the potassium-treated group. On the other hand, no associations between sodium and insulin resistance [15,16] and negative associations between sodium and insulin resistance [11-14] were reported by several studies.
Although there are no studies that provide a direct mecha- nism to explain the effects of sodium-potassium ratio on insulin resistance in the body, hypothetic mechanisms have been proposed for the influence of sodium and potassium intakes on insulin resistance. First, the low-sodium diet decrease blood leptin levels leading to reduced size of abdominal fat cells, which diminishes the risk of obesity and insulin resistance [32-34].
Second, the low-sodium intake regulates the expression of glucose transporter type-4 as the insulin receptor in fat cells, which might be associated with decreased insulin resistance [35]. Third, pancreatic beta-cell K(ATP) channels play a central role in glucose mediated insulin secretion. ATP sensitive potassium [K(ATP)] channels founded in the plasma membrane of many cells including pancreatic beta-cells, skeletal muscle, and brain may modulate glucose transport in the insulin target tissue [36].
There are several considerations in interpreting the results.
First, because the current study is a cross-sectional design, the causal effect of sodium-potassium ratio on insulin resistance or sensitivity was not identified in this study. Second, we used spot urinary samples collected in specific point in time instead of 24-h urinary samples collected during a day (24 hours) reflecting higher levels of the actual metabolic indicator [19]. Twenty- four-hour urinary samples are generally difficult to use in population-based studies such as the present study because of cost for time and money. Furthermore, the 24-h estimates of urinary sodium and potassium levels, and their ratio are more appropriate than the dietary sodium, potassium, and sodium- potassium ratio obtained by FFQ.
There are two advantages in the present study. First, partici- pants with a history of cardiovascular disease, kidney disease, or cancer were excluded from this study, because these diseases influence diet and lifestyle patterns of patients. Second, we used various parameters including HoMA-IR, fasting insulin, and QUICKI as markers of insulin metabolism, which were validated and frequently used to quantify insulin resistance or sensitivity.
In conclusion, we found that sodium-potassium ratios were positively associated with insulin resistance and inversely associated with insulin sensitivity among Korean adults. In order to decrease insulin resistance, a low sodium intake and a high potassium intake are recommended. Potassium is consumed via fruits and vegetables. Therefore, low-sodium intake should accompany high consumption of fruits and vegetables. Since the present study was a cross-sectional study, further studies are needed to corroborate these findings in clinical trials or prospective studies.
ACKNOWLEDGMENTS
This research was funded by the Korea Food Research Institute (E0150308-04), and provided with bioresources from National Biobank of Korea, the Centers for Disease Control and Prevention, Republic of Korea. This study was carried out by Dongduk Women's University Research Year Support.
CONFLICT OF INTEREST
The authors declare no potential conflicts of interests.
ORCID
Yeong Mi Park: https://orcid.org/0000-0003-4156-7356
Chang Keun Kwock: https://orcid.org/0000-0003-3631-7600
Seyeon Park: https://orcid.org/0000-0002-2471-3174
Heather A. Eicher-Miller: https://orcid.org/0000-0002-1261-4291
Yoon Jung Yang: https://orcid.org/0000-0001-9395-0854
REFERENCES
1. Statistics Korea. Annual Report on the Causes of Death Statistics.
Daejeon: Statistics Korea; 2016.
2. Ginsberg HN. Insulin resistance and cardiovascular disease. J Clin Invest 2000;106:453-8.
3. Reaven GM. Insulin resistance, the insulin resistance syndrome, and cardiovascular disease. Panminerva Med 2005;47:201-10.
4. Paneni F, Costantino S, Cosentino F. Insulin resistance, diabetes, and cardiovascular risk. Curr Atheroscler Rep 2014;16:419.
5. Patel TP, Rawal K, Bagchi AK, Akolkar G, Bernardes N, Dias DS, Gupta S, Singal PK. Insulin resistance: an additional risk factor in the pathogenesis of cardiovascular disease in type 2 diabetes. Heart Fail Rev 2016;21:11-23.
6. Ames RP. The effect of sodium supplementation on glucose tolerance and insulin concentrations in patients with hypertension and diabetes mellitus. Am J Hypertens 2001;14:653-9.
7. Kuroda S, Uzu T, Fujii T, Nishimura M, Nakamura S, Inenaga T, Kimura G. Role of insulin resistance in the genesis of sodium sensitivity in essential hypertension. J Hum Hypertens 1999;13:257-62.
8. Dziwura J, Bińczak-Kuleta A, Miazgowski T, Ziemak J, Widecka K.
The associations between G972R polymorphism of the IRS-1 gene, insulin resistance, salt sensitivity and non-dipper hypertension.
Hypertens Res 2011;34:1082-6.
9. Wan Z, Wen W, Ren K, Zhou D, Liu J, Wu Y, Zhou J, Mu J, Yuan Z. Involvement of NLRP3 inflammasome in the impacts of sodium and potassium on insulin resistance in normotensive Asians. Br J Nutr 2018;119:228-37.
10. Chatterjee R, Slentz C, Davenport CA, Johnson J, Lin PH, Muehlbauer M, D'Alessio D, Svetkey LP, Edelman D. Effects of potassium supplements on glucose metabolism in African Americans with prediabetes: a pilot trial. Am J Clin Nutr 2017;106:1431-8.
11. Townsend RR, Kapoor S, McFadden CB. Salt intake and insulin sensitivity in healthy human volunteers. Clin Sci (Lond) 2007;113:
141-8.
12. Raji A, Williams GH, Jeunemaitre X, Hopkins PN, Hunt SC, Hollenberg NK, Seely EW. Insulin resistance in hypertensives: effect of salt sensitivity, renin status and sodium intake. J Hypertens 2001;19:
99-105.
13. Nakandakare ER, Charf AM, Santos FC, Nunes VS, Ortega K, Lottenberg AM, Mion D Jr, Nakano T, Nakajima K, D'Amico EA, Catanozi S, Passarelli M, Quintão EC. Dietary salt restriction increases plasma lipoprotein and inflammatory marker concentrations in hypertensive patients. Atherosclerosis 2008;200:410-6.
14. Garg R, Williams GH, Hurwitz S, Brown NJ, Hopkins PN, Adler GK.
Low-salt diet increases insulin resistance in healthy subjects.
Metabolism 2011;60:965-8.
15. Meland E, Laerum E, Aakvaag A, Ulvik RJ, Høstmark AT. Salt restriction: effects on lipids and insulin production in hypertensive patients. Scand J Clin Lab Invest 1997;57:501-5.
16. Foo M, Denver AE, Coppack SW, Yudkin JS. Effect of salt-loading on blood pressure, insulin sensitivity and limb blood flow in normal subjects. Clin Sci (Lond) 1998;95:157-64.
17. Ministry of Health and Welfare (KR). Korea Health Statistics 2014:
Korea National Health and Nutrition Examination Survey (KNHANES VI-2). Cheongju: Korea Centers for Disease Control and Prevention;
2015.
18. Iwahori T, Miura K, Ueshima H. Time to consider use of the
sodium-to-potassium ratio for practical sodium reduction and potassium increase. Nutrients 2017;9:700.
19. McLean RM. Measuring population sodium intake: a review of methods. Nutrients 2014;6:4651-62.
20. Kim Y, Han BG; KoGES group. Cohort profile: the Korean Genome and Epidemiology Study (KoGES) consortium. Int J Epidemiol 2017;46:1350.
21. Kim J, Kim Y, Ahn YO, Paik HY, Ahn Y, Tokudome Y, Hamajima N, Inoue M, Tajima K. Development of a food frequency questionnaire in Koreans. Asia Pac J Clin Nutr 2003;12:243-50.
22. Ahn Y, Kwon E, Shim JE, Park MK, Joo Y, Kimm K, Park C, Kim DH.
Validation and reproducibility of food frequency questionnaire for Korean genome epidemiologic study. Eur J Clin Nutr 2007;61:1435-41.
23. Park YM, Kwock CK, Kim K, Kim J, Yang YJ. Interaction between single nucleotide polymorphism and urinary sodium, potassium, and sodium-potassium ratio on the risk of hypertension in Korean adults. Nutrients 2017;9:235.
24. Tanaka T, Okamura T, Miura K, Kadowaki T, Ueshima H, Nakagawa H, Hashimoto T. A simple method to estimate populational 24-h urinary sodium and potassium excretion using a casual urine specimen. J Hum Hypertens 2002;16:97-103.
25. O'Donnell M, Mente A, Rangarajan S, McQueen MJ, Wang X, Liu L, Yan H, Lee SF, Mony P, Devanath A, Rosengren A, Lopez-Jaramillo P, Diaz R, Avezum A, Lanas F, Yusoff K, Iqbal R, Ilow R, Mohammadifard N, Gulec S, Yusufali AH, Kruger L, Yusuf R, Chifamba J, Kabali C, Dagenais G, Lear SA, Teo K, Yusuf S; PURE Investigators. Urinary sodium and potassium excretion, mortality, and cardiovascular events. N Engl J Med 2014;371:612-23.
26. O'Donnell MJ, Yusuf S, Mente A, Gao P, Mann JF, Teo K, McQueen M, Sleight P, Sharma AM, Dans A, Probstfield J, Schmieder RE.
Urinary sodium and potassium excretion and risk of cardiovascular events. JAMA 2011;306:2229-38.
27. Khaw KT, Bingham S, Welch A, Luben R, O'Brien E, Wareham N, Day N. Blood pressure and urinary sodium in men and women:
the Norfolk Cohort of the European Prospective Investigation into Cancer (EPIC-Norfolk). Am J Clin Nutr 2004;80:1397-403.
28. Matthews DR, Hosker JP, Rudenski AS, Naylor BA, Treacher DF, Turner RC. Homeostasis model assessment: insulin resistance and beta-cell function from fasting plasma glucose and insulin concentrations in man. Diabetologia 1985;28:412-9.
29. Katz A, Nambi SS, Mather K, Baron AD, Follmann DA, Sullivan G, Quon MJ. Quantitative insulin sensitivity check index: a simple, accurate method for assessing insulin sensitivity in humans. J Clin Endocrinol Metab 2000;85:2402-10.
30. Chun YH, Han K, Kim DH, Park YG, Cho KH, Choi YS, Kim SM, Kim YH, Nam GE. Association of urinary sodium excretion with insulin resistance in Korean adolescents: results from the Korea National Health and Nutrition Examination Survey 2009-2010. Medicine (Baltimore) 2016;95:e3447.
31. Kim YM, Kim SH, Shim YS. Association of sodium intake with insulin resistance in Korean children and adolescents: the Korea National Health and Nutrition Examination Survey 2010. J Pediatr Endocrinol Metab 2018;31:117-25.
32. Fonseca-Alaniz MH, Brito LC, Borges-Silva CN, Takada J, Andreotti S, Lima FB. High dietary sodium intake increases white adipose tissue mass and plasma leptin in rats. Obesity (Silver Spring) 2007;15:2200-8.
33. Lopes KL, Furukawa LN, de Oliveira IB, Dolnikoff MS, Heimann JC.
Perinatal salt restriction: a new pathway to programming adiposity indices in adult female Wistar rats. Life Sci 2008;82:728-32.
34. Fonseca-Alaniz MH, Takada J, Andreotti S, de Campos TB, Campaña AB, Borges-Silva CN, Lima FB. High sodium intake enhances insulin-stimulated glucose uptake in rat epididymal adipose tissue.
Obesity (Silver Spring) 2008;16:1186-92.
35. Hall JE. Control of sodium excretion by angiotensin II: intrarenal mechanisms and blood pressure regulation. Am J Physiol 1986;
250:R960-72.
36. Wasada T. Adenosine triphosphate-sensitive potassium (KATP) channel activity is coupled with insulin resistance in obesity and type 2 diabetes mellitus. Intern Med 2002;41:84-90.