D I A B E T E S & M E T A B O L I S M J O U R N A L
This is an Open Access article distributed under the terms of the Creative Commons At- tribution Non-Commercial License (http://creativecommons.org/licenses/by-nc/3.0/) which permits unrestricted non-commercial use, distribution, and reproduction in any medium, provided the original work is properly cited.
Copyright © 2013 Korean Diabetes Association http://e-dmj.org
The Role of Skeletal Muscle in Development of Nonalcoholic Fatty Liver Disease
Jun Sung Moon*, Ji Sung Yoon*, Kyu Chang Won, Hyoung Woo Lee
Department of Internal Medicine, Yeungnam University College of Medicine, Daegu, Korea
Background: Nonalcoholic fatty liver disease (NAFLD) is closely correlated with abnormal accumulation of visceral fat, but the role of skeletal muscle remains unclear. The aim of this study was to elucidate the role of skeletal muscle in development of NAFLD.
Methods: Among 11,116 subjects (6,242 males), we examined the effects of skeletal muscle mass and visceral fat area (VFA, by bioelectric impedance analysis) on NAFLD using by the fatty liver index (FLI).
Results: Of the total subjects (9,565 total, 5,293 males) included, 1,848 were classified as having NALFD (FLI ≥60). Body mass index, lipid profile, fasting plasma glucose, hemoglobin A1c, prevalence of type 2 diabetes (DM), hypertension (HTN), and met- abolic syndrome were higher in males than females, but FLI showed no significant difference. The low FLI group showed the lowest VFA and highest skeletal muscle mass of all the groups. Skeletal muscle to visceral fat ratio (SVR) and skeletal muscle in- dex had inverse correlations with FLI, when adjusted for age and gender. In multivariate regression analysis, SVR was negatively associated with FLI. Among SVR quartiles, the highest quartile showed very low risk of NAFLD when adjusted for age, gender, lipid profile, DM, HTN, and high sensitivity C-reactive protein from the lowest quartiles (odds ratio, 0.037; 95% confidence in- terval, 0.029 to 0.049).
Conclusion: Skeletal muscle mass was inversely associated with visceral fat area, and higher skeletal muscle mass may have a beneficial effect in preventing NAFLD. These results suggest that further studies are needed to ameliorate or slow the progression of sarcopenia.
Keywords: Fatty liver index; Intra-abdominal fat; Muscle, skeletal; Non-alcoholic fatty liver disease
Corresponding author: Hyoung Woo Lee
Department of Internal Medicine, Yeungnam University College of Medicine1, 70 Hyeonchung-ro, Nam-gu, Daegu 705-717, Korea E-mail: [email protected]
* Jun Sung Moon and Ji Sung Yoon contributed equally to this study as first authors.
Received: Jun. 30, 2013; Accepted: Jul. 22, 2013
INTRODUCTION
Nonalcoholic fatty liver disease (NAFLD), characterized by an abnormal accumulation of fat in hepatocytes, is recognized as the most prevalent chronic liver disease in the general popula- tion [1], and is increasing rapidly in both Western countries and Asian countries such as Korea [2]. NAFLD is well known to be share the common pathophysiological mechanism of in- sulin resistance with obesity, metabolic syndrome, and type 2 diabetes [3]. Regarding insulin resistance, the association be- tween NAFLD and visceral fat is well established [4,5]. Koda et al. [6] suggested that visceral fat, not subcutaneous fat, was the most important factor for the development of hepatic ste-
atosis. In addition, many studies have reported that NAFLD could be a risk factor for atherosclerosis and cardiovascular disease [7]. Thus, it is considered to be not only a simple he- patic disease but also a hepatic manifestation of metabolic syndrome [8].
The fatty liver index (FLI) is a simple parameter for the de- termination of fatty liver, which is easily obtained from body mass index (BMI), waist circumference (WC), triglyceride (TG), and γ-glutamyl transferase (GGT) levels [9]. For high diagnos- tic accuracy in detecting fatty liver, these parameters were re- cently validated in large population studies [10,11]. Moreover, higher FLI scores are correlated with an elevated risk for dia- betes [12], early carotid atherosclerosis [10], coronary artery http://dx.doi.org/10.4093/dmj.2013.37.4.278
pISSN 2233-6079 · eISSN 2233-6087
279
Diabetes Metab J 2013;37:278-285 http://e-dmj.org
disease [13], and all-cause mortality [11].
Skeletal muscle plays an important role in insulin sensitivity as a primary tissue contributing to whole body insulin-medi- ated glucose uptake [14]. Several findings reported that low skeletal muscle mass is associated with obesity, metabolic syn- drome, and dysglycemia [15-17], and the reverse was shown in large populations, with higher muscle mass associated with better insulin resistance and a lower risk of developing diabe- tes [15]. However, little is known about the relationships be- tween visceral fat and the role of skeletal muscle as a risk factor in NAFLD. The aims of this study are: 1) to determine whether visceral fat is related to FLI; 2) to evaluate the relationship be- tween visceral fat and skeletal muscle mass; and 3) to determine whether skeletal muscle affects the development of NAFLD diagnosed by FLI in Korean subjects.
METHODS
Study population
We reviewed medical records of 11,116 subjects (6,242 males, 4,874 females; mean age, 47.2±10.2 [males] and 46.7±10.9 [females] years) who underwent a health examination at the Yeungnam University Health Promotion Center, Daegu, South Korea between January 2009 and December 2011. We exclud- ed 778 patients who had positive serologic viral hepatitis (hep- atitis B surface antigen or anti-hepatitis C virus antibody) and 773 subjects with excessive alcohol consumption (≥20 g/day).
After exclusion, there remained 9,565 subjects (5,293 males, 4,272 females). The criteria for the diagnosis of diabetes rec- ommended by the American Diabetes Association [18] were:
1) hemoglobin A1c (HbA1c) ≥6.5%; and 2) fasting plasma glucose (FPG) ≥126 mg/dL (7.0 mmol/L). Adopting Interna- tional Diabetes Federation (IDF) criteria, metabolic syndrome in South Korean adults was defined by central obesity (waist circumference ≥90 cm for men and ≥85 cm for women) plus two of the following four factors: serum TG ≥150 mg/dL, high density lipoprotein cholesterol (HDL-C) ≤40 mg/dL for men and ≤50 mg/dL for women, systolic blood pressure (SBP) ≥130 mm Hg or diastolic blood pressure (DBP) ≥85 mm Hg, and FPG ≥100 mg/dL [19]. Participants who had antihypertensive medication or were newly diagnosed (SBP ≥140 mm Hg or
DBP ≥90 mm Hg) were classified as hypertension group. All patients gave informed consent, and this in turn was approved by the local ethics committee. The study protocol was approved by the Institutional Review Board of Yeungnam University Hospital (YUH-12-0463-O91).
Clinical and laboratory assays
Blood samples were obtained from each individual after a 12- hour overnight fast. Measurement of FPG, bilirubin, aspartate aminotransferase (AST), alanine aminotransferase (ALT), GGT, blood urea nitrogen, and creatinine used the hexokinase meth- od (AU 5400 Autoanalyser; Olympus, Tokyo, Japan). Total cho- lesterol (TC) was measured using enzyme colorimetry (Kyowa Medex Co., Ltd., Tokyo, Japan), TG was measured using the glycerol elimination method, and HDL-C and low density lipo- protein cholesterol (LDL-C) were measured using direct enzy- matic assays (Kyowa Medex Co., Ltd.). HbA1c and microalbu- minuria assays were performed using the HLC-723G7 high per- formance liquid chromatography system (Tosoh, Tokyo, Japan).
Surrogate marker of fatty liver
For determination of nonalcoholic fatty liver, we used a surro- gate marker, the FLI [9]. The index uses an algorithm based on BMI, WC, serum TG level, and GGT. It has been validated against hepatic ultrasonography (US) in the general popula- tion and has been proven accurate in detecting fatty liver (ac- curacy, 0.84; 95% confidence interval [CI], 0.81 to 0.87) [9,13].
When FLI is greater than or equal to 60 (FLI ≥60), the proba- bility of having a fatty liver is >78%, and if FLI is <20, the like- lihood not to have fatty liver is greater than 91%. A validation of FLI against magnetic resonance spectroscopy demonstrated the presence of hepatic fat (range, 8.6% to 24.0%) in subjects with FLI ≥60 and the absence of hepatic fat in those FLI <20 [13]. Therefore, we categorized our study group into three groups: 1) the low FLI group, FLI <20; 2) the intermediate group, 20≥FLI<60; and 3) the high FLI group, FLI ≥60.
Body composition determined by bioelectric impedance analysis
Waist circumference was measured at the midpoint between the lower border of the rib cage and the iliac crest. We analyzed
FLI group, FLI <20; 2) the intermediate group, 20≥FLI<60; and 3) the high FLI group, FLI
≥ 60.
���� e
0.953× loge�triglycerides� � 0.139×����0.71�× loge�GGT�� 0.053×waist circumference‐15.7451� e
0.953× loge�triglycerides� � 0.139×����0.71�× loge�GGT�� 0.053×waist circumference‐15.745×100
Body composition determined by bioelectric impedance analysis
Waist circumference was measured at the midpoint between the lower border of the rib cage and the iliac crest. We analyzed body composition of all subjects using the Inbody 720 (Biospace, Seoul, Korea), a multifrequency impedance body composition analyzer. The Inbody 720 uses an eight-point tactile electrode method, measuring resistance at five specific frequencies (1, 50, 250, 500 kHz, and 1 MHz) and reactance at three specific frequencies (5, 50, and 250 kHz). We obtained readings for skeletal muscle mass (SMM, kg) and visceral fat area (VFA, cm
2). The SMM to VFA ratio (SVR, g/cm
2) was calculated as a new index of risk factor for fatty liver by dividing the SMM (g) by VFA (cm
2). Skeletal muscle index (SMI) was expressed as percent, dividing the SMM (kg) by total body weight (kg).
Statistical analysis
Quantitative data were expressed as mean±standard deviation, and categorical data were
expressed as percentages. The t-tests were used to compare continuous variables, and a χ
2test
was used for categorical variables. Analysis of variance (ANOVA) tests were performed to
compare continuous variables among FLI groups. Associations between FLI and continuous
variables were evaluated by simple and multiple regression analyses. Correlations (Pearson
correlation coefficient) and multiple linear regression analyses were also performed. All data
analyses were performed using SPSS software for Windows version 14.0 (SPSS Inc.,
280 Diabetes Metab J 2013;37:278-285 http://e-dmj.org body composition of all subjects using the Inbody 720 (Biospace,
Seoul, Korea), a multifrequency impedance body composition analyzer. The Inbody 720 uses an eight-point tactile electrode method, measuring resistance at five specific frequencies (1, 50, 250, 500 kHz, and 1 MHz) and reactance at three specific frequencies (5, 50, and 250 kHz). We obtained readings for skeletal muscle mass (SMM, kg) and visceral fat area (VFA, cm2). The SMM to VFA ratio (SVR, g/cm2) was calculated as a new index of risk factor for fatty liver by dividing the SMM (g) by VFA (cm2). Skeletal muscle index (SMI) was expressed as percent, dividing the SMM (kg) by total body weight (kg).
Statistical analysis
Quantitative data were expressed as mean±standard deviation, and categorical data were expressed as percentages. The t-tests were used to compare continuous variables, and a χ2 test was used for categorical variables. Analysis of variance (ANOVA) tests were performed to compare continuous variables among FLI groups. Associations between FLI and continuous variables were evaluated by simple and multiple regression analyses.
Correlations (Pearson correlation coefficient) and multiple linear regression analyses were also performed. All data analy- ses were performed using SPSS software for Windows version 14.0 (SPSS Inc., Chicago, IL, USA).
RESULTS
The baseline characteristics of the subjects are shown in Sup- plementary Table 1. The mean age of males and females were 47.2 and 46.7 years, respectively. Anthropometric values in- cluding BMI and WC were significantly higher in males than females. While blood pressure (SBP, DPB), FPG, HbA1c, AST, ALT, GGT, TC, TG, LDL-C, and high sensitivity C-reactive protein (hsCRP) were also higher in the male group, FLI was not significantly different between the male and female groups.
The male group showed a higher prevalence of metabolic syn- drome, diabetes, and hypertension than the female group.
Higher VFA and indexes of skeletal muscle (SMI, SVR, and skeletal muscle-to-total body fat ratio) were identified in the male group, but body fat mass was higher in the female group in bioelectrical impedance analysis (BIA).
We examined the anthropometric and clinical parameters using the FLI. Table 1 shows that biochemical parameters such as FPG, HbA1c, AST, ALT, TC, LDL-C, and hsCRP increased in the high FLI group compare with other groups, while biliru-
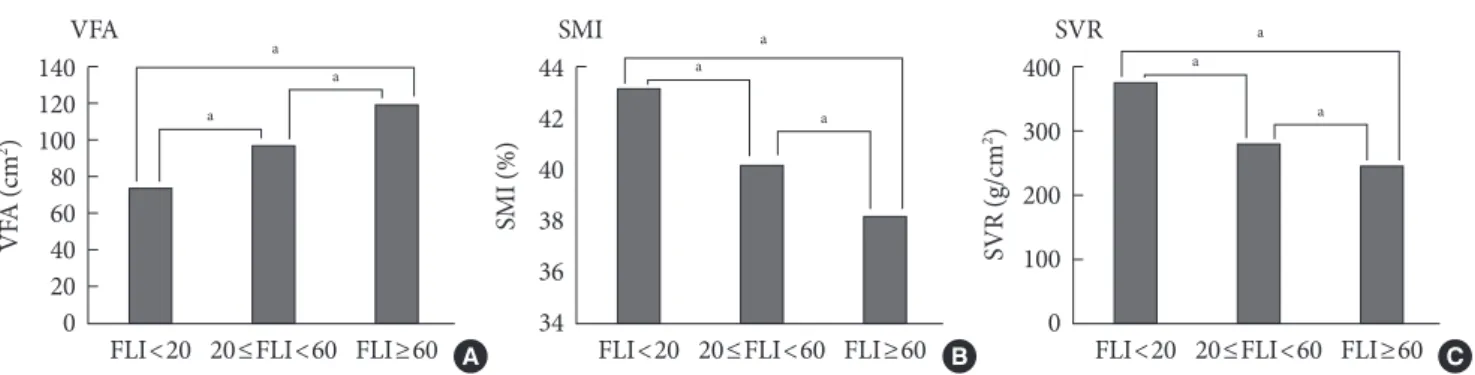
bin and HDL-C decreased. Compared with the low FLI group (FLI <20) by ANOVA, increased VFA and decreased SMI and SVR were observed in both the high FLI group (FLI ≥60) and the intermediated group (20≤FL<60). There was also an in- Table 1. Comparison of baseline characteristics among cate- gorized groups by fatty liver index cutoff
Characteristic
Fatty liver index
<20
(n=2,821) 20-59
(n=4,896) ≥60 (n=1,848) Sex, M:Fa 1,641:1,180 2,600:2,296 1,052:796
Age, yra 43.7±10.6 48.0±10.1 49.5±10.3
BMI, kg/m2 a 21.4±2.1 24.2±2.1 27.2±2.5
WC, cma 74.0±6.2 81.3±6.2 89.4±6.4
Fatty liver indexa 11.9±4.8 37.4±11.3 73.8±9.4 Waist-hip ratioa 0.4±0.0 0.4±0.1 0.5±0.1 SBP, mm Hga 112.5±12.1 117.8±13.2 123.8±13.5
DBP, mm Hga 72.3±9.1 75.9±9.8 80.2±9.6
FPG , mmol/La 4.9±0.7 5.2±1.2 5.6±1.4
HbA1c, %a 5.4±0.5 5.7±0.8 5.9±0.9
AST, IU/La 22.2±8.3 24.5±10.1 30.1±14.9
ALT, IU/La 19.0±10.3 25.1±15.5 37.0±23.3 GGT , IU/La 20.7±13.2 32.5±28.3 63.0±72.2 T-bil, µmol/La 17.6±6.6 16.5±6.0 15.5±5.6
D-bil, µmol/La 5.4±2.1 4.9±1.9 4.7±2.0
BUN, mmol/La 4.4±1.2 4.5±1.2 4.6±1.2
Cre, µmol/L 77.6±16.1 77.6±16.3 78.5±17.1
hsCRP, mg/dLa 0.1±0.3 0.1±0.3 0.2±0.4
TC, mmol/La 4.7±0.8 5.1±0.9 5.5±1.0
TG, mmol/La 0.8±0.4 1.4±0.7 2.5±1.4
HDL-C, mmol/La 1.6±0.4 1.4±0.6 1.2±0.3
LDL-C, mmol/La 107.4±28.3 119.8±31.7 119.4±37.2 SVR, g/cm2 a 376.1±143.9 280.7±75.2 245.6±79.5 VFA, cm2 a 73.7±22.2 97.2±19.9 119.5±19.8
SMI, %a 43.2±3.9 40.2±4.0 38.2±4.4
Data are presented as the mean±standard deviation.
M, male; F, female; BMI, body mass index; WC, waist circumference;
SBP, systolic blood pressure; DBP, diastolic blood pressure; FPG, fast- ing plasma glucose; HbA1c, hemoglobin A1c; AST, aspartate amino- transferase; ALT, alanine aminotransferase; GGT, γ-glutamyl trans- ferase; T-bil, total bilirubin; D-bil, direct bilirubin; BUN, blood urea nitrogen; Cre, creatinine; hsCRP, high sensitivity C-reactive protein;
TC, total cholesterol; TG, triglyceride; HDL-C, high density lipopro- tein cholesterol; LDL-C, low density lipoprotein cholesterol; SVR, skeletal muscle mass to visceral fat area ratio; VFA, visceral fat area;
SMI, skeletal muscle index.
aP<0.001, for trend in analysis of variance analysis.
verse correlation between SMM and VFA in the low FLI group (Fig. 1).
The correlations between several metabolic parameters in- cluding FLI and indexes of body composition, such as SMI, SVR, and VFA, are shown in Table 2. Adjusted for age and gender, SMI and SVR correlated negatively with BMI (r=-0.60, r=-0.43, respectively) and FLI (r=-0.56, r=-0.41, respective- ly), while VFA had a strong positive correlation with FLI (r=
0.73).
In simple linear regression analysis (Supplementary Table 2), SVR (males, B=-0.076, β=-0.347; females, B=-0.114, β=
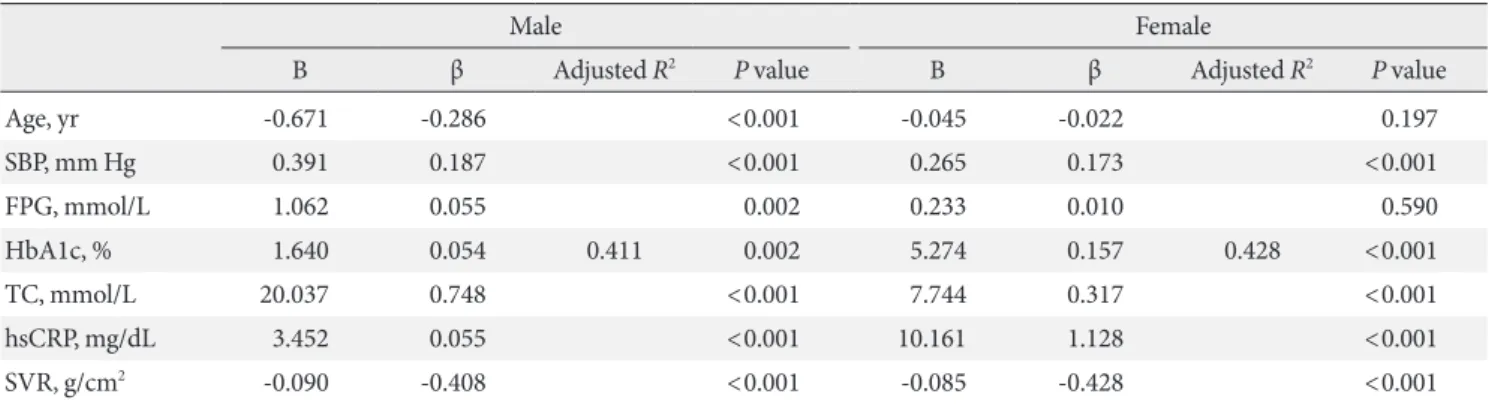
-0.569) was shown to significantly affect FLI as a negative fac- tor in both genders. Table 3 shows that in multiple regression analysis, a similar result was obtained, indicating that SVR was an independent factor in FLI and had an inverse correlation (males, B=-0.090, β=-0.408; females, B=-0.085, β=-0.428).
Table 4 displays the odds ratio between NAFLD and SVR.
For evaluation of SVR impact on fatty liver, we determined FLD as FLI above 60 and then examined the odds ratio by multiple logistic regression analysis. Among the quartiles, the highest SVR quartile (Q4) had a lower incidence of NAFLD and the odds was 0.038 (95% CI, 0.030 to 0.048) after adjustment for age and gender. In addition, after adjusting for lipid profile, di- abetes, hypertension, and hsCRP, we determined that higher quartiles from the lowest quartile group showed a significantly lower odds ratio (Q2, 0.212; Q3, 0.129; Q4, 0.037).
DISCUSSION
In the present study, we found that skeletal muscle and visceral fat contributed to NAFLD. First, the FLI increased in propor-
Table 2. Partial correlation analysis between indices of skeletal muscle, visceral fat, fatty liver index, and metabolic variables
r
SMIa VFAa SVRa
FLI -0.56 0.73 -0.41
BMI -0.60 0.80 -0.43
SBP -0.19 0.25 -0.11
DBP -0.18 0.24 -0.11
FPG -0.13 0.14 -0.08
HbA1c -0.11 0.12 -0.05
TC -0.16 0.20 -0.18
LDL-C -0.15 0.18 -0.17
AST -0.12 0.15 -0.09
ALT -0.25 0.31 -0.21
GGT -0.14 0.17 -0.13
T-bil 0.10 -0.08 -0.18
D-bil 0.07 -0.07 -0.17
hsCRP -0.11 0.12 -0.09
Correlation coefficients (r) and P values calculated using the Pearson partial correlation analysis.
SMI, skeletal muscle index; VFA, visceral fat area; SVR, skeletal mus- cle mass to visceral fat area ratio; FLI, fatty liver index; BMI, body mass index; SBP, systolic blood pressure; DBP, diastolic blood pressure; FPG, fasting plasma glucose; HbA1c, hemoglobin A1c; TC, total cholester- ol; LDL-C, low density lipoprotein cholesterol; AST, aspartate amino- transferase; ALT, alanine aminotransferase; GGT, γ-glutamyl trans- ferase; T-bil, total bilirubin; D-bil, direct bilirubin; hsCRP, high sensi- tivity C-reactive protein.
aAdjusted for age and gender; all variables P<0.001.
Fig. 1. Comparison of body composition indexes according to fatty liver disease (FLI). (A) Visceral fat area (VFA) was increased in higher FLI group compared with the low FLI group (FLI <20). (B) Skeletal muscle index (SMI) and (C) skeletal muscle to vis- ceral fat ratio (SVR) were decreased in both the high FLI group (FLI ≥60) and the intermediated group (20≤FLI<60). aP<0.05;
all variables were showed P<0.05, for trend in analysis of variance analysis.
FLI<20 20≤FLI<60 FLI≥60 140
120 100 80 60 40 20 0 VFA (cm2)
VFA a
a
a
FLI<20 20≤FLI<60 FLI≥60 400
300 200 100 0 SVR (g/cm2)
SVR a
a
a
FLI<20 20≤FLI<60 FLI≥60 44
42 40 38 36 34
SMI (%)
SMI a
a
a
A B C
tion to a rise in VFA and it was consistent with well-established relationships between abdominal obesity and NAFLD. Second,
282 Diabetes Metab J 2013;37:278-285 http://e-dmj.org there was an inverse correlation between SMM and VFA. Fi-
nally, higher SMM, which is adjusted by visceral fat, was asso- ciated with low incidence of NAFLD.
Little is known about how skeletal muscle works on abnor- mal fat accumulation in internal organs, especially the liver.
The role of skeletal muscle has been studied, but is limited to disability and functional activity with aging. However, concerns are growing in the context of insulin resistance. Intuitively, an increase of SMM is expected to give a higher basal metabolic rate and greater energy expenditure, which may in turn lead to reduced weight, including visceral fat and FLD. Recent studies
demonstrated that myokines secreted by skeletal muscle pre- vent systemic inflammation and insulin resistance through antagonizing the proinflammatory and metabolic effect of adi- pocytes [20]. Even a modest increase in muscle mass was able to prevent not only atherogenesis in prone mice, but also diet- induced obesity and insulin resistance [21]. Large population studies also have been used to characterize metabolic parame- ters associated with insulin, Srikanthan and Karlamangla [15]
showed that higher muscle mass was related with better insu- lin sensitivity and lower risk of prevalence of transitional/pre- diabetes or overt diabetes. Physical activity also interrelates with skeletal muscle, even if they are not exactly the same pa- rameters, and higher levels of habitual physical activity are re- lated with a lower intrahepatic fat content [22]. Thus, skeletal muscle has a beneficial effect on the risk of metabolic and car- diovascular disease.
Despite diverse clinical views on the definition of sarcopenia [23], decreased muscle mass is generally accepted as another risk factor of metabolic and cardiovascular disease in the con- text of insulin resistance. Lu et al. [24] confirmed that sarcope- nia as well as obesity affect the development of metabolic syn- drome. Kim et al. [16] reported that type 2 diabetes was inde- pendently associated with sarcopenia, which was defined us- ing the SMI (%) in Korean patients. Srikanthan et al. [17] re- ported that sarcopenia might be an early predictor of diabetes susceptibility independent of obesity in the National Health and Nutrition Examination Study III study.
In the present study, the FLI was lower in the group having higher SMM, and simultaneously, the group with NAFLD (FLI ≥60) had lower SMI and higher VFA when compare with the lower FLI group. The lowest SVR quartile group also showed Table 3. Associations of fatty liver index with age, metabolic variables and skeletal muscle mass to visceral fat area ratio by multi- ple regression analysis
Male Female
B β Adjusted R2 P value B β Adjusted R2 P value
Age, yr -0.671 -0.286 <0.001 -0.045 -0.022 0.197
SBP, mm Hg 0.391 0.187 <0.001 0.265 0.173 <0.001
FPG, mmol/L 1.062 0.055 0.002 0.233 0.010 0.590
HbA1c, % 1.640 0.054 0.411 0.002 5.274 0.157 0.428 <0.001
TC, mmol/L 20.037 0.748 <0.001 7.744 0.317 <0.001
hsCRP, mg/dL 3.452 0.055 <0.001 10.161 1.128 <0.001
SVR, g/cm2 -0.090 -0.408 <0.001 -0.085 -0.428 <0.001
SBP, systolic blood pressure; FPG, fasting plasma glucose; HbA1c, hemoglobin A1c; TC, total cholesterol; hsCRP, high sensitivity C-reactive protein; SVR, skeletal muscle mass to visceral fat area ratio.
Table 4. Odds ratio for fatty liver disease (fatty liver index ≥60) among the quartiles of skeletal muscle mass to visceral fat area ratio using multiple logistic regression analysis
SVR quartiles (g/cm2)
(≤230)Q1 Q2
(231-280) Q3
(281-335) Q4 (335>)
Model 1 1.00 0.221a 0.140a 0.038a
(0.188-0.259) (0.117-0.168) (0.030-0.048)
Model 2 1.00 0.203a 0.119a 0.034a
(0.171-0.241) (0.098-0.145) (0.026-0.044)
Model 3 1.00 0.207a 0.124a 0.035a
(0.174-0.246) (0.102-0.152) (0.027-0.046)
Model 4 1.00 0.212a 0.129a 0.037a
(0.179-0.253) (0.105-0.158) (0.029-0.049) Model 1: adjusted for age and gender. Model 2: Model 1 and adjusted for total cholesterol and low density lipoprotein cholesterol. Model 3:
Model 2 and adjusted for diabetes and hypertension. Model 4: Model 3 and adjusted for high sensitivity C-reactive protein.
SVR, skeletal muscle mass to visceral fat area ratio.
aP<0.001.
the highest risk of NAFLD. These results are consistent with prior findings and further show that the incidence of NAFLD increases with decreased muscle mass relative to visceral fat (SVR). Thus, skeletal muscle could play a significant role in the development of NAFLD and our results support a favor- able role for skeletal muscle in insulin resistance.
We identified an inverse correlation between skeletal muscle and visceral fat. Prior studies showed abdominal obesity nega- tively affects muscle strength and contributes to the progression of sarcopenia [25], as proinflammatory cytokines and leptin which are secreted by adipocytes stimulate skeletal muscle ca- tabolism and accelerate sarcopenia [26]. Given an increase in fat mass, particularly not subcutaneous but visceral fat, adipo- cytes overproduce proinflammatory cytokines such as interleu- kin-6 (IL-6), tumor necrosis factor α, and C-reactive protein [27]. IL-6, a pleiotropic cytokine produced by different tissues and organs, is known to have dual effects on muscle. IL-6 is principally defined as a proinflammatory cytokine, which in- creases muscle wasting when systemic levels are elevated chron- ically under persistent inflammatory conditions, cancer, and other chronic disease states. Simultaneously, IL-6 is also one of the few genuine myokines that are produced by and act on skel- etal muscle. Muscle induced IL-6 has beneficial effects in mus- cle growth, regeneration, and regulation of energy metabolism, but its action is transient and short-term [28]. Although the ex- act mechanisms are not fully understand, we found that skeletal muscle and visceral fat may influence each other in opposition and both strongly contribute to NAFLD. However, we did not directly measure the inflammatory cytokines.
Age-related body composition changes are well document- ed, and both a progressive increase in fat mass and loss of mus- cle mass occur even when there are no significant changes in BMI [29]. The change of body composition, especially mass and distribution of fat tissue normally peaks at about age 65 years in men and later in women [30]. We hypothesize that the risk of FLD may increase with aging. However, the result was contrary to what we expected in multiple regression analysis.
Even if not significant in women, it is thought to be caused by the relative young age combined with the high BMI of subjects in this study. According to the Korea National Health and Nu- trition Examination Survey, the incidence of obesity differed by sex and age in South Korea. The prevalence of obesity (de- fined by BMI) in men peaks in their 30s (42.3%), next in their 40s (41.2%), and decreases with age. In contrast, the propor- tion of obese women gradually rises with age (19% in their
30s, 26.7% in their 40s, and highest in their 60s, at 43.3%) [31].
Because participants in this study were in their mid-40s, with above average BMI for the Korean population (defined as over- weight by BMI ≥23), obesity may affect their FLI more than age-related changes. Further studies are needed to define the relationship between age and FLD.
Among the methods that assess liver fat accumulation, liver biopsy is the gold standard for evaluating hepatic steatosis and its changes by disease severity. But this procedure is difficult to apply to all patients due to limitations, including its invasive- ness, cost, and potential life-threatening complications. Al- though liver ultrasonography has been used the most widely, low specificity, high cost, and bias of results by the examiner are barriers to use in large populations. Similar shortcomings were observed in other radiologic tests such as computed to- mography (CT) and magnetic resonance spectroscopy [32].
Therefore, several methods have been developed for objective assessment of fatty liver, and FLI has been proposed and vali- dated in the general population [10,11]. It can be inferred that factors for calculating the FLI, such as WC, BMI, TG, and GGT, are closely associated with insulin resistance. FLI additionally has advantages in large population studies for providing high accuracy and less error by the examiner. This index showed good predictive value for detection of fatty liver and was vali- dated in studies with the Korean population [33,34]. There are reasons why we used FLI for this study. However, in spite of its many benefits, there are some disadvantages. This surrogate marker does not reflect a histological change of fatty infiltra- tion, and was reported to be a poor predictor of significant steatosis in obese patients (BMI ≥28 kg/m2) [35]. It needs to be validated with various ethnic groups, including Asians, and calibrated for the Asian population because of different defini- tions of obesity (BMI).
This study has several limitations. First, we did not include the analysis of physical activity. A recent study has shown that exercise reduces the risk of NAFLD and decreases liver en- zymes, independent of obesity [36]. Consistent with this study, low physical activity in NAFLD patients was also reported [37]. Because physical activity is closely related to muscle mass, our findings might not be irrelevant, but the cross-sectional design of this study makes it difficult to infer causality between skeletal muscle, visceral fat, and FLD. Second, this study has selection bias because subjects were health check-up partici- pants in a single center. Third, we used the BIA method to mea- sure muscle mass. Though dual energy X-ray absorptiometry
284 Diabetes Metab J 2013;37:278-285 http://e-dmj.org or CT were currently gold standard tests for evaluating SMM
[38], these methods were limited to epidemiologic studies in terms of cost and time. BIA showed good correlation with the dual energy X-ray absorptiometry method and was also vali- dated in studies of Asians including the Korean population [36,39]. However, overestimation of pathological states such as heart or renal failure may depend on the relationship between body composition and body water content. To minimize over- estimation, all participants were required to fast for 8 hours and individuals with renal failure were excluded. Finally, findings from this study can be applied only to Asian populations, but not to other ethnic groups.
In conclusion, VFA is closely correlated with NAFLD diag- nosed by FLI. There is an inverse correlation between SMM and VFA. High SMM and low VFA, that is high SVR, is associ- ated with low incidence of NAFLD. These results suggest that body composition, including skeletal muscle, may be more important than simple abdominal obesity in the development of FLD, and concerns about reducing or at least slowing the onset of sarcopenia are needed for prevention.
CONFLICTS OF INTEREST
No potential conflict of interest relevant to this article was re- ported.
REFERENCES
1. Byrne CD. Dorothy Hodgkin Lecture 2012: non-alcoholic fatty liver disease, insulin resistance and ectopic fat: a new problem in diabetes management. Diabet Med 2012;29:1098-107.
2. Park SH. Current status of liver disease in Korea: nonalcoholic fatty liver disease. Korean J Hepatol 2009;15 Suppl 6:S34-9.
3. Utzschneider KM, Kahn SE. Review: the role of insulin resis- tance in nonalcoholic fatty liver disease. J Clin Endocrinol Metab 2006;91:4753-61.
4. Stranges S, Dorn JM, Muti P, Freudenheim JL, Farinaro E, Russell M, Nochajski TH, Trevisan M. Body fat distribution, relative weight, and liver enzyme levels: a population-based study. Hepatology 2004;39:754-63.
5. Eguchi Y, Eguchi T, Mizuta T, Ide Y, Yasutake T, Iwakiri R, Hisatomi A, Ozaki I, Yamamoto K, Kitajima Y, Kawaguchi Y, Kuroki S, Ono N. Visceral fat accumulation and insulin resis- tance are important factors in nonalcoholic fatty liver disease. J Gastroenterol 2006;41:462-9.
6. Koda M, Kawakami M, Murawaki Y, Senda M. The impact of visceral fat in nonalcoholic fatty liver disease: cross-sectional and longitudinal studies. J Gastroenterol 2007;42:897-903.
7. Kim D, Choi SY, Park EH, Lee W, Kang JH, Kim W, Kim YJ, Yoon JH, Jeong SH, Lee DH, Lee HS, Larson J, Therneau TM, Kim WR. Nonalcoholic fatty liver disease is associated with coronary artery calcification. Hepatology 2012;56:605-13.
8. Marchesini G, Brizi M, Bianchi G, Tomassetti S, Bugianesi E, Lenzi M, McCullough AJ, Natale S, Forlani G, Melchionda N.
Nonalcoholic fatty liver disease: a feature of the metabolic syn- drome. Diabetes 2001;50:1844-50.
9. Bedogni G, Bellentani S, Miglioli L, Masutti F, Passalacqua M, Castiglione A, Tiribelli C. The Fatty Liver Index: a simple and accurate predictor of hepatic steatosis in the general popula- tion. BMC Gastroenterol 2006;6:33.
10. Kozakova M, Palombo C, Eng MP, Dekker J, Flyvbjerg A, Mi- trakou A, Gastaldelli A, Ferrannini E; RISC Investigators. Fatty liver index, gamma-glutamyltransferase, and early carotid plaques. Hepatology 2012;55:1406-15.
11. Calori G, Lattuada G, Ragogna F, Garancini MP, Crosignani P, Villa M, Bosi E, Ruotolo G, Piemonti L, Perseghin G. Fatty liv- er index and mortality: the Cremona study in the 15th year of follow-up. Hepatology 2011;54:145-52.
12. Balkau B, Lange C, Vol S, Fumeron F, Bonnet F; Group Study D.E.S.I.R. Nine-year incident diabetes is predicted by fatty liv- er indices: the French D.E.S.I.R. study. BMC Gastroenterol 2010;10:56.
13. Gastaldelli A, Kozakova M, Hojlund K, Flyvbjerg A, Favuzzi A, Mitrakou A, Balkau B; RISC Investigators. Fatty liver is associ- ated with insulin resistance, risk of coronary heart disease, and early atherosclerosis in a large European population. Hepatol- ogy 2009;49:1537-44.
14. DeFronzo RA, Bonadonna RC, Ferrannini E. Pathogenesis of NIDDM. A balanced overview. Diabetes Care 1992;15:318-68.
15. Srikanthan P, Karlamangla AS. Relative muscle mass is inverse- ly associated with insulin resistance and prediabetes: findings from the third National Health and Nutrition Examination Survey. J Clin Endocrinol Metab 2011;96:2898-903.
16. Kim TN, Park MS, Yang SJ, Yoo HJ, Kang HJ, Song W, Seo JA, Kim SG, Kim NH, Baik SH, Choi DS, Choi KM. Prevalence and determinant factors of sarcopenia in patients with type 2 diabetes: the Korean Sarcopenic Obesity Study (KSOS). Dia- betes Care 2010;33:1497-9.
17. Srikanthan P, Hevener AL, Karlamangla AS. Sarcopenia exac- erbates obesity-associated insulin resistance and dysglycemia:
findings from the National Health and Nutrition Examination Survey III. PLoS One 2010;5:e10805.
18. American Diabetes Association. Standards of medical care in diabetes: 2012. Diabetes Care 2012;35 Suppl 1:S11-63.
19. Alberti KG, Zimmet P, Shaw J; IDF Epidemiology Task Force Consensus Group. The metabolic syndrome: a new worldwide definition. Lancet 2005;366:1059-62.
20. Walsh K. Adipokines, myokines and cardiovascular disease.
Circ J 2009;73:13-8.
21. Izumiya Y, Hopkins T, Morris C, Sato K, Zeng L, Viereck J, Hamilton JA, Ouchi N, LeBrasseur NK, Walsh K. Fast/Glyco- lytic muscle fiber growth reduces fat mass and improves meta- bolic parameters in obese mice. Cell Metab 2008;7:159-72.
22. Perseghin G, Lattuada G, De Cobelli F, Ragogna F, Ntali G, Es- posito A, Belloni E, Canu T, Terruzzi I, Scifo P, Del Maschio A, Luzi L. Habitual physical activity is associated with intrahepat- ic fat content in humans. Diabetes Care 2007;30:683-8.
23. Brotto M. Lessons from the FNIH-NIA-FDA sarcopenia con- sensus summit. IBMS Bonekey 2012;9:210.
24. Lu CW, Yang KC, Chang HH, Lee LT, Chen CY, Huang KC.
Sarcopenic obesity is closely associated with metabolic syn- drome. Obes Res Clin Pract 2013;7:e301-7.
25. Schrager MA, Metter EJ, Simonsick E, Ble A, Bandinelli S, Lauretani F, Ferrucci L. Sarcopenic obesity and inflammation in the InCHIANTI study. J Appl Physiol 2007;102:919-25.
26. Reuben DB, Judd-Hamilton L, Harris TB, Seeman TE; Ma- cArthur Studies of Successful Aging. The associations between physical activity and inflammatory markers in high-function- ing older persons: MacArthur Studies of Successful Aging. J Am Geriatr Soc 2003;51:1125-30.
27. van der Poorten D, Milner KL, Hui J, Hodge A, Trenell MI, Kench JG, London R, Peduto T, Chisholm DJ, George J. Viscer- al fat: a key mediator of steatohepatitis in metabolic liver dis- ease. Hepatology 2008;48:449-57.
28. Munoz-Canoves P, Scheele C, Pedersen BK, Serrano AL. Inter- leukin-6 myokine signaling in skeletal muscle: a double-edged sword? FEBS J. Epub 2013 May 13. http://dx.doi.org/10.1111/
febs.12338.
29. Newman AB, Lee JS, Visser M, Goodpaster BH, Kritchevsky SB, Tylavsky FA, Nevitt M, Harris TB. Weight change and the conservation of lean mass in old age: the Health, Aging and Body Composition Study. Am J Clin Nutr 2005;82:872-8.
30. Prentice AM, Jebb SA. Beyond body mass index. Obes Rev 2001;2:141-7.
31. Korea Centers for Disease Control and Prevention. Korea health statistics 2010: Korea National Health and Nutrition Examination Survey (KNHANES V-1). Cheongwon: Korea Centers for Disease Control and Prevention; 2011.
32. Festi D, Schiumerini R, Marzi L, Di Biase AR, Mandolesi D, Montrone L, Scaioli E, Bonato G, Marchesini-Reggiani G, Col- ecchia A. Review article: the diagnosis of non-alcoholic fatty liver disease -- availability and accuracy of non-invasive meth- ods. Aliment Pharmacol Ther 2013;37:392-400.
33. Kim JH, Kwon SY, Lee SW, Lee CH. Validation of fatty liver in- dex and lipid accumulation product for predicting fatty liver in Korean population. Liver Int 2011;31:1600-1.
34. Jung CH, Lee WJ, Hwang JY, Yu JH, Shin MS, Lee MJ, Jang JE, Leem J, Park JY, Kim HK. Assessment of the fatty liver index as an indicator of hepatic steatosis for predicting incident diabe- tes independently of insulin resistance in a Korean population.
Diabet Med 2013;30:428-35.
35. Borman MA, Ladak F, Crotty P, Pollett A, Kirsch R, Pomier- Layrargues G, Beaton M, Duarte-Rojo A, Elkashab M, Myers RP. The Fatty Liver Index has limited utility for the detection and quantification of hepatic steatosis in obese patients. Hepa- tol Int 2013;7:592-9.
36. Bae JC, Suh S, Park SE, Rhee EJ, Park CY, Oh KW, Park SW, Kim SW, Hur KY, Kim JH, Lee MS, Lee MK, Kim KW, Lee WY. Regular exercise is associated with a reduction in the risk of NAFLD and decreased liver enzymes in individuals with NAFLD independent of obesity in Korean adults. PLoS One 2012;7:e46819.
37. Gerber L, Otgonsuren M, Mishra A, Escheik C, Birerdinc A, Stepanova M, Younossi ZM. Non-alcoholic fatty liver disease (NAFLD) is associated with low level of physical activity: a population-based study. Aliment Pharmacol Ther 2012;36:
772-81.
38. Haderslev KV, Haderslev PH, Staun M. Accuracy of body com- position measurements by dual energy x-ray absorptiometry in underweight patients with chronic intestinal disease and in lean subjects. Dyn Med 2005;4:1.
39. Rush EC, Chandu V, Plank LD. Prediction of fat-free mass by bioimpedance analysis in migrant Asian Indian men and wom- en: a cross validation study. Int J Obes 2006;30:1125-31.