INTRODUCTION
Hyperpolarized 13C magnetic resonance spectroscopy imaging (MRSI) is an emerging technique to observe the metabolic activities of tissue after injecting hyperpolarized
13C-labeled substrates (1, 2). Due to a low natural abundance of 13C, a special technique and equipment (dynamic nuclear polarization [DNP]), are required to enhance the
This is an Open Access article distributed under the terms of the Creative Commons Attribution Non-Commercial License (http://creativecommons.org/licenses/
by-nc/3.0/) which permits unrestricted non-commercial use, distribution, and reproduction in any medium, provided the original work is properly cited.
Received: June 23, 2015 Revised: September 3, 2015 Accepted: September 10, 2015 Correspondence to:
Dong-Hyun Kim, Ph.D.
Department of Electrical &
Electronic Engineering, Yonsei University, Yonsei-ro 50, Seodaemun-gu, Seoul 03722, Korea.
Tel. +82-2-2123-5874 Fax. +82-2-313-2879
Email: [email protected]
Copyright © 2015 Korean Society of Magnetic Resonance in Medicine (KSMRM)
Original Article
Purpose: For a single time-point hyperpolarized 13C magnetic resonance spectroscopy imaging (MRSI) of animal models, scan-time window after injecting substrates is critical in terms of signal-to-noise ratio (SNR) of downstream metabolites. Pre- scans of time-resolved magnetic resonance spectroscopy (MRS) can be performed to determine the scan-time window. In this study, based on two-site exchange model, protocol-specific simulation approaches were developed for 13C MRSI and the optimal scan-time window was determined to maximize the SNR of downstream metabolites.Materials and Methods: The arterial input function and conversion rate constant from injected substrates (pyruvate) to downstream metabolite (lactate) were pre- calibrated, based on pre-scans of time-resolved MRS. MRSI was simulated using two- site exchange model with considerations of scan parameters of MRSI. Optimal scan- time window for mapping lactate was chosen from simulated lactate intensity maps.
The performance was validated by multiple in vivo experiments of BALB/C nude mice with MDA-MB-231 breast tumor cells. As a comparison, MRSI were performed with other scan-time windows simply chosen from the lactate signal intensities of pre- scan time-resolved MRS.
Results: The optimal scan timing for our animal models was determined by simulation, and was found to be 15 s after injection of the pyruvate. Compared to the simple approach, we observed that the lactate peak signal to noise ratio (PSNR) was increased by 230%.
Conclusion: Optimal scan timing to measure downstream metabolites using hyperpolarized 13C MRSI can be determined by the proposed protocol-specific simulation approaches.
Keywords: Hyperpolarized 13C; MRSI; Two-site exchange; Pyruvate; Lactate
Determination of Optimal Scan Time for the Measurement of Downstream Metabolites in Hyperpolarized 13 C MRSI
Hansol Lee1, Joonsung Lee2, Eunhae Joe1, Seungwook Yang1, Young-suk Choi3, Eunkyung Wang3, Ho-Taek Song3, Dong-Hyun Kim1
1Department of Electrical & Electronic Engineering, Yonsei University, Seoul, Korea
2Center for Neuroscience Imaging Research, Institute for Basic Science, Sungkyunkwan University, Gyeonggi-do, Korea
3Department of Radiology, Yonsei University College of Medicine, Seoul, Korea
magnetic sensitivity of 13C nuclei by 10,000-fold or more, compared to the thermal equilibrium (3). One of the widely used molecules for hyperpolarization is [1-13C] pyruvate, which is converted to several downstream metabolites such as lactate, alanine, and bicarbonate (4). The real time metabolic activities of tissues can be observed by measuring the conversion of injected substrate to downstream metabolites via magnetic resonance spectroscopy (MRS).
Diagnosis and observation of treatment response for several diseases, such as cancer (2, 5, 6), heart disease (7), and diabetes (8), can be made by observation of metabolic activities.
Hyperpolarized 13C-labled substrates experience irrecoverable signal decay by T1 relaxation. With T1 relaxation constraint of ~20 s (9.4 T), it is important to acquire the hyperpolarized signal rapidly and efficiently.
Furthermore, downstream metabolites converted from injected substrates still have a low sensitivity. Thus, it is critical to determine optimal scan-time window to increase the signal-to-noise ratio (SNR) in hyperpolarized
13C MRSI. Conventionally, pre-scans of time-resolved hyperpolarized 13C magnetic resonance spectroscopy (MRS) were performed, and the scan-time window was determined directly from the dynamic intensity curves of downstream metabolites (9); however, this approach may not be optimal. In pre-scans of time-resolved MRS, RF excitations were performed before, or right after, injection of pyruvate. However, in hyperpolarized 13C MRSI, RF excitation were performed only during the pre-determined scan-time window. Due to different RF excitations, and thus the different remaining polarizations, dynamic polarization curves in hyperpolarized 13C MRSI cannot be represented well by the dynamic intensity curves in time- resolved MRS. In this study, the protocol-specific simulation methods using two-site exchange model were proposed to find the optimal scan-time window to maximize the SNR of downstream metabolites in hyperpolarized 13C MRSI.
Determined optimal scan-time window was validated by multiple in vivo experiments of tumor-bearing mice via injection of hyperpolarized [1-13C] pyruvate.
MATERIALS AND METHODS
MRSI Simulation Based on Two-site Exchange Model The dynamic curve of pyruvate and lactate signal can be simulated by considering the arterial input function (AIF) of the two-site exchange model, i.e., Eq. [1-2] (10).
rateinj (1-e-kpyr (t-tarr ) ) ,
Mpyr (t)= kpyr tarr≤t<tend [1]
Mpyr (tend ) e-kpyr (t-tend ) , t >tend
kpyr→lac rateinj 1-e-klac (t-tarr) - 1-e-kpyr (t-tarr) ,
kpyr-klac klac kpyr
tarr≤t < tend
Mlac(t)= Mpyr (tend ) kpyr→lac (e-klac (t-tend ) - e-kpyr (t-tend )) [2]
kpyr-klac
+ Mlac (tend ) e-klac (t-tend ), t ≥ tend
Here, Mpyr (t) and Mlac (t) are the time course function of
13C pyruvate and lactate signal, respectively. In addition, several parameters are used for this model. kx (x represents the pyruvate or lactate) is the rate constant for signal decay (in s-1), which involves both T1 decay and signal loss from excitation. kpyr→lac represents the conversion rate constant (in s-1). rateinj is the rate of pyruvate arrival (in a.u. s-1). tarr
represents the time of pyruvate arrival (in s), and tend is the time of pyruvate maximum in the dynamic curve (in s). In this simulation model, several assumptions were made.
First, duration from tarr to tend , rate of injection (rateinj), the T1 relaxation time of pyruvate, and conversion rate constant of pyruvate to lactate (kpyr→lac) for selected slice, can be estimated by pre-scans of time-resolved MRS. Second, the T1 relaxation times of pyruvate and lactate are equal (2).
Backward reaction rate constant (klac→pyr) was ignored (6).
Based on the pre-scans, the parameters used for simulation are as follows; 6s of duration between tarr and tend , 0.3 s-1 of rateinj , 21 s of T1 for 9.4 T in vivo environments, 0.0063 s-1 of kpyr→lac .
Based on the dynamic curve simulation, signal intensities of lactate on MRSI were simulated with multiple conversion rate constant values (kpyr→lac) and starting time of MRSI after injection (time after tend). The parameters of MRSI simulation are 10° of flip angle, 21 s of T1 relaxation time, 81ms of repetition time (TR), and 8 × 8 matrix size. Other parameters were the same as the dynamic curve simulation.
In vivo Experiments
All experiments were performed on a 9.4 T Bruker BioSpec 94/20 small animal imaging MRI (Bruker BioSpin MRI GmbH, Ettlingen, Germany) equipped with 1H-13C dual- tuned mouse surface transmit/receive coil. Six-weeks- old BALB/C nude mice, with MDA-MB-231 breast tumor cells implanted in the striatum of brain, were used for the animal studies. The mice were anesthetized using isoflurane during the MRI scan at the level of 1-3%. The animals were
{
{ ( )
kept warm on a heating bed with circulating warm water.
Temperature and breathing were monitored during the experiments. All animal procedures were approved by the institute animal care and use committee. For anatomical information, high resolution T2-weighted turbo RARE 1H MR images in axial plane were acquired, with 2 mm slice thickness and 0.125 × 0.125 mm2 resolution.
For hyperpolarized 13C experiments, [1-13C] pyruvic acid doped with 15 mM Trityl radical and 1.5 M Dotarem was polarized using HyperSense DNP polarizer (Oxford Instruments, Molecular Biotools, Oxford, UK). 3.8 mL of Tris/
EDTA (40 mM Tris, 21.6 mM NaOH, 0.1 g/L EDTA, 50 mM NaCl) solution was used for dissolution. After dissolution, approximately 350 µl of hyperpolarized pyruvate, having a concentration of 75 mM and a pH of around 7.5, was injected over a duration of 6 s, through a tail vein catheter.
For time-resolved hyperpolarized 13C MRS experiments, slice-selective FID data with a flip angle of 10° and temporal resolution of 1 s were acquired using a pulse and acquire sequence. A 10 mm-thick axial slice was selected, including whole brain. Data acquisitions started before the injection of [1-13C] pyruvate into mouse and continued for two minutes. The spectral bandwidth of acquired data was 6510 Hz with 2048 spectral points. Seventeen BALB/C nude mice, having the MDA-MB-231 breast tumor cells, were scanned.
For hyperpolarized 13C MRSI experiments, FID CSI sequence with centric-ordered phase encoding was used.
MRSI data were acquired with constant flip angle (FA
= 10˚), repetition time (TR = 81 ms), and 2 mm of slice thickness, resulting in a total scan time of 5.2 s. The FOV was set to 16 × 16 mm2 to cover a mouse brain having 8 × 8 matrix size. The spectral bandwidth of acquired data was 6510 Hz with 512 spectral points. Hyperpolarized 13C MRSI experiments were performed at different scan timing to compare the SNR of downstream metabolites on targeted tumor between, before, and after optimization (n = 3 for 7 s after injection, and n = 3 for 15 s after injection).
All data were processed using MATLAB (R2012a, MathWorks, Natick, MA, USA). MRS and MRSI data were apodized by a 33 Hz Lorentzian filter and zero-padded with 4096 points in time domain prior to FFT. The conversion rate constant, kpyr→lac, was estimated from pre-scans of time- resolved MRS data by fitting the dynamic intensity curves to Eq. [1] and [2] after injection (t > tend). The metabolite map was obtained from MRSI data by measuring the peak signal-to-noise ratio (PSNR) values of metabolites in each voxel. To visualize the results, measured PSNR values were overlaid with the high resolution 1H T2-weighted anatomical image.
RESULT
In time-resolved MRS, the apparent conversion rate constant was estimated as 0.0063 ± 0.004 in selected tumor-bearing slices (n = 17). In addition, T1 relaxation time constant was estimated at 21 ± 4.4 s in 9.4 T environments.
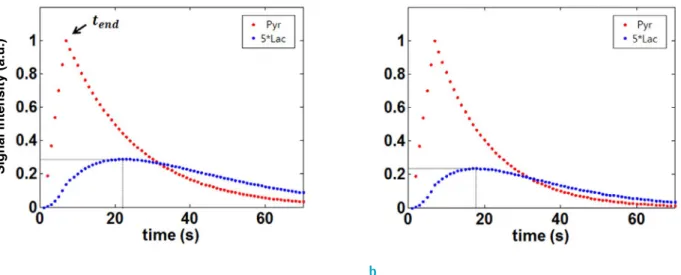
Fig. 1. Simulation of two-site exchange model (a) without and (b) with RF excitation of FA = 10°. Temporal resolution for two-site exchange simulation was 1 s (kpyr→lac = 0.0063 s-1, T1 = 21 s). In simulated dynamic curve, peak of the lactate signal appeared (a) 22 s and (b) 18 s after pyruvate arrival, respectively.
a b
Signal intensity (a.u.)
Mean values of apparent conversion rate constant and T1 relaxation time constant were used for determining the optimal scan-time window for hyperpolarized 13C MRSI.
Figure 1 represents the simulated lactate signal with temporal resolution of 1 s for two cases, one without RF excitation (Fig. 1a) and one with RF excitation (flip angle = 10°) (Fig. 1b). In simulated lactate signal evolution without RF excitations (Fig. 1a), lactate has maximum signal intensity at 16 s after tend, which is 22 s after pyruvate arrival (red dotted line). With RF excitations, maximum of lactate signal appeared 18 s after pyruvate arrival (Fig. 1b), which is 4 s earlier than without RF excitation.
In addition to previous dynamic simulation, the signal intensities of lactate on MRSI were simulated with multiple conversion rate constant values in ranges of 0.001-0.02 and
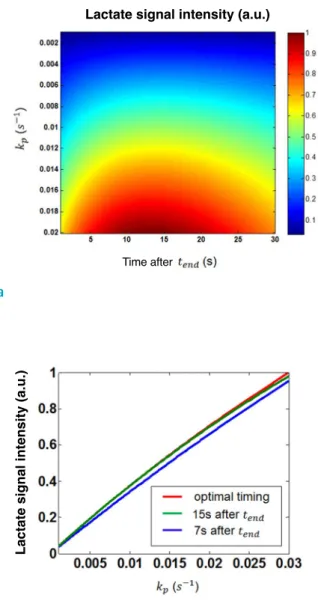
acquisition timings in range of 0-30 s (Fig. 2). The optimal scan timing for any conversion rate constant, which results in the maximum signal intensity of lactate on MRSI, can be determined by simulation (Fig. 2a). Figure 2b shows the optimal scan timing for each kpyr→lac . For higher conversion rate constant, the optimal scan timing is earlier. The optimal scan timing corresponding to the measured mean apparent conversion rate constant was about 15 s after injection.
Figure 2c compares the lactate signal intensity acquired at different scan timing for each kpyr→lac : optimal timing, 7 s after tend and 15 s after tend . For 0.0063 of kpyr→lac , the lactate signal intensity acquired at 7 s after tend is 10% less than the optimal timing. In contrast, the lactate signal intensity scanned at 15 s after tend is 0.01% less than optimal timing.
Thus, we can say that the optimal scan time is almost 15 s
Fig. 2. (a) Simulated lactate signal intensities in hyper- polarized 13C MRSI based on two-site exchange model with multiple kpyr→lac values and acquisition timing with FA = 10°, T1 = 21 s. (b) The optimal scan timing for each kpyr→lac . The optimal scan time for the estimated kpyr→lac , 0.0063, was about 15 s after tend . (c) The lactate signal intensities in MRSI with different scan timings; optimal timing (red line), 7 s after tend (blue line), and 15 s after tend (green line). For estimated kpyr→lac value of 0.0063, lactate signal intensity acquired at 7 s after tend was 10% less than optimal timing.
The lactate signal intensity acquired at 15 s after tend was 0.01% less than optimal timing.
c
a b
Time after
Time after
Lactate signal intensity (a.u.)
Lactate signal intensity (a.u.) Timing for maximum lactate intensity
after tend .
For in vivo experiments, multiple hyperpolarized 13C MRSI were performed to compare the SNR of lactate between, before, and after optimization of scan timing.
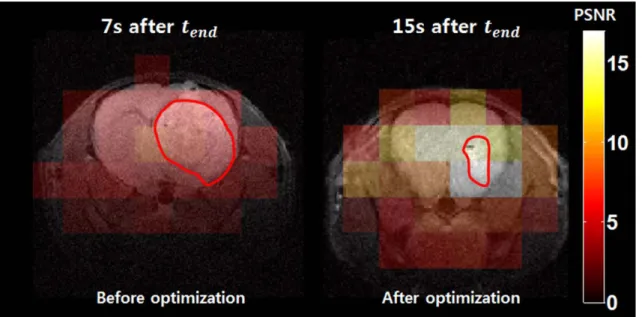
Control experiments were performed by scanning at the earlier timing of 7 s after tend . Figure 3 shows the lactate peak signal-to-noise (PSNR) maps. Before the optimization of scan-time window, PSNR of lactate in the voxels corresponding to tumor was 8 ± 4.6 (n = 3). PSNR of lactate scanned after optimization of scan-time window was 18.5 ± 3.1 (n = 3). Through the optimization of scan- time window using simulation of two-site exchange model, 230% increase in the downstream metabolite PSNR was achieved.
DISCUSSION
In this study, the measured conversion rate constant
(kpyr→lac) value of selected tumor-bearing slice was very
low (0.0063 s-1). Due to a low concentration of lactate converted from the injected pyruvate, SNR of lactate signal in selected slice was low. The improvements in lactate SNR was achieved by optimization of scan-time window. For higher values of kpyr→lac , a higher increase in the lactate SNR can be expected (Fig. 2c).
In this study, the pre-scans of time-resolved MRS data were acquired from tumor-bearing slice, including normal brain. In other words, the acquired data represented the dynamics of both normal brain and tumor. Scan-time window was optimized to improve the SNR of lactate in whole slices. If the kpyr→lac of tumor can be measured, the scan-time window can be optimized to improve SNR of lactate signal in tumor.
In pre-scans of time-resolved MRS, the standard deviation of estimated kpyr→lac value was comparable to the mean value. The conversion rate constant depends on the progression of tumor, conditions of each mouse (perfusion, metabolism, and anesthesia state etc.), and conditions of experiments (hyperpolarization level, injection duration etc.).
Mean value of estimated kpyr→lac was used for simulation to optimize the scan-time window.
In hyperpolarized 13C studies, the signal is irrecoverable, which decreases with metabolic conversion, T1 relaxation, and RF excitation. For these reasons, we used FID CSI sequence with centric ordered phase encoding. After acquiring data on the center of k-space first, it is beneficial to increase the SNR of metabolites. Furthermore, temporal and spatial resolutions are limited. Due to these limitations, low resolution of MRSI experiments, which were 2 × 2 mm2 of resolution, were performed in this study. The PSNR of lactate in MRSI was calculated voxel by voxel as shown in
Fig. 3. Comparison of lactate map acquired at (a) control, 7 s after tend and (b) optimized timing, 15 s after tend, overlaid with 1H anatomical image. The lactate map was obtained by measuring peak signal-to-noise ratio (PSNR) of lactate in each voxel. The PSNR corresponding tumor voxels was 8 ± 4.6 for 7 s after tend, and 18.5 ± 3.1 for 15 s after tend (n = 3 per measurement). The boundary of tumor implanted in mice brain is represented as a red line.
Figure 3. In low resolution images, partial-volume effects can lead to errors in the quantification of lactate in the brain and tumor tissues. If the MRSI experiments are performed with higher resolution, the quantification of PSNR improvement can be more accurate.
Furthermore, the lactate map was well-localized to the tumor after scan-time window optimization (Fig. 3).
However, any quantitative analysis related to localization was not performed in this study. Localization analysis involved with simulating point spread functions (PSFs) remains as a future work.
In conclusion, in hyperpolarized 13C MRSI experiments, it is important to determine the scan-time window in terms of SNR of downstream metabolites. Conventionally, the scan- time window was determined by pre-scans of time-resolved MRS experiments. However, it may not be an optimal timing. Thus, protocol-specific simulation approaches were developed to determine the optimal scan-time window for hyperpolarized 13C MRSI. Using the determined optimal scan-time window, SNR of downstream metabolites (i.e., lactate) was maximized in hyperpolarized 13C MRSI.
Acknowledgments
This work was financially supported by the Korean Health Technology R&D Project, Ministry for Health, Welfare &
Family Affairs (A110035-1101-0000200).
REFERENCES
1. Golman K, Zandt RI, Lerche M, Pehrson R, Ardenkjaer- Larsen JH. Metabolic imaging by hyperpolarized 13C
magnetic resonance imaging for in vivo tumor diagnosis.
Cancer Res 2006;66:10855-10860
2. Day SE, Kettunen MI, Gallagher FA, et al. Detecting tumor response to treatment using hyperpolarized 13C magnetic resonance imaging and spectroscopy. Nat Med 2007;13:1382-1387
3. Ardenkjaer-Larsen JH, Fridlund B, Gram A, et al. Increase in signal-to-noise ratio of > 10,000 times in liquid-state NMR. Proc Natl Acad Sci U S A 2003;100:10158-10163 4. Golman K, Zandt RI, Thaning M. Real-time metabolic
imaging. Proc Natl Acad Sci U S A 2006;103:11270-11275 5. Darpolor MM, Yen YF, Chua MS, et al. In vivo MRSI of
hyperpolarized [1-(13)C]pyruvate metabolism in rat hepatocellular carcinoma. NMR Biomed 2011;24:506-513 6. Harris T, Eliyahu G, Frydman L, Degani H. Kinetics of
hyperpolarized 13C1-pyruvate transport and metabolism in living human breast cancer cells. Proc Natl Acad Sci U S A 2009;106:18131-18136
7. Lau AZ, Chen AP, Ghugre NR, et al. Rapid multislice imaging of hyperpolarized 13C pyruvate and bicarbonate in the heart. Magn Reson Med 2010;64:1323-1331
8. Schroeder MA, Cochlin LE, Heather LC, Clarke K, Radda GK, Tyler DJ. In vivo assessment of pyruvate dehydrogenase flux in the heart using hyperpolarized carbon-13 magnetic resonance. Proc Natl Acad Sci U S A 2008;105:12051- 12056
9. Kohler SJ, Yen Y, Wolber J, et al. In vivo 13 carbon metabolic imaging at 3T with hyperpolarized 13C-1-pyruvate. Magn Reson Med 2007;58:65-69
10. Zierhut ML, Yen YF, Chen AP, et al. Kinetic modeling of hyperpolarized 13C1-pyruvate metabolism in normal rats and TRAMP mice. J Magn Reson 2010;202:85-92