Evaluation of White Matter Abnormality in Mild Alzheimer Disease and Mild Cognitive Impairment Using Diffusion Tensor Imaging: A Comparison of Tract-Based Spatial Statistics with Voxel-Based Morphometry
Hyun Kyung Lim1, Sang Joon Kim1, Choong Gon Choi1, Jae-Hong Lee2, Seong Yoon Kim3, Hengjun J. Kim4, Namkug Kim1, Geon-Ho Jahng5
1Department of Radiology and Research Institute of Radiology, University of Ulsan College of Medicine, Asan Medical Center
2Department of Neurology, University of Ulsan College of Medicine, Asan Medical Center
3Department of Psychiatry and Health Promotion Center, University of Ulsan College of Medicine, Asan Medical Center
4Division of Magnetic Resonance, Korea Basic Science Institute, Ochang-Eup, Korea
5Department of Radiology, Kyung Hee East-West Neo Medial Center, Kyung Hee University College of Medicine, Seoul, Korea
Purpose : To evaluate white matter abnormalities on diffusion tensor imaging (DTI) in patients with mild Alzheimer dis- ease (AD) and mild cognitive impairment (MCI), using tract-based spatial statistics (TBSS) and voxel-based morphometry (VBM).
Materials and Methods: DTI was performed in 21 patients with mild AD, in 13 with MCI and in 16 old healthy subjects.
A fractional anisotropy (FA) map was generated for each participant and processed for voxel-based comparisons among the three groups using TBSS. For comparison, DTI data was processed using the VBM method, also.
Results: TBSS showed that FA was significantly lower in the AD than in the old healthy group in the bilateral anterior and right posterior corona radiata, the posterior thalamic radiation, the right superior longitudinal fasciculus, the body of the corpus callosum, and the right precuneus gyrus. VBM identified additional areas of reduced FA, including both uncinates, the left parahippocampal white matter, and the right cingulum. There were no significant differences in FA between the AD and MCI groups, or between the MCI and old healthy groups.
Conclusion: TBSS showed multifocal abnormalities in white matter integrity in patients with AD compared with old healthy group. VBM could detect more white matter lesions than TBSS, but with increased artifacts.
Index words : Alzheimer disease∙Mild cognitive impairment∙Tract-based spatial statistics∙Voxel-based morphometry∙
Diffusion tensor imaging
Alzheimer’s disease (AD) is the most common type of dementia in the elderly, and mild cognitive impair- ment (MCI) is regarded as the transition stage between normal aging and AD (1). Several brain magnetic resonance imaging (MRI) studies have shown that abnormalities in AD patients involve both gray and
INTRODUCTION
�Received; March 19, 2012�Revised; June 25, 2012
�Accepted; July 5, 2012
This study was supported by a grant (grant number: 2004-336) from the Asan Institute for Life Sciences, Seoul, Korea.
Corresponding author : Sang Joon Kim, M.D., Department of Radiology and Research Institute of Radiology, University of Ulsan College of Medicine, Asan Medical Center, 88 Olympic-ro 43gil, Songpa-gu, Seoul 138-736, Korea.
Tel. 82-2-3010-4352, Fax. 82-2-476-0090 E-mail : [email protected]
Original Article
white matter (WM). Although the mechanism of WM impairment in patients with AD has been reported to be related to Wallerian degeneration (2) and microvas- cular ischemic disease (3-6), recent studies have found that WM alterations are likely affected by additional hypometabolism-inducing factors, including discon- nection and amyloid-βdeposition (7, 8).
Diffusion tensor imaging (DTI) studies investigating the integrity of WM in patients with AD have found that many WM areas, including the parahippocampal, entorhinal, inferior parietal and middle frontal regions, showed the strongest AD-associated reductions in fractional anisotropy (FA) (4, 9-13).
However, results based on analyzing regions of interest (ROIs) likely do not completely reflect the entire structural integrity of the fiber tracts, and the FA value obtained from a ROI analysis is largely affected by location and size of the ROIs; both being limiting factors in accuracy of ROI method since the ROI selection is often conducted without a prior knowledge about the exact location and extent of pathology. To overcome this problem, many imaging studies are starting to use FA images in voxel-based morphometry (VBM) analysis, in order to localize brain change related to neuro-degenerative disease (9, 10, 14, 15). This analysis, however, may be compro- mised by using standard registration algorithms; to date, no satisfactory method has been devised to align FA images from multiple subjects, such that valid conclusions may be drawn from the subsequent voxel- wise analysis. Furthermore, the arbitrariness of the choice of spatial smoothing extent has not yet been resolved.
To improve spatial normalization and provide better inter-subject registration, tract-based spatial statistics (TBSS) (16), which generate a custom template from each data set, were recently introduced to perform voxel-wise statistical analyses of FA. The TBSS technique was designed to overcome the limitations of VBM by a) careful tuning of nonlinear registration, followed by b) projection onto an alignment-invariant representative tract (called the “mean FA skeleton”).
Therefore, TBSS has been found to improve the sensitivity, objectivity and interpretability of analysis of multi-subject diffusion imaging studies (16). This method is very useful in assessing patients with neurodegenerative diseases such as AD, which primar- ily affects neuronal density, allows changes to be
detected at the earliest stages of the disease.
The purpose of this study is to investigate WM structural abnormalities in patients with mild AD and MCI patients compared with those in the old healthy groups, using the TBSS technique for DTI analysis. We also evaluated WM abnormality using VBM method and compared with the results of TBSS study.
This study was approved by our institutional review board for human investigation, and informed consent was obtained from the patients or their relatives.
Patients
We studies 21 patients with mild AD (7 men, 14 women; mean ± SD age, 72 ± 6 years), 13 patients with MCI (5 men, 8 women; mean ± SD age, 71 ± 8 years), and 16 old healthy subjects (6 men, 10 women;
mean ± SD age, 69 ± 4 years). Mild AD was diagnosed by the criteria of the National Institute of Neurological and Communicative Disorders and Stroke (NINCDS) and the Alzheimer’s Disease and Related Disorders Association (ADRDA) (17), and only patients classified as having Clinical Dementia Rating Scale (CDR) scores of 0.5 or 1 were included.
The overall severity of cognitive impairment was rated with the Using the Mini-Mental State Examination (MMSE) (18). Their MMSE score was 17.9 ± 3.9 (mean ± SD).
MCI was diagnosed according to the criteria of the International Working Group on Mild Cognitive Impairment (IWGMCI) (1): (i) the person is neither normal nor demented; (ii) there is evidence of cognitive deterioration, shown by either objectively measured decline over time and/or subjective report of decline by self and/or informant in conjunction with objective cognitive deficits; and (iii) activities of daily living are preserved and complex instrumental functions are either intact or minimally impaired. This classification was performed by using a semi- structured interview.
The old healthy group consisted of healthy elderly adults with CDR 0, with no previous history of neurological or psychiatric disease, and no complaints about decreased memory.
Patients with a history of diabetes, coronary heart MATERIALS AND METHODS
disease, peripheral vascular disease, or other cardio- vascular diseases were excluded, as were patients with evidence of head trauma; a primary psychiatric diagnosis; an infectious or endocrine cause of cognitive dysfunction; a history of habituation to drugs; the presence of cerebrovascular disease; or high WM signals on MR T2-weighted or fluid-attenuated inversion recovery (FLAIR) imaging.
Image acquisition
All MRI examinations were performed on a 1.5 T MR scanner (Gyroscan Intera, Philips Medical Systems, Best, the Netherlands). Conventional axial and coronal T2-weighted and axial FLAIR images were obtained to rule out cerebral infarction and other lesions. The parameters for T2-weighted imaging were as follows: TR, 3000 ms; TE, 100 ms; section thickness, 5 mm; FOV, 230×184 mm; and matrix size, 512×512. The parameters for FLAIR imaging were as follows: TR, 11000 ms; TE, 125 ms; TI, 2,800 ms;
modulation of flip angle for refocusing pulses; section thickness, 5 mm; FOV, 230×180 mm; and matrix size, 512×512.
DTI images were acquired with a single-shot spin- echo echo-planar imaging (EPI) sequence in alignment with the horizontal plane. The diffusion-sensitizing gradients were applied along 15 non-colinear directions with a b-value of 600 s/mm2, together with acquisition without diffusion weighting (b = 0 s/mm2).
Fifty-four contiguous axial slices of 2-mm thickness were acquired, with no gaps between slices. The acquisition parameters were as follows: TR = 7548 ms;
TE = 60 ms; matrix size = 128×128; FOV = 224×224 mm; and NSA, 2.
Image processing and statistical analyses Data analyses were performed using the Functional MRI of the Brain Software Library (FSL, http:\\www.
fmrib.ox.ac.uk\fsl). Diffusion-weighted images of each subject were corrected for eddy currents, and aligned to one’s non-diffusion weighted (B0) image using an affine transformation to correct for head movement.
Subsequently, FA was calculated by fitting a diffusion tensor model at each voxel. All FA maps of the subjects were aligned to the FMRIB58 template, located in the same space as the MNI152 standard space, using FNIRT, a nonlinear registration tool provided in FSL. A mean skeleton mask was extracted
from the mean FA map of the aligned images, and each subject’s aligned FA data were projected onto the mean skeleton mask. The entire FA map of each brain was analyzed using TBSS in the FSL package (16), after eliminating voxels with an FA lower than 0.2 to eliminate the voxels in the gray matter or cerebrospinal fluid from the analysis.
Nonparametric permutation tests were used for voxel-wise statistical analysis of the individual FA skeletons among AD and old healthy groups. The significance threshold for group differences was set at p < 0.05, corrected for multiple comparisons across voxels using the threshold-free cluster-enhancement (TFCE) option in the Randomise 2.0 in FSL (19).
Identification of the abnormal WM tracts revealed by TBSS was based on the Atlas formulated at Johns Hopkins University (20-22).
ROI analysis was performed in the clusters of differ- ent FAs between AD and old healthy group based on the TBSS analysis. FA values of the corresponding clusters were compared among the 3 groups using one- way ANOVA with Bonferroni test and correlations between disease groups and FA values were analyzed.
For VBM, we used the registered FA maps on the MNI152 standard space by FNIRT for TBSS analysis.
These aligned FA maps were smoothed using an 8 mm full width at half maximum (FWHM) kernel. The final output was a three-dimensional matrix, in which the three indices were the x, y, and z spatial coordinates
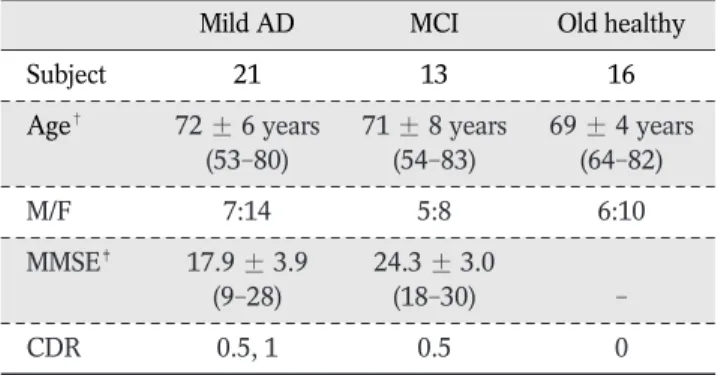
Table 1. Demographic and Clinical Characteristics of the Subjects
Mild AD MCI Old healthy
Subject 21 13 16
Age� 72 ± 6 years 71 ± 8 years 69 ± 4 years
(53-80) (54-83) (64-82)
M/F 7:14 5:8 6:10
MMSE� 17.9 ± 3.9 24.3 ± 3.0
(9-28) (18-30) -
CDR 0.5, 1 0.5 0
�Mean ± SD (range).
T-tests of AD vs. MCI (p = 0.705), AD vs. old healthy (p = 0.118), MCI vs. old healthy (p = 0.395)
�Mean ± SD (range).
T-test of AD vs. MCI (p < 0 .001)
Note.─ AD = Alzheimer disease; MCI = mild cognitive impairment; MMSE = Mini-Mental State Examination; CDR = Clinical Dementia Rating Scale
of voxels in the reference space. FA values in the maps of the AD, MCI and old healthy groups were compared pairwise using a general linear model after adjusting for age and sex on a voxel-by-voxel basis.
The resulting statistical maps were thresholded at a false discovery rate (FDR)-corrected p < 0.05 with k >
500 voxels.
Table 1 shows the demographic and clinical charac- teristics of the subjects in the three groups. There was no difference in age among the three groups. MMSE scores were significantly lower in the mild AD than in the MCI group (p < 0.001).
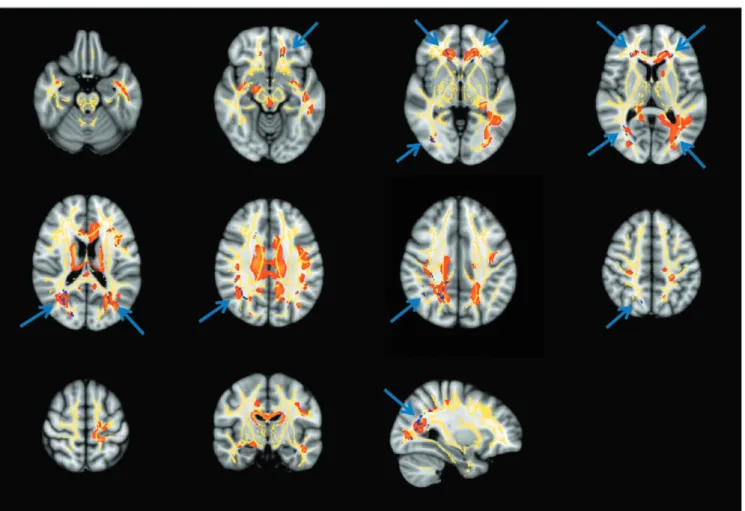
The regions with reduced FA in the mild AD compared with the old healthy group in voxel-based
TBSS and VBM analyses are shown in Figure 1. Using the TBSS method, we observed reduced FA in patients with mild AD, compared with the old healthy group, in several brain regions, including the bilateral anterior corona radiata, the right posterior corona radiata, both posterior thalamic radiations including optic radiations, the right superior longitudinal fasciculus, the body of the corpus callosum, and the WM adjacent to the right precuneus gyrus (Table 2).
VBM showed a wider area of decreased FA in the AD group, including both uncinates, the left parahip- pocampal WM, and the right cingulum (Table 3).
There were no significant differences in FA between the mild AD and MCI groups and between the MCI and old healthy groups.
ROI analysis on TBSS showed that FA values in all clusters defined by FA differences between AD and old healthy group were significantly lower in the AD RESULTS
Fig. 1. Results of TBSS and VBM analyses of patients with mild AD. The figure shows the patterns of reduced FA in mild AD subjects (blue) compared with old healty subjects at TBSS analysis, overlaid onto a mean FA skeleton (yellow). The area of reduced FA (in red) at VBM analysis is also shown (p < 0.05, corrected for multiple comparisons).
Note.─ TBSS = tract-based spatial statistics; VBM = voxel-based morphometry; AD = Alzheimer disease; FA = fractional anisotrophy
than in the old healthy group, with FA values of the clusters in the MCI group being intermediate to those in the other two groups. However, the difference between the AD and MCI group or between MCI and old healthy group showed various significances accord- ing to the cluster (Table 4). We observed strong negative correlations between disease progression and FA values.
We have utilized TBSS to evaluate WM abnormali- ties on DTI in patients with mild AD and MCI compared with old healthy group. We observed signifi- cant differences between the AD and old healthy groups, with the former showing multifocal clusters of reduced FA in both cerebral hemispheres.
VBM-based analysis of FA images to localize brain changes related to degenerative disease is dependent
DISCUSSION
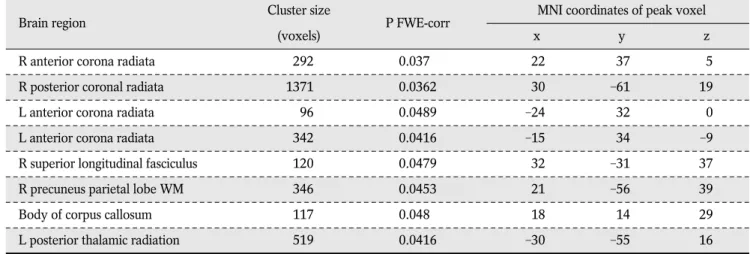
Table 2. Anatomic Locations Showing Significantly (p < 0.05, FWE-corrected) Reduced FA in Mild AD Compared with Old Healthy Subjects on TBSS Analysis
Brain region Cluster size
P FWE-corr MNI coordinates of peak voxel
(voxels) x y z
R anterior corona radiata 292 0.037 22 37 5
R posterior coronal radiata 1371 0.0362 30 -61 19
L anterior corona radiata 96 0.0489 -24 32 0
L anterior corona radiata 342 0.0416 -15 34 -9
R superior longitudinal fasciculus 120 0.0479 32 -31 37
R precuneus parietal lobe WM 346 0.0453 21 -56 39
Body of corpus callosum 117 0.048 18 14 29
L posterior thalamic radiation 519 0.0416 -30 -55 16
Note.─ L = left; R = right; WM = white matter; FA = fractional anisotrophy; AD = Alzheimer disease; TBSS = tract based spatial statistics; FWE = familywise error rate
Table 3. Anatomic Locations Showing Significantly Reduced FA in Mild AD Compared with Old Healthy Subjects on VBM Analysis
Brain region PFDR-corr T* MNI coordinates of peak voxel Cluster size
x y z (voxel)
R caudate body 0.003 6.26 14 -1 24 70273
Near R thalamus 0.003 5.61 15 -10 27
Near L inferior occipital gyrus 0.005 5.09 -37 -72 -7
L hippocampus 0.004 5.23 -28 -33 -4 1025
R middle occipital gyrus 0.005 4.98 34 -80 4.5 992
R middle occipital gyrus 0.014 4.03 39 -76 -3
Near R middle occipital gyrus 0.036 2.9 33 -68 -1
Near R superior temporal gyrus 0.006 4.89 39 -3 -16 828
R parahippocampal gyrus 0.009 4.43 20 -9 -14 500
R brainstem, midbrain 0.018 3.76 3 -27 -10 502
T*: p < 0.05, corrected using False Discovery Rate (FDR); coordinated in MNI space
Note.─ L = left; R = right; WM = white matter; FA = fractional anisotrophy; AD = Alzheimer disease; VBM = voxel-based morphometry
on the accuracy of registration algorithms. To date, however, there have been no satisfactory solutions to the problems of aligning FA images from multiple subjects and to the choice of spatial smoothing extent.
TBSS was therefore developed to resolve these issues, using carefully tuned nonlinear registration, followed by projection onto an alignment-invariant tract representation. TBSS was designed to improve the sensitivity, objectivity and interpretability of analyses of multi-subject diffusion imaging studies.
Although several DTI studies have reported differ- ences in WM integrity between AD and old healthy groups, the results of these studies have been somewhat inconsistent. In agreement with previous results, we found that association fiber pathways, such as the superior longitudinal fasciculus, were compro- mised on the right side (23-25). The corpus callosum was also affected in the body portion, in partial agreement with other findings reporting genu or splenium portion (7, 24, 26). In contrast to a previous TBSS-based study by Striker et al. (25), which reported that the corona radiata, an early-myelinating WM fiber, was affected during the late stage of AD, we found that the bilateral anterior and right posterior corona radiata were compromised in patients with mild AD. This discrepancy may be due to the mean MMSE being lower in our mild AD group (17.9) than in their study group (24.4). So, more advanced AD patients than their study may be include in our study.
We also found that FA in the left posterior thalamic radiations including the optic radiations was signifi- cantly lower in our mild AD than our old healthy group, and these results were consistent with two previous reports (7, 27). Moreover, FA was reported to be reduced at the precuneus WM by Salat et al. (28).
Several authors reported decreased FA in patients with AD in areas of the temporal lobe, including the hippocampus, parahippocampal gyrus and uncinate (9, 24, 29), as well as in the cingulum and fornix (24, 29- 31). In our study using the TBSS method, we found that these areas did not show significant differences in FA between the AD and old healthy groups. However, when we processed the same patients’ data with the VBM method, we observed reduced FA areas in both uncinates, the left parahippocampal WM and the right cingulum in mild AD, in addition to the areas shown by TBSS analysis. These differences between the TBSS and VBM results are likely due to methodological differences. The VBM method conducted voxel-wise comparisons of FA maps on the stereotaxic space after using the smoothing kernel. However, TBSS used skeletonized FA maps and voxel-wise comparisons were performed on the white matter skeleton. The discrepancies we observed between the two analytic methods may explain, at least in part, the different results observed among different studies. We found that the VBM method showed more areas of decreased FA than the TBSS method. Although we also observed Table 4. Mean Fractional Anisotropy Values of TBSS-Based Clusters (in Table 2) in the AD, MCI, and Old Healthy Groups
Brain region Old healthy MCI AD
R anterior corona radiata 0.52 ± 0.05 0.49 ± 0.05 0.45 ± 0.05**, �
R posterior coronal radiata 0.54 ± 0.03 0.51 ± 0.03 0.47 ± 0.04**, �
L anterior corona radiata 0.49 ± 0.05 0.47 ± 0.06 0.42 ± 0.04**
L anterior corona radiata 0.53 ± 0.05 0.51 ± 0.05 0.46 ± 0.04**, �
R superior longitudinal fasciculus 0.55 ± 0.04 0.51 ± 0.05 0.48 ± 0.05**
R precuneus parietal lobe WM 0.51 ± 0.03 0.48 ± 0.04** 0.45 ± 0.03**, �
Body of corpus callosum 0.48 ± 0.05 0.44 ± 0.04 0.41 ± 0.06**
L posterior thalamic radiation 0.64 ± 0.04 0.59 ± 0.06** 0.56 ± 0.06**
Note.─ Comparisons by one-way ANOVA with the Bonferroni post hoc test. AD = Alzheimer disease; MCI = mild cognitive impairment
*FA is significantly reduced compared with old healthy group (p < 0.05)
**FA is significantly reduced compared with old healthy group (p < 0.01)
�FA is significantly reduced compared with MCI group (p < 0.05)
�FA is significantly reduced compared with MCI group (p < 0.01)
significant FA differences in areas along the lateral ventricles with the VBM method, these were consid- ered artifacts caused by large ventricle size due to atrophy in the AD group.
Although several recent studies have investigated WM structural integrity in patients with MCI using TBSS analysis of DTI of the entire brain, these studies have shown conflicting results. One found that FA was not significantly lower in MCI patients than in controls (32), whereas the other found that FA was significantly decreased in the right parahippocampal WM, the bilateral uncinate fasciculus, and WM in the brain stem and cerebellum of MCI patients (24), although the findings were no longer significant following multiple comparison correction.
In our study, the TBSS method showed no significant differences in FA between the mild AD and MCI groups or between the MCI and old healthy groups.
However, ROI analysis of low FA clusters identified by the TBSS method showed that FA tended to decrease from the old healthy to the MCI to the AD group in all clusters, although the differences between AD and MCI or between MCI and old healthy showed various degrees of statistical significance. These findings suggest that FA changes between the MCI and old healthy groups and between the MCI and mild AD groups are small, but that the differences may be significant if the number of study population is sufficiently large. The progressive decrease in FA from normal aging to MCI to AD supports the concept that MCI is a transitional stage between normal aging and AD (1).
The reasons for the conflicting WM integrity results among the AD, MCI and old healthy groups are not clear, but many factors may contribute. For example, they may be due to differences in study populations.
Patients were grouped based on clinical information, and each group may be heterogeneous. In addition, the number of study patients was relatively small, 20- 30 per group, which may have caused the comparisons to have insufficient statistical power. Differences may have been due to the investigational methods used, including ROI analysis, VBM, and TBSS, or to differ- ences in MR imaging parameters.
Our study had several limitations. As in other studies of patients with neurodegenerative diseases, patient selection criteria were based on clinical diagnosis, with no pathological confirmation.
Therefore, some of our patients may have been misdiagnosed and placed in the wrong group. Another limitation was the parameter determination in the TBSS method. Although the TBSS method has been used in several studies, the optimal parameters remain unknown (e.g., corrected or uncorrected multiple comparison and difference in p values). The discrepan- cies between our results and other studies may therefore be partly due to methodological factors. In addition, our results may have been limited by the small numbers of patients in each group.
Despite these limitations, we found that voxel-based analysis with TBSS is a promising method for examin- ing WM degeneration in patients with mild AD. We found that WM degeneration involves neurofiber tracts in early phase of AD. Moreover, we found that MCI might be considered a valid concept to detect very early AD pathology, since we found close similar- ities in the pattern of WM change.
Using TBSS, we observed multifocal abnormalities in WM matter integrity in patients with AD compared with old healthy group. VBM could detect more white matter lesions than TBSS, but with increased artifacts.
Additional studies, including larger numbers of patients, are needed to evaluate WM lesions more accurately.
References
1. Petersen RC, Doody R, Kurz A, et al. Current concepts in mild cognitive impairment. Arch Neurol 2001;58:1985-1992 2. Leifer D, Buonanno FS, Richardson EP. Clinicopathologic
correlations of cranial magnetic resonance imaging of periven- tricular white matter. Neurology 1990;40:911-918
3. de Leeuw FE, Barkhof F, Scheltens P. White matter lesions and hippocampal atrophy in Alzheimer’s disease. Neurology 2004;
62:310-312
4. Bozzali M, Falini A, Franceschi M, et al. White matter damage in Alzheimer’s disease assessed in vivo using diffusion tensor magnetic resonance imaging. J Neurol Neurosurg Psychiatry 2002;72:742-746
5. Sydykova D, Stahl R, Dietrich O, et al. Fiber connections between the cerebral cortex and the corpus callosum in Alzheimer’s disease: a diffusion tensor imaging and voxel-based morphometry study. Cereb Cortex 2007;17:2276-2282 6. Yoshita M, Fletcher E, Harvey D, et al. Extent and distribution
of white matter hyperintensities in normal aging, MCI, and AD.
Neurology 2006;67:2192-2198
CONCLUSION
7. Serra L, Cercignani M, Lenzi D, et al. Grey and white matter changes at different stages of Alzheimer’s disease. J Alzheimers Dis 2010;19:147-159
8. Chetelat G, Desgranges B, Landeau B, et al. Direct voxel-based comparison between grey matter hypometabolism and atrophy in Alzheimer’s disease. Brain 2008;131:60-71
9. Xie S, Xiao JX, Gong GL, et al. Voxel-based detection of white matter abnormalities in mild Alzheimer disease. Neurology 2006;66:1845-1849
10. Medina D, DeToledo-Morrell L, Urresta F, et al. White matter changes in mild cognitive impairment and AD: a diffusion tensor imaging study. Neurobiol Aging 2006;27:663-672
11. Stahl R, Dietrich O, Teipel SJ, Hampel H, Reiser MF, Schoenberg SO. White matter damage in Alzheimer disease and mild cognitive impairment: assessment with diffusion-tensor MR imaging and parallel imaging techniques. Radiology 2007;243:483-492
12. Takahashi S, Yonezawa H, Takahashi J, Kudo M, Inoue T, Tohgi H. Selective reduction of diffusion anisotropy in white matter of Alzheimer disease brains measured by 3.0 Tesla magnetic resonance imaging. Neurosci Lett 2002;332:45-48 13. Salat DH, Greve DN, Pacheco JL, et al. Regional white matter
volume differences in nondemented aging and Alzheimer’s disease. Neuroimage 2009;44:1247-1258
14. Stoub TR, deToledo-Morrell L, Stebbins GT, Leurgans S, Bennett DA, Shah RC. Hippocampal disconnection contributes to memory dysfunction in individuals at risk for Alzheimer’s disease. Proc Natl Acad Sci U S A 2006;103:10041-10045 15. Chaim TM, Duran FL, Uchida RR, Perico CA, de Castro CC,
Busatto GF. Volumetric reduction of the corpus callosum in Alzheimer’s disease in vivo as assessed with voxel-based morphometry. Psychiatry Res 2007;154:59-68
16. Smith SM, Jenkinson M, Johansen-Berg H, et al. Tract-based spatial statistics: voxelwise analysis of multi-subject diffusion data. Neuroimage 2006;31:1487-1505
17. McKhann G, Drachman D, Folstein M, Katzman R, Price D, Stadlan EM. Clinical diagnosis of Alzheimer’s disease: report of the NINCDS-ADRDA work group under the auspices of depart- ment of health and human services task force on Alzheimer’s disease. Neurology 1984;34:939-944
18. Folstein MF, Folstein SE, McHugh PR. “Mini-mental state”. A practical method for grading the cognitive state of patients for the clinician. J Psychiatr Res 1975;12:189-198
19. Smith SM, Nichols TE. Threshold-free cluster enhancement:
addressing problems of smoothing, threshold dependence and
localisation in cluster inference. Neuroimage 2009;44:83-98 20. Wakana S, Jiang H, Nagae-Poetscher LM, van Zijl PC, Mori S.
Fiber tract-based atlas of human white matter anatomy.
Radiology 2004;230:77-87
21. Wakana S, Caprihan A, Panzenboeck MM, et al.
Reproducibility of quantitative tractography methods applied to cerebral white matter. Neuroimage 2007;36:630-644
22. Mori S, Wakana S, van Zijl PCM, Nagae-Poetscher LM. MRI atlas of human white matter. Amsterdam, The Netherland:
Elsevier: 2005. p 15-237
23. Bosch B, Arenaza-Urquijo EM, Rami L, et al. Multiple DTI index analysis in normal aging, amnestic MCI and AD.
Relationship with neuropsychological performance. Neurobiol Aging 2010 Apr 3. [Epub ahead of print]. doi:10.1016/
j.neurobiolaging.2010.02.004
24. Liu Y, Spulber G, Lehtimaki KK, et al. Diffusion tensor imaging and tract-based spatial statistics in Alzheimer’s disease and mild cognitive impairment. Neurobiol Aging 2011;32:1588-1571 25. Stricker NH, Schweinsburg BC, Delano-Wood L, et al.
Decreased white matter integrity in late-myelinating fiber pathways in Alzheimer’s disease supports retrogenesis.
Neuroimage 2009;45:10-16
26. Balthazar ML, Yasuda CL, Pereira FR, Pedro T, Damasceno BP, Cendes F. Differences in grey and white matter atrophy in amnestic mild cognitive impairment and mild Alzheimer’s disease. Eur J Neurol 2009;16:468-474
27. Zhuang L, Wen W, Zhu W, et al. White matter integrity in mild cognitive impairment: a tract-based spatial statistics study.
Neuroimage 2010;53:16-25
28. Salat DH, Tuch DS, van der Kouwe AJ, et al. White matter pathology isolates the hippocampal formation in Alzheimer’s disease. Neurobiol Aging 2010;31:244-256
29. Fellgiebel A, Scheurich A, Bartenstein P, Muller MJ. FDG-PET and CSF phospho-tau for prediction of cognitive decline in mild cognitive impairment. Psychiatry Res 2007;155:167-171 30. Acosta-Cabronero J, Williams GB, Pengas G, Nestor PJ.
Absolute diffusivities define the landscape of white matter degeneration in Alzheimer’s disease. Brain 2010;133:529-539 31. Smith CD, Chebrolu H, Andersen AH, et al. White matter
diffusion alterations in normal women at risk of Alzheimer’s disease. Neurobiol Aging 2010;31:1122-1131
32. Damoiseaux JS, Smith SM, Witter MP, et al. White matter tract integrity in aging and Alzheimer’s disease. Hum Brain Mapp 2009;30:1051-1059
통신저자 : 김상준, (138-736) 서울시 송파구 올림픽로 43길 88, 울산대학교 서울아산병원 영상의학과 Tel. (02) 3010-4352 Fax. (02) 476-0090 E-mail: [email protected]
확산텐서영상을 이용한 경도의 알츠하이머병 환자와 경도인지장애 환자의 뇌 백질의 이상평가: Tract-Based Spatial Statistics와
화소기반 형태분석 방법의 비교
1울산대학교 서울아산병원 영상의학과
2울산대학교 서울아산병원 신경과
3울산대학교 서울아산병원 정신건강의학과
4한국기초과학지원연구원 자기공명연구부
5강동경희대학교병원 영상의학과
임현경1∙김상준1∙최충곤1∙이재홍2∙김성윤3∙김형준4∙김남국1∙장건호5
목적: Tract-based spatial statistics와 화소기반 형태분석 방법을 이용하여 경도의 알츠하이머병 환자와 경도인 지장애 환자에서 확산텐서영상을 이용하여 뇌 백질의 이상을 평가하고자 하였다.
대상과 방법: 21명의 경도의 알츠하이머병 환자와 13명의 경도인지장애 환자, 그리고 16명의 건강한 노인군을 대상 으로 확산텐서영상을 시행하였다. 각 참가자마다 분할 비등방도를 구하여 Tract-based spatial statistics를 이용 하여 세 그룹간의 비교를 하였다. Tract-based spatial statistics 방법과의 비교를 위하여, 화소기반 형태분석 방 법을 이용한 분석도 함께 시행하였다.
결과: Tract-based spatial statistics 분석결과, 경도의 알츠하이머 환자에서 건강한 노인군보다 방사관의 양측 전각과 우측 후각, 후시상방사, 우측 상세로다발, 뇌량체부, 우측 쐐기전소엽이랑에서 분할 비등방도가 유의하게 감소 하였다. 화소기반 형태분석에서는 양측 갈고리다발, 좌측 부해마회의 백질, 우측 대상다발에서 추가적으로 분할 비등 방도가 감소되어 있었다. 경도의 알츠하이머 환자군과 경도인지장애 환자군의 비교, 경도인지장애 환자군과 건강한 노인군의 비교연구에서는 분할 비등방도의 유의한 차이는 없었다.
결론: Tract-based spatial statistics 분석결과, 경도의 알츠하이머 환자군에서 건강한 노인군에 비해 뇌 백질의 분할 비등방도가 여러 곳에서 감소되어 있었다. 화소기반 형태분석방법은 tract-based spatial statistics보다 더 많은 곳에서 뇌 백질의 이상을 보였다. 그러나, 인공물 또한 더 많이 관찰되었다.
대한자기공명의과학회지 16:115-123(2012)