Received on November 2, 2011. Revised on November 18, 2011. Accepted on November 23, 2011.
CC This is an open access article distributed under the terms of the Creative Commons Attribution Non-Commercial License (http://creativecommons.org/licenses/by-nc/3.0) which permits unrestricted non-commercial use, distribu- tion, and reproduction in any medium, provided the original work is properly cited.
*Corresponding Author. Tel: 82-2-740-8915; Fax: 82-2-743-5530; E-mail: doohyun@snu.ac.kr Keywords: NKT cells, conventional T cells, Microarray, GSEA
Comparison of Invariant NKT Cells with Conventional T Cells by Using Gene Set Enrichment Analysis (GSEA)
Sae Jin Oh, Ji Ye Ahn and Doo Hyun Chung*
Department of Pathology, Laboratory of Immune Regulation in Department of Biomedical Sciences, Seoul National University College of Medicine, Seoul 110-799, Korea
Background: Invariant Natural killer T (iNKT) cells, a distinct subset of CD1d-restricted T cells with invariant Vαβ TCR, functionally bridge innate and adaptive immunity. While iNKT cells share features with conventional T cells in some func- tional aspects, they simultaneously produce large amount of Th1 and Th2 cytokines upon T-cell receptor (TCR) ligation.
However, gene expression pattern in two types of cells has not been well characterized. Methods: we performed com- parative microarray analyses of gene expression in murine iNKT cells and conventional CD4+CD25−γδTCR− T cells by using Gene Set Enrichment Analysis (GSEA) method.
Results: Here, we describe profound differences in gene ex- pression pattern between iNKT cells and conventional CD4+CD25−γδTCR− T cells. Conclusion: Our results pro- vide new insights into the functional competence of iNKT cells and a better understanding of their various roles during immune responses.
[Immune Network 2011;11(6):406-411]
INTRODUCTION
Natural killer T (NKT) cells express both natural killer re- ceptors and semi-invariant T-cell receptors (TCRs). These cells recognize glycolipids presented by CD1d, a MHC class I-like protein expressed by antigen presenting cells, and ex- press limited αβT cell receptors (TCRs) (1). Upon activation of NKT cells through TCR ligation, NKT cells produce a large amount of various cytokines such as interferon (IFN)-γ, in- terleukin (IL)-4, IL-10 and IL-13, which contribute to bridging
innate and adaptive immune responses (2,3). NKT cells are heterogeneous in terms of TCR expression pattern and classi- fied into invariant type I NKT cells expressing a specific Valpha chain of TCR (Vα14-Jα18 in mice and Vα24-JαQ in humans) and type II NKT cells that express more diverse TCR (4). Functionally, iNKT cells are activated upon stim- ulation with alpha-galactosylceramide (α-GalCer). Many studies have been focusing on the functions of iNKT cells rather than type II NKT cells. Therefore, iNKT cells have been implicated in in various immune diseases in autoimmunity transplantation, infection, and tumor surveillance (5-8). The iNKT cells express both TCRs and natural killer receptors on cell surface. Therefore, iNKT cells share characters of NK and T cells in terms of functions and expression patterns of vari- ous markers. Nevertheless, gene expression pattern of iNKT cells and conventional T cells has not been well characterized so far. To address this, we performed comparative microarray analyses of murine iNKT cells and conventional CD4+CD25− γδCR− T cells.
MATERIALS AND METHODS Animals
B6 mice were purchased from the Orient Company (Seoul, Korea). Mice were bred and maintained under specific patho- gen-free conditions at the Clinical Research Institute of Seoul National University Hospital (CRISNUH), Seoul, Korea. All an- imal experimental protocols were approved by the Institutio- nal Animal Care and Use Committee (IACUC) at CRISNUH.
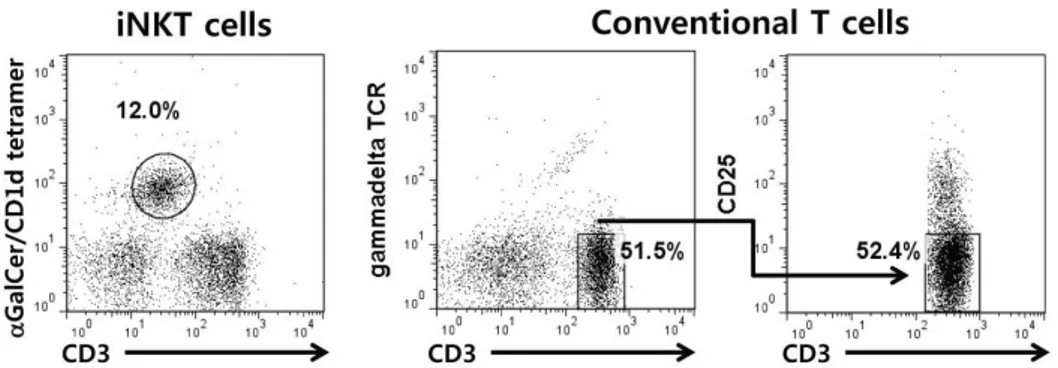
Figure 1. Sorting iNKT and conventional T cells by flow cytometery. iNKT cells in the liver from wild type B6 mice were sorted by staining with anti-CD3 and α-GalCer/CD1d tetramer. Conventional T cells in the lymph nodes were sorted by staining with anti-CD3, CD25 and γδTCR antibodies.
Cell preparation
B6 mice were sacrificed to isolate iNKT cells and conven- tional T cells, and their livers were homogenized, re- suspended in RPMI media containing 33% Percoll density gra- dient medium (GE Healthcare BioScience, Piscataway, NJ), and centrifuged for 15 min at 2,000 rpm at 25oC. The mono- nuclear cells (MNCs) were retrieved, washed with PBS, and stained with fluorescein isothiocyanate (FITC)-conjugated mAb specific for CD3 (BD Biosciences, San Jose, CA) and allophycocyanin (APC)-conjugated CD1d/α-GalCer tetramer (National Institutes of Health Tetramer Core Facility, Bethesda, MD). The lymph nodes were homogenized, re- suspended in PBS, and stained with FITC-conjugated mAb specific for CD3, phycoerythrin (PE)-conjugated mAb specific for CD25 (BD Biosciences, San Jose, CA) and PE-conjugated mAb specific for γδTCR (BD Biosciences, San Jose, CA).
The stained cells were then sorted on a BD FACSAria flow cytometer (Franklin Lakes, NJ). The sorted CD3+ CD1d/α -GalCer tetramer+ iNKT cells and CD3+CD25−γδTCR− conventional T cells were isolated at >98% purity.
RNA extraction
Total cellular RNA from the sorted NKT cells and conven- tional T cells was extracted by RNeasy Mini Prep kit (Qiagen, Valencia, CA), as the manufacturer’s instructions, and then used in separate microarray experiments. RNA quality, con- centration and purity were assessed by Nano spectropho- tometer (Thermospectronics, Rochester, NY).
Labeling and purification
Total RNA was amplified and purified using the Ambion
Illumina RNA amplification kit (Ambion, Austin, USA) to yield biotinylated cDNA according to the manufacturer’s instruc- tions. Briefly, 550 ng of total RNA was reverse-transcribed to cDNA using a T7 oligo (dT) primer. Second-strand cDNA was synthesized, in vitro transcribed, and labeled with biotin-NTP.
After purification, the cDNA was quantified using the ND-1000 Spectrophotometer (NanoDrop, Wilmington, USA).
Hybridization and data export
750 ng of labeled cDNA samples were hybridized to each mouse-8 expression bead array for 16∼18 h at 58oC, accord- ing to the manufacturer’s instructions (Illumina Inc., San Diego, USA). Detection of array signal was carried out using Amersham fluorolink streptavidin-Cy3 (GE Healthcare Bio- Sciences, Little Chalfont, UK) following the bead array manual. Arrays were scanned with an Illumina bead array Reader confocal scanner according to the manufacturer's instructions. Array data export processing and analysis was performed using Illumina BeadStudio v3.1.3 (Gene Expression Module v3.3.8).
Raw data preparation and statistic analysis The quality of hybridization and overall chip performance were monitored by visual inspection of both internal quality control checks and the raw scanned data. Raw data were ex- tracted using the software provided by the manufacturer (Illumina GenomeStudio v2009.2 [Gene Expression Module v1.5.4]). Array data were filtered by detection p value <0.05 (similar to signal to noise) in 50 % of total samples (we ap- plied a filtering criterion for data analysis; higher signal value was required to obtain a detection p value <0.05). Selected gene signal value was transformed by logarithm and normal-
Figure 2. Microarray results show the number of statically significant up and down-regulated genes in iNKT cells compared with conventional T cells (p value<0.05), |fold|≥2).
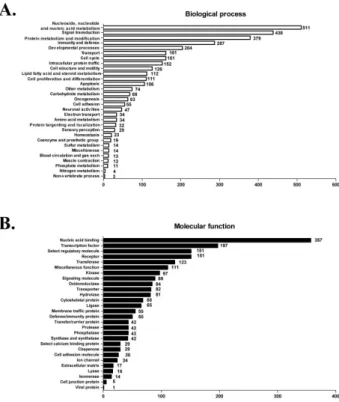
Figure 3. Differentially expressed genes in iNKT cells compared with conventional T cells identified by GSEA. (A) Biological process category and (B) molecular function category were subdivided into various pathways. The numbers of up- or down- regulated genes were analyzed.
ized by quantified method. The independent LPE test con- firmed that no difference exists between mean of groups in the data.
False discovery rate (FDR) was controlled by adjusting p value using Benjamini-Hochberg algorithm. Go-ontology anal- ysis for significant probe list was performed using PANTHER (http://www.pantherdb.org/panther/ontologies.jsp), using text files containing Gene ID list and accession number of illumina probe ID. Gene Set Enrichment Analysis (GSEA) was per- formed whether a priori defined set of genes shows differ- entially pattern both biological process and molecular func- tion states. One-tail Fisher Exact is adopted to measure the gene-enrichment in annotation terms.
RESULTS
To compare iNKT cells with conventional T cells in terms of specific gene expression, we sorted CD3+α-Galcer tetramer+ iNKT cells in the liver and CD3+CD25−γδTCR− cells in the lymph nodes from B6 mice. To rule out the contamination of conventional T cells with CD4+CD25+ regulatory and γδ T cells, we sorted CD25- or −γδTCR-positive cells out from conventional T cells (Fig. 1). Among the analyzed 11,866 genes, 2307 gene expression differed between iNKT and con- ventional T cells. 1163 gene expression was up-regulated, whereas 1144 genes were down- regulated in iNKT cells com- pared with conventional T cells (Fig. 2).
The GSEA method using 2 datasets provided differential ex- pression of numerous genes in each biological process path- way and molecular function pathway in two target T cell groups (Fig. 3A and B). In general biological pathway, nu- cleoside, nucleotide, nucleic acid metabolism, signal trans-
duction, protein metabolism and modification, developmental process, immunity, defense, intracellular protein traffic, and intracellular protein traffic-related gene expression were sig- nificantly different between iNKT cells and conventional T cells. In molecular function-related genes, nucleic acid bind- ing, transcription factor, select regulatory molecule, trans- ferase, receptor, and hydrolase and kinase were differentially expressed (Fig. 3B).
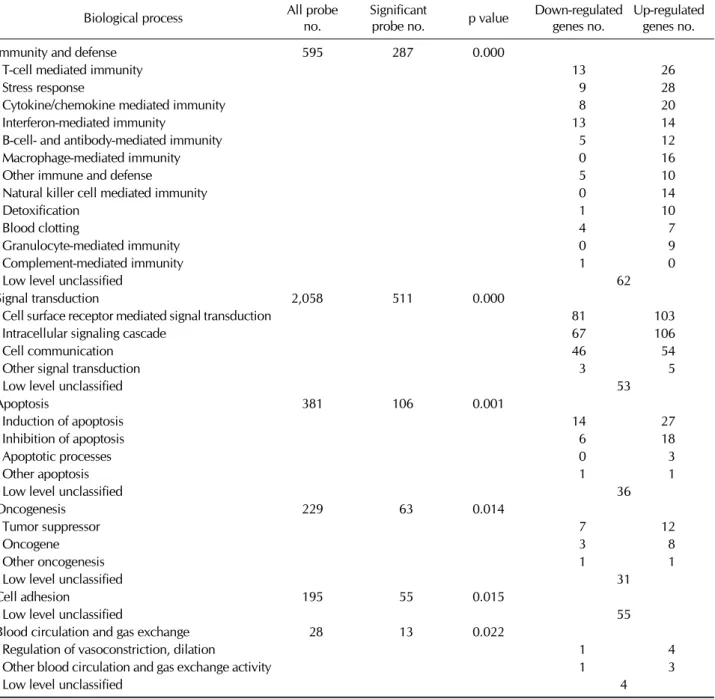
Several categories that showed statistically significant differ- ences between two groups in the microarray data were more evaluated. These categories included immunity and defense, signal transduction, apoptosis, oncogenesis, cell adhesion and blood circulation and gas exchange related genes (Table I).
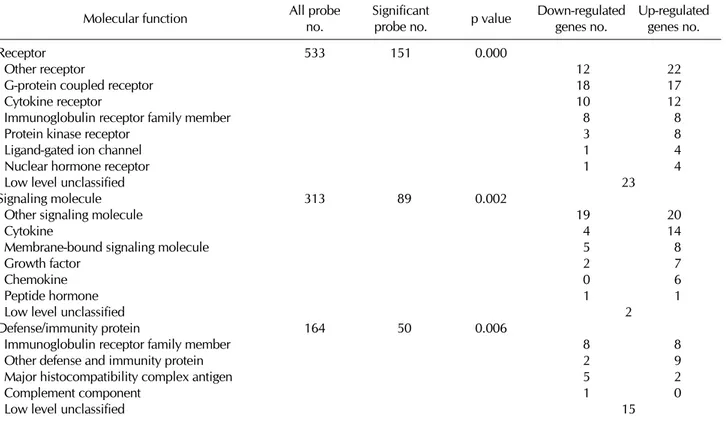
Among them, iNKT cells differentially expressed immunity and defense-related genes from conventional T cells com- pared with other categories. In molecular aspect, genes that are related with receptors, signaling molecules and defense and immunity proteins showed significant differential ex- pression between two types of cells (Table II). In immunity
Table I. The lists of genes with significant biological process categories between iNKT cells and conventional T cells
Biological process All probe
no.
Significant
probe no. p value Down-regulated genes no.
Up-regulated genes no.
Immunity and defense T-cell mediated immunity Stress response
Cytokine/chemokine mediated immunity Interferon-mediated immunity
B-cell- and antibody-mediated immunity Macrophage-mediated immunity Other immune and defense
Natural killer cell mediated immunity Detoxification
Blood clotting
Granulocyte-mediated immunity Complement-mediated immunity Low level unclassified
Signal transduction
Cell surface receptor mediated signal transduction Intracellular signaling cascade
Cell communication Other signal transduction Low level unclassified Apoptosis
Induction of apoptosis Inhibition of apoptosis Apoptotic processes Other apoptosis Low level unclassified Oncogenesis
Tumor suppressor Oncogene Other oncogenesis Low level unclassified Cell adhesion
Low level unclassified
Blood circulation and gas exchange Regulation of vasoconstriction, dilation
Other blood circulation and gas exchange activity Low level unclassified
595
2,058
381
229
195 28
287
511
106
63
55 13
0.000
0.000
0.001
0.014
0.015 0.022
13 9 8 13 5 0 5 0 1 4 0 1
81 67 46 3
14 6 0 1
7 3 1
1 1
62
53
36
31 55
4 26 28 20 14 12 16 10 14 10 7 9 0
103 106 54 5
27 18 3 1
12 8 1
4 3
and defense category of biological process category, macro- phage-, natural killer cells-, glanulocyte-mediated im- munity-related genes were up-regulated in iNKT cells com- pared with conventional T cells. Interestingly, iNKT cells up-regulated the genes that are related with chemokines com- pared with conventional T cells, suggesting that iNKT cells might be functionally regulated by enhancing chemo-
kine-related proteins in immune system. Moreover, genes controlling cell apoptosis also up-regulated in iNKT cells com- pared with conventional T cells.
DISCUSSION
The iNKT cells express both TCRs and natural killer receptors
Table II. The lists of genes with significant molecular function categories between iNKT cells and conventional T cells.
Molecular function All probe
no.
Significant
probe no. p value Down-regulated genes no.
Up-regulated genes no.
Receptor Other receptor
G-protein coupled receptor Cytokine receptor
Immunoglobulin receptor family member Protein kinase receptor
Ligand-gated ion channel Nuclear hormone receptor Low level unclassified Signaling molecule Other signaling molecule Cytokine
Membrane-bound signaling molecule Growth factor
Chemokine Peptide hormone Low level unclassified Defense/immunity protein
Immunoglobulin receptor family member Other defense and immunity protein Major histocompatibility complex antigen Complement component
Low level unclassified
533
313
164
151
89
50
0.000
0.002
0.006
12 18 10 8 3 1 1
19 4 5 2 0 1
8 2 5 1
23
2
15 22 17 12 8 8 4 4
20 14 8 7 6 1
8 9 2 0
on cell surface. The iNKT cells share characters of NK and T cells in terms of functions and expression patterns of vari- ous markers. Therefore, to characterize gene expression pat- tern of iNKT cells and conventional T cells, we performed microarray analysis.
We identified that a number of genes are differentially ex- pressed between iNKT cells and conventional T cells (Fig. 2).
To validate gene expression pattern and levels in our experi- ments, we estimated cytokine expression levels of IFN-γ, IL-4 and TNF-α which has been well known cytokines pro- duced by iNKT cells upon TCR stimulation (2,9,10).
Consistent with cytokine production pattern in activated iNKT cells, significantly up-regulated IFN-γ (113-fold), IL-4 (46-fold), and TNF-α (7-fold) expression levels were de- tected in iNKT cells, as compared with conventional T cells.
Genetic comparative methodologies have been developed and modified recently. The GSEA is a popular computational method to use for identifying differentially expressed genes that share some characteristic (11,12). Moreover, GSEA is also useful in analyzing related genes that have the same charac- teristic in the dataset. Therefore, GSEA method was used for
our experiments to precisely compare two T cell subsets. The results of GSEA are consistent with innate-related functions of iNKT cells rather than conventional T cells (13).
In conclusion, iNKT cells differ from conventional T cells in terms of immune and defense-related gene expression, which might support that iNKT cells is a distinct subset of T cells by bridging innate and adaptive immunity.
ACKNOWLEDGEMENTS
The authors thank all members of the Department of Experi- mental Animals at the Clinical Research Institute of Seoul National University Hospital for animal management, and the tetramer facility at the Nation Institutes of Health, USA for providing CD1d tetramers loaded with PBS-57. This work was supported by a National Research Foundation of Korea (NRF) grant funded by the Korean Government (2010-0017890).
CONFLICTS OF INTEREST
The authors have no financial conflict of interest.
REFERENCES
1. Bendelac A, Lantz O, Quimby ME, Yewdell JW, Bennink JR, Brutkiewicz RR: CD1 recognition by mouse NK1+ T lymphocytes. Science 268;863-865, 1995.
2. Chen H, Paul WE: Cultured NK1.1+ CD4+ T cells produce large amounts of IL-4 and IFN-gamma upon activation by an- ti-CD3 or CD1. J Immunol 159;2240-2249, 1997.
3. Mendiratta SK, Martin WD, Hong S, Boesteanu A, Joyce S, Van Kaer L: CD1d1 mutant mice are deficient in natural T cells that promptly produce IL-4. Immunity 6;469-477, 1997.
4. Godfrey DI, Stankovic S, Baxter AG: Raising the NKT cell family. Nat Immunol 11;197-206, 2010.
5. Kim JH, Kim HY, Kim S, Chung JH, Park WS, Chung DH:
Natural killer T (NKT) cells attenuate bleomycin-induced pul- monary fibrosis by producing interferon-gamma. Am J Pathol 167;1231-1241, 2005.
6. Kim HY, Kim HJ, Min HS, Kim S, Park WS, Park SH, Chung DH: NKT cells promote antibody-induced joint inflammation by suppressing transforming growth factor beta1 production.
J Exp Med 201;41-47, 2005.
7. Oh SJ, Chung DH: Invariant NKT cells producing IL-4 or IL-10, but not IFN-gamma, inhibit the Th1 response in ex- perimental autoimmune encephalomyelitis, whereas none of
these cells inhibits the Th17 response. J Immunol 186;
6815-6821, 2011.
8. Hwang SJ, Kim S, Park WS, Chung DH: IL-4-secreting NKT cells prevent hypersensitivity pneumonitis by suppressing IFN-gamma-producing neutrophils. J Immunol 177;5258-5268, 2006.
9. Kronenberg M: Toward an understanding of NKT cell biol- ogy: progress and paradoxes. Annu Rev Immunol 23;877-900, 2005.
10. Bendelac A, Savage PB, Teyton L: The biology of NKT cells.
Annu Rev Immunol 25;297-336, 2007.
11. Keller A, Backes C, Lenhof HP: Computation of significance scores of unweighted Gene Set Enrichment Analyses. BMC Bioinformatics 8;290, 2007.
12. Subramanian A, Tamayo P, Mootha VK, Mukherjee S, Ebert BL, Gillette MA, Paulovich A, Pomeroy SL, Golub TR, Lander ES, Mesirov JP: Gene set enrichment analysis: a knowl- edge-based approach for interpreting genome-wide ex- pression profiles. Proc Natl Acad Sci U S A 102;15545-15550, 2005.
13. Taniguchi M, Seino K, Nakayama T: The NKT cell system:
bridging innate and acquired immunity. Nat Immunol 4;1164-1165, 2003.