• 검색 결과가 없습니다.

Rapid Eye Movement-Related Obstructive Sleep Apnea: A Study on the Pathogenesis through Clinical and Polysomnographic Features JOMP

N/A
N/A
Protected

Academic year: 2021

Share "Rapid Eye Movement-Related Obstructive Sleep Apnea: A Study on the Pathogenesis through Clinical and Polysomnographic Features JOMP"

Copied!
8
0
0

로드 중.... (전체 텍스트 보기)

전체 글

(1)

pISSN 2288-9272 eISSN 2383-8493 J Oral Med Pain 2016;41(4):180-187 https://doi.org/10.14476/jomp.2016.41.4.180

Rapid Eye Movement-Related Obstructive Sleep Apnea: A Study on the Pathogenesis through Clinical and Polysomnographic Features

Ji Hee Jang, Jin Woo Chung

Department of Oral Medicine and Oral Diagnosis, School of Dentistry and Dental Research Institute, Seoul National University, Seoul, Korea

Received December 1, 2016 Revised December 12, 2016 Accepted December 12, 2016

Purpose: The aims of this study were to evaluate the differences of clinical and polysomno- graphic features between rapid eye movement (REM)-related obstructive sleep apnea (OSA) and not-REM-related OSA, and to suggest the pathogenesis according to the REM dependency of OSA.

Methods: One hundred ninety consecutive patients diagnosed with OSA were evaluated clini- cal features and performed full night polysomnography. The patients were divided into REM- related (REM apnea-hypopnea index [AHI] at least two times higher than their non-REM AHI) and not-REM-related (a REM AHI less than two times higher than their non-REM AHI) OSA groups and evaluated the differences in age, body mass index (BMI), neck circumference, Ep- worth Sleepiness Scale score, and parameters of polysomnography.

Results: REM-related patients were younger and showed higher sleep efficacy, low percentage of light sleep stage (stage 1 sleep), and low rate of positional OSA. Age was significantly asso- ciated with REM dependency of OSA and REM AHI were significant correlated with BMI, neck circumference, percentage of sleep in supine position, and percentage time of snoring.

Conclusions: Our results showed that REM-related OSA patients showed less severe polysomno- graphic parameters than not-REM-related patients. However, significant risk factors were dif- fered depending on the REM dependency and OSA severity, and the clinical features correlated with REM AHI and non-REM AHI were also showed differently. We suggest that the occurrence of OSA according to the REM dependency can be based on different mechanisms.

Key Words: Age; Obstructive sleep apnea; Polysomnography; Rapid eye movement; Sleep position

Correspondence to:

Jin Woo Chung

Department of Oral Medicine and Oral Diagnosis, School of Dentistry and Dental Research Institute, Seoul National University, 101 Daehak-ro, Jongno-gu, Seoul 03080, Korea Tel: +82-2-2072-3021 Fax: +82-2-744-9135 E-mail: [email protected]

JOMP Journal of Oral Medicine and Pain

Copyright Ⓒ 2016 Korean Academy of Orofacial Pain and Oral Medicine. All rights reserved.

CC

This is an open-access article distributed under the terms of the Creative Commons Attribution Non-Commercial License (http://creativecommons.org/licenses/by-nc/4.0/),

INTRODUCTION

Sleep-related breathing disorders (SRBD) are characterized by abnormal ventilation that occurs during sleep, and ob- structive sleep apnea (OSA)—characterized by repeated par- tial or complete collapse of the upper airway—is one of its representative forms. 1) Continuation of insufficient oxygen supply during sleep from SRBD can result in serious health issues including excessive daytime sleepiness, reduced cog- nitive function, and increased risk of cardiovascular diseas- es. Therefore, if the patient is aware that he or she may be

having SRBD, he or she must be diagnosed with appropriate standards and treated accordingly. 2)

The gold standard for diagnosing OSA is polysomnogra- phy (PSG). The apnea-hypopnea index (AHI), representing the number of apneas and hypopneas per hour, is also used to diagnose and determine the severity of OSA.

Rapid eye movement (REM) sleep is the important stage

in the sleep cycle, and is characterized by axial muscu-

lar hypotonia and reduced activation of the genioglossus

muscle. 3) Therefore, the risk of apnea event can be increased

is during this stage, because of the airway collapse from

(2)

deactivation of the pharyngeal dilator muscle. The patient who exhibits a more than two-fold increase in AHI dur- ing this stage compared to non-REM (NREM) sleep stage is defined as REM-related OSA patient. However, not all OSA patients exhibit higher AHI during REM sleep stage, and in some patients, observed AHI is higher during NREM sleep stage. OSA patients exhibit different sleeping characteris- tics, and their response to the same treatment may vary ac- cording to their sleeping characteristics. Based on these ob- servations, Ayas et al. 4) suggest that OSA should be consid- ered a complex, heterogeneous disorder.

The aims of this study were to evaluate the clinical and polysomnographic characteristics of REM-related and not- REM-related OSA patients, and to discuss the pathogenesis of OSA according to REM dependency.

MATERIALS AND METHODS

1. Subjects

One hundred ninety consecutive patients who visited the Snoring and Sleep Apnea Clinic, Department of Oral Medicine in Seoul National University Dental Hospital (Seoul, Korea) complaining of snoring or sleep apnea were evaluated. The patients diagnosed as OSA based on an AHI

≥5 were included and who had the history of major surgery on the orofacial region were excluded in this study. The study was approved by the Institutional Review Board of Seoul National University Hospital (CRI 14037).

2. Clinical Features

Each patient was measured neck circumference and body mass index (BMI) calculated with body weight and height.

The daytime sleepiness of each subject was examined using the Epworth Sleepiness Scale (ESS) questionnaire.

3. Polysomnography Evaluation and Diagnostic Criteria Multi-channel recordings of electroencephalogram (EEG), submental and leg electromyogram (EMG), electrocardio- gram (ECG), nasal thermistor, nasal pressure transducer, tho- racic and abdominal piezoelectric belts, and oxygen satura- tion were conducted using Alice 5 (Respironics, Pittsburgh, PA, USA) PSG. Body position was also confirmed through

direct observation of the patient by the technician using a low light camera and simultaneous digital recording with a posture tag at the thoracic piezoelectric belt.

Sleep was staged by an eligible sleep specialist and respi- ratory events were scored using the standard criteria of the American Academy of Sleep Medicine. Briefly, apnea was defined as a reduction in airflow greater than 90% with a duration of at least 10 seconds in which there was persis- tent respiratory effect, whereas hypopnea was defined as a reduction of airflow by 30% for more than 10 seconds ac- companied by oxygen desaturation ≥3%. 5)

The patients were divided into REM-related and not- REM-related OSA groups. These criteria state that REM- related OSA (REM OSA) patients have a REM AHI at least two times higher than their NREM AHI, and not-REM-relat- ed (not-REM OSA) patients will have a REM AHI less than two times higher than their NREM AHI.

Additionally, subjects were categorized into positional and non-positional OSA patients following the criteria sug- gested by Cartwright. 6) Positional OSA patients have a su- pine AHI at least two times higher than their lateral AHI, and non-positional patients will have a supine AHI less than two times higher than their lateral AHI.

4. Statistical Analysis

Differences between REM-related and not-REM-related OSA groups in clinical features (age, BMI, neck circum- ference, and ESS score), and results of PSG evaluation (AHIs, arousal indices, oxygen saturation, duration of each sleep stage, and percentage time of supine position during sleep) were analyzed with the independent t-test or Mann- Whitney test.

Multiple logistic regression analyses on the each inde- pendent variable including age, gender, ESS score, neck cir- cumference, and BMI were performed to evaluate the im- pact factors on REM dependency and OSA severity.

Correlations among clinical features, AHIs, percentage time of supine position, and percentage time of snoring were evaluated using Spearman’s correlation test.

All statistical analyses were performed with the IBM SPSS

Statistics version 23.0 software program (IBM Co., Armonk,

NY, USA).

(3)

RESULTS

1. Demographic and Clinical Features

This study was performed with 190 patients, where 34 (17.9%) were women and 156 (82.1%) were men. The aver- age age of the subjects was 45.5±13.3 years (range, 18-82 years).

One record for BMI and 43 records for neck circumfer- ence were missing. Therefore, the analyses for BMI and neck circumference were performed on 189 and 147 sub- jects, respectively. The average values for BMI and neck cir- cumference were 25.3±3.3 kg/m 2 and 37.8±3.8 cm, respec- tively. ESS score was available for 188 subjects, and the av- erage score was 8.2±4.4.

Comparing the results between the REM OSA group and not-REM OSA group according to REM dependency, the average age of REM OSA patients (40.3±11.8 years) was statistically significantly lower than that of not-REM OSA patients (47.9±13.3 years). Other results—the ratio of wom- en to men, ESS score, neck circumference, and BMI—were

similar between REM OSA patients and not-REM OSA pa- tients or had slightly lower values in the REM OSA group, but was not statistically significant (Table 1).

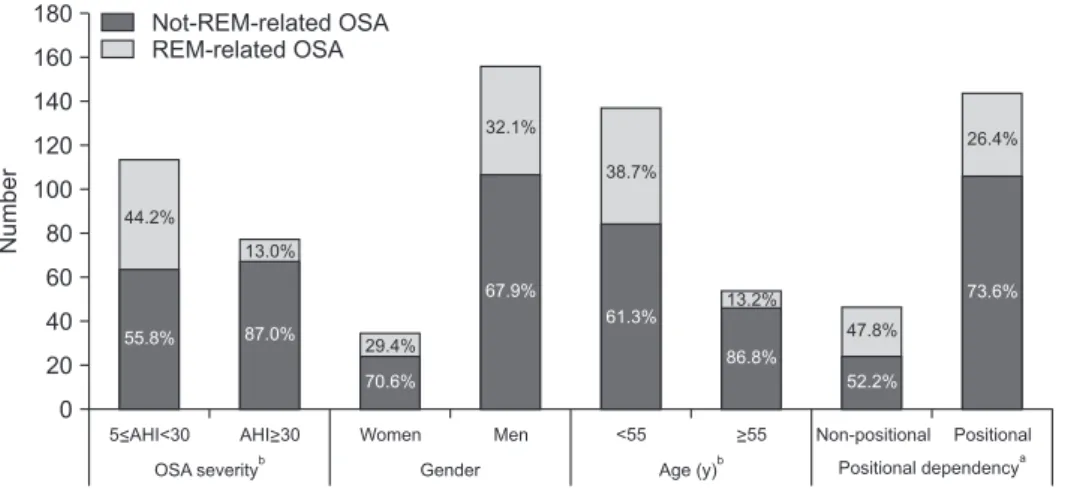
The proportion of REM OSA patients was 44.2% in 5≤AHI<30 group and 13.0% in AHI ≥30 group, with a sig- nificantly higher proportion of REM OSA patients in the mild to moderate group, based on OSA severity (p<0.001).

The proportion of REM OSA patients was 29.4% in the female group and 32.1% in the male group, indicating that there is no significant difference in the proportion of REM OSA patient based on gender.

When the subjects were divided into two groups based on age, the proportion of REM OSA patients was 38.7% in age

<55 group and 13.2% in age ≥55 group. The proportion of REM OSA based on age group was significantly higher in age <55 group (p<0.001) (Fig. 1).

2. Polysomnographic Features

PSG results were analyzed for all 190 subjects in the study. However, some subjects had missing records for

Fig. 1. Percentage of REM-related OSA according to OSA severity, gender, age, and sleep posture. REM, rapid eye movement; OSA, obstructive sleep apnea; AHI, apnea-hypopnea index;

Non-positional, non-positional OSA;

Positional, positional OSA.

a

Chi-square test, p<0.01.

b

Chi-square test, p<0.001.

180 160 140 120 100 80 60 40 20 0

Number

Not-REM-related OSA REM-related OSA

Women Men <55 Non-positional Positional

OSA severity

b

Gender Age (y)

b

Positional dependency

a

5<AHI<30 AHI>30 >55

44.2%

55.8%

13.0%

87.0%

29.4%

70.6%

32.1%

67.9%

38.7%

61.3% 13.2%

86.8%

47.8%

52.2%

26.4%

73.6%

Table 1. Demographic and clinical features of OSA patients according to REM dependency

Variable Total REM dependency

REM-related Not-REM-related p-value

Gender (women, %) 17.9 16.7 18.5 0.764

a

Age (y) 45.5±13.3 40.3±11.8 47.9±13.3 <0.001

b

BMI (kg/m

2

) 25.3±3.3 25.2±3.7 25.3±3.1 0.828

b

Neck circumference (cm) 37.8±3.8 37.0±4.0 38.1±3.7 0.207

c

ESS score 8.2±4.4 8.2±3.9 8.2±4.7 0.753

c

OSA, obstructive sleep apnea; REM, rapid eye movement; BMI, body mass index; ESS, Epworth Sleepiness Scale.

Values are presented as mean±standard deviation.

a

p-values were obtained from chi-square test.

b

p-values were obtained from independent t-test.

c

p-values were obtained from Mann-

Whitney.

(4)

different categories including sleep latency, REM latency, and O 2 saturation. Therefore, the total number of subjects varies between different categories.

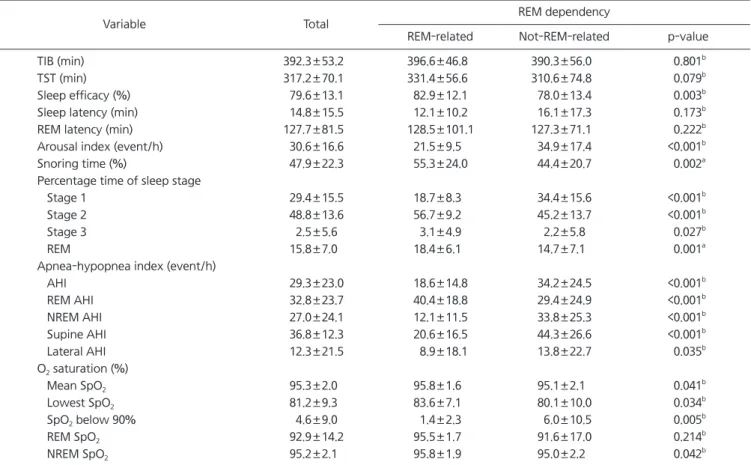
The REM OSA group showed higher sleep efficacy, lower sleep latency, lower percentage of sleep stage 1 time, high- er percentage of sleep stage 2 and REM time, lower AHI, higher O 2 saturation during sleep, lower arousal index, and higher percentage of snoring time compared to the not- REM OSA group. For the AHIs according to sleep position, AHI during supine position (supine AHI) was higher than AHI during lateral position (lateral AHI) in all groups (Table 2).

Fig. 1 shows the proportion of REM OSA according to positional dependency. The proportions of REM OSA were 26.4% in the positional OSA group and 47.8% in the non- positional OSA group. The proportion of REM OSA accord- ing to positional dependency was significantly higher in the

non-positional OSA group (p=0.006) (Fig. 1).

Fig. 2 shows the percentage time of each sleep stage ac- cording to OSA severity. In the mild to moderate OSA pa- tients (5≤AHI<30), the percentage time of each sleep stage for REM OSA group was 18.0% for REM, 18.5% for stage 1, 56.7% for stage 2, and 3.4% for stage 3 sleeps. For not- REM OSA group, the percentage time of each sleep stage was 15.2% for REM, 26.5% for stage 1, 51.8% for stage 2, and 2.5% for stage 3 sleeps. In the mild to moderate OSA patients, the percentage times of REM (p=0.027), stage 1 (p<0.001), and stage 2 (p=0.002) sleeps were significantly different according to REM dependency. In the severe OSA patients (AHI ≥30), the percentage time of each sleep stage for REM OSA group was 20.7% for REM, 19.5% for stage 1, 56.8% for stage 2, and 1.5% for stage 3 sleeps. For not- REM OSA group, the percentage time of each sleep stage

Table 2. Polysomnographic features of OSA patients according to REM dependency

Variable Total REM dependency

REM-related Not-REM-related p-value

TIB (min) 392.3±53.2 396.6±46.8 390.3±56.0 0.801

b

TST (min) 317.2±70.1 331.4±56.6 310.6±74.8 0.079

b

Sleep efficacy (%) 79.6±13.1 82.9±12.1 78.0±13.4 0.003

b

Sleep latency (min) 14.8±15.5 12.1±10.2 16.1±17.3 0.173

b

REM latency (min) 127.7±81.5 128.5±101.1 127.3±71.1 0.222

b

Arousal index (event/h) 30.6±16.6 21.5±9.5 34.9±17.4 <0.001

b

Snoring time (%) 47.9±22.3 55.3±24.0 44.4±20.7 0.002

a

Percentage time of sleep stage

Stage 1 29.4±15.5 18.7±8.3 34.4±15.6 <0.001

b

Stage 2 48.8±13.6 56.7±9.2 45.2±13.7 <0.001

b

Stage 3 2.5±5.6 3.1±4.9 2.2±5.8 0.027

b

REM 15.8±7.0 18.4±6.1 14.7±7.1 0.001

a

Apnea-hypopnea index (event/h)

AHI 29.3±23.0 18.6±14.8 34.2±24.5 <0.001

b

REM AHI 32.8±23.7 40.4±18.8 29.4±24.9 <0.001

b

NREM AHI 27.0±24.1 12.1±11.5 33.8±25.3 <0.001

b

Supine AHI 36.8±12.3 20.6±16.5 44.3±26.6 <0.001

b

Lateral AHI 12.3±21.5 8.9±18.1 13.8±22.7 0.035

b

O

2

saturation (%)

Mean SpO

2

95.3±2.0 95.8±1.6 95.1±2.1 0.041

b

Lowest SpO

2

81.2±9.3 83.6±7.1 80.1±10.0 0.034

b

SpO

2

below 90% 4.6±9.0 1.4±2.3 6.0±10.5 0.005

b

REM SpO

2

92.9±14.2 95.5±1.7 91.6±17.0 0.214

b

NREM SpO

2

95.2±2.1 95.8±1.9 95.0±2.2 0.042

b

OSA, obstructive sleep apnea; REM, rapid eye movement; TIB, total in bed; TST, total sleep time; AHI, apnea-hypopnea index; NREM, non- REM.

REM AHI, AHI during REM sleep; NREM AHI, AHI during NREM sleep; Supine AHI, AHI during supine position; Lateral AHI, AHI during lateral position; SpO

2

below 90%, percent of total sleep time with O

2

saturation below 90%.

Values are presented as mean±standard deviation.

a

p-values were obtained from independent t-test.

b

p-values were obtained from Mann-Whitney test.

(5)

was 14.1% for REM, 41.9% for stage 1, 39.0% for stage 2, and 1.9% for stage 3 sleeps. In the severe group, the per- centage times of REM (p=0.011), stage 1 (p<0.001), stage 2 (p<0.001) sleeps were significantly different according to REM dependency (Fig. 2).

3. Impacts of Risk Factors on REM-Related OSA

Table 3 shows the risk factors of REM OSA. In the logistic regression analysis by adding age, sex, ESS score, neck cir- cumference, and BMI, the results indicated that age (β=–0.04, p=0.003) was a statistically significant contributing factor

(Table 3).

Table 4 shows the risk factors of OSA severity. Age (β=0.031, p=0.028), gender (β=–1.89, p=0.003), and neck cir- cumference (β=0.397, p<0.001) were statistically significant contributing factors (Table 4).

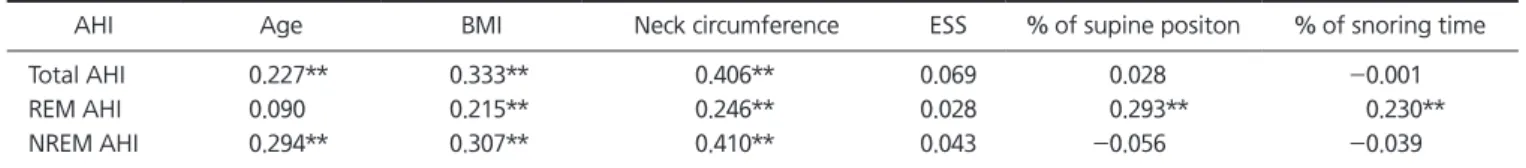
4. Correlation between Each Clinical Features and AHI BMI, neck circumference, percentage of supine position, and percentage of snoring time were significantly correlat- ed with REM AHI. Age, BMI, and neck circumference were significantly correlated with NREM AHI (Table 5).

Fig. 2. Distribution of sleep stage accor- ding to OSA severity. OSA, obstructive sleep apnea; REM, rapid eye movement;

REM OSA, REM-related OSA; Not-REM OSA, not-REM-related OSA; AHI, apnea- hypopnea index.

a

t-test, p<0.05.

b

t-test, p<0.01.

c

Mann-Whitney test, p<0.05.

d

Mann-Whitney test, p<0.01.

100 90 80 70 60 50 40 30 20 10 0

Percentage time of sleep stage

REM OSA Total

REM

b

, stage 1 , stage 2 , stage 3

d d c

Not-REM OSA

5<AHI<30 AHI>30

REM

a

, stage 1 , stage 2

d d

REM

a

, stage 1 , stage 2

d d

REM Stage 1 Stage 2 Stage 3

3.1%

3.1%

56.7%

18.7%

18.4%

2.2%

2.2%

45.2%

34.4%

14.7%

3.4%

3.4%

56.7%

18.5%

18.0%

2.5%

2.5%

51.8%

26.5%

15.2%

1.5%

1.5%

56.8%

19.5%

20.7%

1.9%

1.9%

39.0%

41.9%

14.1%

Not-REM OSA Not-REM OSA

REM OSA REM OSA

Table 3. Logistic regression analysis of the risk factors on REM- related OSA

Predictor REM dependency

β SE β OR (95% CI) p-value

Age —0.04 0.01 0.96 (0.94-0.99) 0.003

Gender (women) 0.19 0.56 0.73 (0.41-3.61) 0.726 Neck circumference —0.07 0.06 0.94 (0.83-1.05) 0.277 REM, rapid eye movement; OSA, obstructive sleep apnea; SE, standard error; OR, odds ratio; CI, confidence interval.

R

2

=0.111.

Table 4. Logistic regression analysis of the risk factors on OSA severity

Predictor OSA severity

β SE β OR (95% CI) p-value

Age 0.031 0.014 1.03 (1.00-1.06) 0.028

Gender (women) —1.89 3.08 0.15 (0.04-0.52) 0.003 Neck circumference 0.397 0.084 1.49 (1.26-1.75) <0.001 OSA, obstructive sleep apnea; SE, standard error; OR, odds ratio; CI, confidence interval.

R

2

=0.305.

Table 5. Correlations between each clinical feature and AHI

AHI Age BMI Neck circumference ESS % of supine positon % of snoring time

Total AHI 0.227** 0.333** 0.406** 0.069 0.028 —0.001

REM AHI 0.090 0.215** 0.246** 0.028 0.293** 0.230**

NREM AHI 0.294** 0.307** 0.410** 0.043 —0.056 —0.039

AHI, apnea-hypopnea index; BMI, body mass index; ESS, Epworth Sleepiness Scale; REM, rapid eye movement; NREM, non-REM.

Spearman’ s correlation coefficient.

**p<0.01.

(6)

DISCUSSION

Through this retrospective study, we confirmed the dif- ferences in clinical and PSG results between REM OSA and not-REM OSA. Although the REM OSA group was signifi- cantly younger than the not-REM OSA group, there was no significant difference in the proportion based on gender between the two groups. These results are in partial agree- ment with previous study results indicating lower average age and higher proportions of women in REM OSA groups than in not-REM OSA groups. 7,8) The proportions of wom- en in this study were 17.9% of all subjects, 16.7% of REM OSA, and 18.5% of not-REM OSA, which are lower than what had been previously reported by Koo et al. 7) More spe- cifically, the proportion of women was higher in the not- REM OSA group. Although these observations may be be- cause of a small sample size, the health-seeking behaviors of women, who visited snoring and sleep apnea clinic when they had more severe clinical symptoms, may have partially contributed to these observations.

Looking at the polysomnographic features of REM OSA and not-REM OSA, indices such as sleep architecture, and respiratory data are generally less severe for REM OSA than for not-REM OSA. Higher sleep efficacy and percentage of sleep stage 2 and lower percentage of sleep stage 1 in REM OSA indicate that not-REM OSA patients have lighter sleep than REM OSA patients do. A previous study on PSG re- sults of Korean subjects by Moon et al. 9) supports our find- ings. Observed REM AHI values were significantly higher in the REM OSA group than in the not-REM OSA group, and this is mainly due to how we define REM OSA. However, O 2 saturation was higher in the REM OSA group than in the not-REM OSA group in both REM and NREM sleep stages.

In addition, observed arousal index was lower in the REM OSA group. Based on these results, previous studies sug- gested that REM OSA is not just a category of OSA, but rather a part of the spectrum of SRBD. 10) Furthermore, our results showed a higher proportion of REM OSA in AHI

<30 group and a significantly higher proportion of not- REM OSA in AHI ≥30 group, which supports the suggestion made by the previous studies.

However, age was the only risk factor of REM dependen- cy that was validated from the logistic regression analysis

whereas several risk factors of OSA severity, including age, sex, and neck circumference, were identified from the same analysis. These findings indicate that, although limited, fac- tors that affect REM dependency and OSA severity are dif- ferent. Moreover, the proportions of REM time and sleep stages differed based on REM dependency even within the groups that were categorized based on AHI severity. These points suggest that the previous assumption of OSA sever- ity being a part of the spectrum of sleep breathing disorder, just based on the fact that average AHI values are lower in REM OSA than in not-REM OSA, can be a hasty conclusion.

So it is important to understand the pathogenesis of OSA according to REM dependency, but one question arises when considering the fact that there is reduced activity of many axial muscles, 3) including the genioglossus muscle, during REM sleep stage. If OSA occurs due to partial or complete obstruction (or collapse) of the upper airway, why do some OSA patients have higher NREM AHI values de- spite the fact that it is hard to maintain the tension of the pharynx dilator muscle during REM sleep stage (both ana- tomically and physiologically), and why do not-REM OSA patients showed worse sleep-related indices? The following previous studies may provide insight to these questions.

According to Wellman et al., 11,12) OSA occurs from insuffi- cient ventilation during sleep, and respiratory effort-related arousal occurs in response. Therefore OSA can be affected by factors such as 1) pharyngeal anatomy/collapsibility, 2) ventilatory response-to-disturbance ratio, 3) ability of the upper airway to stiffen/dilate in response to an increase in ventilatory drive, and 4) arousal threshold, and pharyngeal collapsibility is only one of several factors in OSA.

Furthermore, according to Eckert and Younes, 13) increased OSA severity results in an increased arousal threshold.

Consequently, arousal does not occur even with reduced ventilation, resulting in decreased O 2 saturation or increased AHI.

For this phenomenon, Yamauchi et al. 14) suggested that if the key factor for REM OSA is reduced upper airway mus- cle tonus, the key factor for not-REM OSA is ventilation with greater dynamic reduction that occurs before and after wakefulness induced by ventilator instability.

As shown above, various mechanisms attempt to explain

the pathogenesis of OSA. In addition, the pattern of increase

(7)

or decrease in arousal threshold, the degree of reflex of the genioglossus muscle, and response to SaO 2 or PaCO 2 vary among individuals. Therefore, one or two mechanisms may not be sufficient to explain all results observed until now.

However, a common explanation from various mechanisms is that REM OSA patients are largely affected by pharyn- geal collapsibility, while not-REM OSA patients are largely affected by factors such as ventilatory instability or arousal threshold.

Additionally, we can consider the relationship between the percentage of snoring time and REM AHI, between the percentage of supine and REM AHI, and age factor. In our study percentage of snoring time and percentage of time in supine position showed significant positive correla- tions with REM AHI but not with total AHI or NREM AHI.

Moreover, only age factor was the suggested risk factor of both OSA severity and REM dependency among other clini- cal features. These results suggest that the factors that in- crease REM AHI may be different from total AHI or NREM AHI, and several scenarios are possible based on the pre- vious studies on age as a common risk factor. First, BMI and neck circumference increase as the age increases, and consequent increased OSA severity and reduced ventila- tion results in more frequent arousal. In order to prevent sleep fragmentation from frequent arousal, arousal thresh- old is increased. Therefore, not-REM OSA increases with age. Second, there is an increased instability in the respira- tory regulation mechanism with aging, and a consequent increase/decrease of arousal threshold or loop gain 11) causes increased not-REM OSA and OSA severity. Lastly, patients may have abnormally high or low baseline arousal thresh- olds by nature, and factors, such as obesity, play a role in aging and cause not-REM OSA.

However, as mentioned above, this study cannot deter- mine these kinds of causal relationships and cannot know which of the above scenarios reflect what happens in the patients. Therefore, future studies looking at the patho- genesis of SRBD, in order to clearly identify the pathogen- esis, should not be limited to a single factor (like AHI), but should try to provide a comprehensive analysis. In addition, long-term follow up of PSG should be used to assess how the person’s sleep characteristics change with age.

In this study, ESS score was not different for either REM

dependency or OSA severity, and several previous studies support our findings. 10,15,16) Moreover, there is a case report- ed by a previous study where ESS score did not improve even though indices of PSG had improved from treatments using oral appliances such as a mandible advancement de- vice. 17) Therefore, although ESS score can assess patients’

subjective daytime sleepiness, it is hard to identify associa- tion with factors such as OSA severity or other polysomno- graphic indices.

There were several limitations of this study. The retro- spective nature of the study may have resulted in record- ing errors. Furthermore, PSG was performed only once, and potential first-time effects were not eliminated. Accurate medical histories for the subjects were not obtained, and the possibility of sleep abnormalities from underlying condi- tions or medications was not eliminated. In addition, to as- sess the risk factors for OSA severity or REM dependency, the number of investigated clinical features is too small.

Lastly, there were limitations for interpreting the results due to the usage of variables—such as BMI and neck circumfer- ence—that have a high level of correlation with each other.

In conclusion, this study confirmed that REM OSA oc- curs in younger subjects and have less severe sleep-related indices compared to not-REM OSA. However, even within a group with similar OSA severity, there was a difference in sleep architecture according to REM dependency. And there were also differences in the risk factors indicating sig- nificance according to REM dependency and OSA severity.

Therefore, it can be premature conclusion that REM OSA is a spectrum of OSA because average AHI is lower than that of not-REM OSA. And OSA requires a long-term follow up study that assesses various indices such as polysomno- graphic, encephalometric, and respiratory indices in order to accurately determine the different mechanisms according to different sleeping characteristics.

CONFLICT OF INTEREST

No potential conflict of interest relevant to this article

was reported.

(8)

REFERENCES

1. American Academy of Sleep Medicine. The international classifi- cation of sleep disorders, revised: diagnostic and coding manual.

2nd ed. Westchester (IL): American Academy of Sleep Medicine;

2005.

2. Pack AI. Advances in sleep-disordered breathing. Am J Respir Crit Care Med 2006;173:7-15.

3. Grace KP, Hughes SW, Horner RL. Identification of the mecha- nism mediating genioglossus muscle suppression in REM sleep.

Am J Respir Crit Care Med 2013;187:311-319.

4. Ayas NT, Owens RL, Kheirandish-Gozal L. Update in sleep medi- cine 2014. Am J Respir Crit Care Med 2015;192:415-420.

5. Berry RB, Budhiraja R, Gottlieb DJ, et al. Rules for scoring respi- ratory events in sleep: update of the 2007 AASM manual for the scoring of sleep and associated events. Deliberations of the Sleep Apnea Definitions Task Force of the American Academy of Sleep Medicine. J Clin Sleep Med 2012;8:597-619.

6. Cartwright RD. Effect of sleep position on sleep apnea severity.

Sleep 1984;7:110-114.

7. Koo BB, Dostal J, Ioachimescu O, Budur K. The effects of gender and age on REM-related sleep-disordered breathing. Sleep Breath 2008;12:259-264.

8. O’Connor C, Thornley KS, Hanly PJ. Gender differences in the polysomnographic features of obstructive sleep apnea. Am J Respir Crit Care Med 2000;161:1465-1472.

9. Moon HJ, Lim SH, Kim DH, Kim DE, Hwang SH, Cho YW. Clini-

cal characteristics of REM-dependent obstructive sleep apnea in Korean adults. J Korean Neurol Assoc 2016;34:124-129.

10. Haba-Rubio J, Janssens JP, Rochat T, Sforza E. Rapid eye move- ment-related disordered breathing: clinical and polysomnograph- ic features. Chest 2005;128:3350-3357.

11. Wellman A, Eckert DJ, Jordan AS, et al. A method for measuring and modeling the physiological traits causing obstructive sleep apnea. J Appl Physiol (1985) 2011;110:1627-1637.

12. Wellman A, Edwards BA, Sands SA, et al. A simplified method for determining phenotypic traits in patients with obstructive sleep apnea. J Appl Physiol (1985) 2013;114:911-922.

13. Eckert DJ, Younes MK. Arousal from sleep: implications for ob- structive sleep apnea pathogenesis and treatment. J Appl Physiol (1985) 2014;116:302-313.

14. Yamauchi M, Fujita Y, Kumamoto M, et al. Nonrapid eye move- ment-predominant obstructive sleep apnea: detection and mecha- nism. J Clin Sleep Med 2015;11:987-993.

15. Campos-Rodríguez F, Fernández-Palacín A, Reyes-Núñez N, Reina-González A. Clinical and polysomnographic features of rapid-eye-movement-specific sleep-disordered breathing. Arch Bronconeumol 2009;45:330-334.

16. Sakao S, Sakurai T, Yahaba M, et al. Features of REM-related sleep disordered breathing in the Japanese population. Intern Med 2015;54:1481-1487.

17. Oh JT, Jang JF, Chung JW. Treatment outcomes of mandibular

advancement devices between rapid-eye-movement (REM)-related

and not-REM-related OSA patients. J Oral Med Pain 2016;41:54-

60.

수치

Table 1. Demographic and clinical features of OSA patients according to REM dependency
Fig. 1 shows the proportion of REM OSA according to  positional dependency. The proportions of REM OSA were  26.4% in the positional OSA group and 47.8% in the  non-positional OSA group
Table 3. Logistic regression analysis of the risk factors on REM- REM-related OSA

참조

관련 문서

Prevalence of sleep-disordered breathing in acute ischemic stroke as determined using a portable sleep apnea monitoring device in Korean subjects.. Obstructive

Meanwhile, through utilizing the close relationship between Songbaekhoi and some other organizations such as the youth movement, cultural movement, night

또한 수면은 NREM(npn-rapid eye movement)수면과 REM(rapid eye movement)수면으로 나뉜다... 연구방법

Cephalometric comparisons of craniofacial and upper airway structure by skeletal subtype and gender in patients with obstructive sleep apnea.. Nasal

Objective : The study aim was to estimate the prevalence of sleep disturbance and depressive symptoms as well as to examine the moderating effect of

Conclusions: This study suggests that psychological health factors such as stress perception, depression and suicidal ideation are related to the quality of sleep

This study aims to analyze the process and the features of corporate e-Learning as a form of informal learning. For this purpose, the concept of

This study examined the changes of kinetic expression factors of movement through art historical approach and as a result of analyzing internal and external