Industry Analyses on the Research & Development Expenditures for
Korean Chaebol Firms
Hanjoon Kim
Division of Business Administration, Hoseo University
국내 재벌 계열사들의 연구개발비에 대한 재무적 산업효과 분석
호서대학교 사회과학대학 경영학부김한준
Abstract The study empirically investigates financial factors that may influence on corporate R&D intensity during the post-era of the global financial turmoil (from 2010 to 2015) to mitigate possible spillover effect associated with the crisis. Concerning the empirical research settings of the study, chaebol firms listed in the KOSPI stock market are used as sample data with adopting various econometric estimation methods to enhance validity of the results. In the first hypothesis test, it is found that there exist inter-industry financial differences in terms of the ratio of R&D expenditure across all the sample years, but the statistical differences may arise from only a few domestic industries beloning to the high-growth sector. Moreover, it is also interesting to identify that, for the high-tech sector, 3 explanatory variables such as R&D intensity in a prior year, firm size and change in cash holdings are proved to be financial factors to discriminate between chaebol firms and their counterparts of non-chaebol firms, whereas a proportion of tangible assets over total assets as well as the former two variables are shown to be significant factors on the R&D intensity for the low-tech sector.
요 약 본 연구 논문의 주제는 국제금융위기와 관련한 전이효과를 고려하여 설정된 표본기간 (즉, 국제금융위기 이후 6년간) 동안, 국내 자본시장에서의 재벌소속 계열사들의 연구개발비 비중에 대한 재무적 결정요인들 분석에 관한 분석이 다. 이와 관련하여, 연구의 실증분석 시행을 위하여 국내 유가증권시장에 상장된 재벌그룹 소속 계열사들을 표본자료로 선정하였으며, 상대적으로 다양한 계량경제 모형들을 활용하여 연구결과의 신뢰도 제고를 추진하였다. 첫 번째 가설 검 정 결과와 관련, 국내 재벌기업들로 구성된 표본기업들의 연구개발비 비중에 산업간 효과가 통계적으로 유의하게 검정되 었으며, 이와 관련된 심화 연구에서 동 유의성은 국내 산업들 중, 소수의 고성장 산업들에게만 존재함이 판명되었다.
두 번째 가설 검정에서는 표본산업들을 고기술 군(그룹)과 저기술 군(그룹)으로 양분화하여, 전자의 경우 모형에 사용된 전체 설명변수들 중 전년도의 연구개발비 비중, 기업규모 그리고 현금유동성의 변화 등의 설명변수들이 재벌기업들과 비재벌기업들 간의 재무적 측면에서 차이점을 나타내는 결정요인으로서 판명되었다. 반면에 저기술 군에 대한 분석 결 과, 상기 2가지 변수 (즉, 전년도 기준 연구개발비 비중과 기업규모) 이외에도 총자산 대비 유형자산의 비율이 양 비교 기업군들 간에 재무적 차별성을 나타내는 유의 변수들로서 판명되었다.
Keywords : ANCOVA, Industry Effect, Korean Chaebol, Limited Dependent Variable, Research &
Development
*Corresponding Author : Hanjoon Kim(Hoseo Univ.) Tel: +82-41-560-8369 email: [email protected]
Received March 21, 2019 Revised May 2, 2019 Accepted June 7, 2019 Published June 30, 2019
1. Introduction
The subject of the study is to conduct financial Analyses on corporate research & development (R&D) expenditures during the post-period of the global financial turmoil begun in the year 2018.
To specify, the empirical settings of the study include to select the sample data as “firms belonging to Korean chaebol groups” (“Korean chaebol firms” hereafter) that are listed on the KOSPI stock market. To mitigate or reduce possible spillover or effect, time reference for a sample period is chosen to be the post-era of the global financial crisis after the origination of the credit crunch of the U.S. sub-prime mortgage issue in 2008. For this particular research, most of the empirical settings are analogous to those in the preceding study of [1] for the purposes of comparability and consistency, which is an extension of the latter one in terms of corporate R&D activity. That is, further investigations are empirically performed in the present study to examine financial factors of the R&D intensity for the Korean sample firms inclusive of the inter-industry influence. For reference, it was announced by Ministry of Science and ITC of the domestic government that the proportion of total corporate R&D intensity spent by the top 5 corporations in rank (in terms of sales) was estimated at 37.2%, in comparison with those of the top 10 and top 20 domestic firms constituting 41.7% and 49.3% in 2015, respectively [2]. In addition, on a global basis, Samsung Electronics, Co. in the semiconductor industry as one of the subsidiaries of Samsung Group in Korea, was reported to be ranked 1st in the amounts of R&D outlays in 2017, which was followed by Intel Co.
and Apple Co. with headquarters in the U.S. that were ranked top 6th and 7th, respectively [3].
Major motivations to conduct the study are as follows: First, as an extended research of [1] as described, the study focuses on testing financial factors of the R&D intensity for the chaebol
firms, that include to empirically detect existence of inter-industry differences as well as financially discrimination factors. Recently, unprecedented changes on the financial structures on the chaebol firms seem to be more demanded by investors in the domestic capital markets. In tandem with a possible socio-economic transition as desribed in [1], it appears to be timely important and appropriate to turn more attention to the financial issues on the R&D expenditures for Korean chaebol firms. Second, relatively less attention have been paid to the subject of the study in the previous literature. In other words, even if there are voluminous number of researches on the topic of corporate R&D expenses, empirical studies on the subject between the chaebol firms and their counterparts of the non-chaebol firms are few in terms of international and domestic perspective. Therefore, results derived from the study are expected to be utilized for the benefits of interested parties such as shareholders and bondholders. Finally, besides classifying the entire sample firms into each corresponding industries to implement a test to identify industry influences on the R&D outlay, the sample firms are also grouped into two broader classifications of industry such as high-tech and low-tech sector for in the second hypothesis, as in [4].
Then, empirical tests are separately conducted to distinguish financial characteristics of the chaebol firms from those of their counterparts of the non-chaebol firms. Methodologically, a wide spectrum of empirical tests are implemented to obtain more robust results in the study.
Therefore, it is anticipated to obtain financially significant factors to determine corporate R&D intensity, which also corresponds the objective of the study. The study is organized as follows.
Empirical settings are presented in Section II including the criteria of data collection and econometric methodologies for estimations, following the section for introduction. It also comprehends the list of definitions for financial
components that are employed in each model and relevant hypotheses are also postulated to perform each empirical test. The results obtained from the study are then analyzed and discussed in the context of conventional and modern finance theory. In the last section, conclusion is presented with recapitulating the outcome of the study.
2. Literature Review
In the section, previous literature on the subject in association with corporate R&D expenditures are chronologically reviewed to share commonalities from an international or a domestic viewpoint. They are also presented in a majority of the previous inclusive of the studies of [1] and [5].
In the study conducted by [4], benefits or disadvantages of a firm’s R&D expenses were tested in terms of stock price with using the U.S.
sample data during the period from 1979 to 1985. Systematic and statistically significant factors which may affect a change of stock price were examined on the basis of the type of R&D costs. The empirical procedure of the event-study was methodologically engaged and the results showed that announcements on the increase of R&D expenditures are, on average, positive information to enhance a firm’s market capitalization. Moreover, results of earnings with a positive or negative amount were found not to be statistically different to increase firm value in the long-term. Moreover, a cross-product term between variables of R&D intensity and the technology dummy revealed a positively significant effect on the dependent variable. [6] tested with several relevant hypotheses that corporate earnings may be adjusted by management in the short-term if projected earnings seem to be deviated from its original target goal. As for the methodology, multiple regression models
covering the sample period from 1972 to 1983 were used for the U.S. sample firms to derive estimators for unexpected costs. And then expected R&D expenditures were reestimated by adopting the data during the 1984-1990 in the study. They tested a hypothesis that changes in R&D costs are statistically related to those in corporate earnings, assuming that management adjusts R&D costs to achieve its goal for earnings. The study demonstrated evidence that there was an almost linear relationship between a firm’s unexpected R&D expenses and corporate earnings. [7] presented that there has been an unprecedented increase in R&D outlay for firms with headquarters in advanced or emerging capital markets inclusive of the U.S. ones using the past decades (i.e., for the 70s’ and 80s’). A regression model was applied to examine a relationship between annual operating income as a dependent variable and R&D expenditures as an independent variable. It was the longest during among the sample industries, while the duration of R&D benefits in the scientific instruments industry was the shortest one with only for 5 years. Moreover, the study found that profitability measured by the return on equity (ROE) from shareholders’ perspective seemed to be larger than that of the reported ROE for firms with a rapid growth rate of R&D expenditures. In the test done in the study of [8], it was hypothesized that mean effect of a corporation may overweigh the variance effect of it in terms of bond pricing. The sample data comprised 132 new bonds issued by 81 U.S. firms belonging to the five R&D intensive industries during the period from 1991 to 1994. As for test results obtained from applying the SUR model, corporate research & development intensity defined as annual R&D expenditures showed its significant effect to account for corporate bond price. Concerning other proposed variables as possible determinants of corporate bond risk employed in the model besides a proxy for R&D
Definition Symbol Measurement R&D Intensity: RD
(Dependent Variable)
(R&D Expenses) / Sales
Market-value Based Leverage:
MLEVER Book Value of
Liabilities / (Book Value of Liabilities + Book Value of Preferred Equity + Market Value of Common Equity)
Firm Size: SIZE Natural Logarithm of
Sales Amount Profitability: PFT Net income / Equity Non-debt Tax
Shield NDTS (Depreciation +
Amortization) / Total Assets
Tobin’s q:
GROWTH
(Market Value of Common Equity + Book Value of Table 2. List of Proxy Variables Employed expenditure, firm size measured in terms of sales
had a negative effect to determine a bond risk as a financial determinant. In the meantime, [9]
market response in relation to both long-term stock rate of return and operating performance was tested after the announcement of corporate R&D activities. Interestingly, as for the test results for each subsample such as high-tech, low-tech, high-growth, and low-growth firms, there were, overall statistically significant abnormal rates of returns across all defined sub-samples on the basis of equal-weighted method. Recently, financial components of corporate R&D intensity for firms belonging to Korean chaebols were statistically detected with adopting several empirical estimation procedures. With respect to the results of the study, R&D intensity in the last fiscal year, market-value based debt ratio and firm size among nine explanatory variables, provided evidence that they are statistically significant to account for the level of R&D intensity for the chaebol firms in the test of the hypothesis, while a majority of the variables, on a relative basis, showed their pronounced importance to financially discriminate the sample firms from their counterparts as non-chaebol firms.
3. Empirical Research Settings
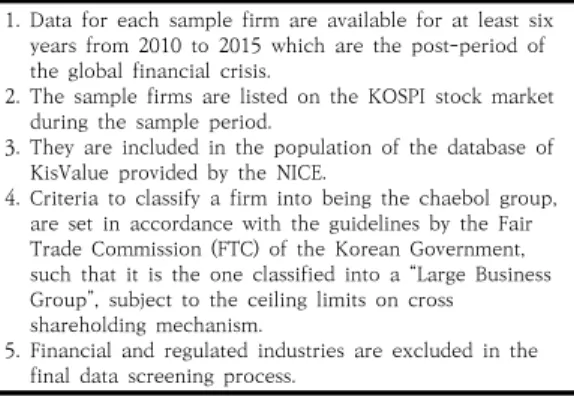
3.1 Data Sampling Critera and Proxy VariablesTo proceed an empirical procedure, the sample data and time references are selected on the basis of the following table, [Table 1]. Taking into account of the present study to further investigate or corroborate the empirical outcomes of the preceding study of [1], the same empirical research settings of [1] are mostly adopted in the study for the purposes of comparability and validity.
1. Data for each sample firm are available for at least six years from 2010 to 2015 which are the post-period of the global financial crisis.
2. The sample firms are listed on the KOSPI stock market during the sample period.
3. They are included in the population of the database of KisValue provided by the NICE.
4. Criteria to classify a firm into being the chaebol group, are set in accordance with the guidelines by the Fair Trade Commission (FTC) of the Korean Government, such that it is the one classified into a “Large Business Group”, subject to the ceiling limits on cross shareholding mechanism.
5. Financial and regulated industries are excluded in the final data screening process.
Table 1. Sampling criteria for chaebol firms
To specify, total number of the sample firms for the chaebol group consists fo 127 firms that are listed on the KOSPI stock markets in the 20 domestic industries. Due to the limitations of space, entire identification to describe the sample industries is not presented in the study.
However, some of the industries that are statistically different among total industries are reported in he first hypothesis of Section IV (A full list of the sample industries is available from the author upon request.) Meanwhile, the definition and the symbol for each independent variable (IDV) that is employed in the study, are presented in [Table 2].
Preferred Equity + Book Value of Liabilities) / Total Assets
Change in
Cash Liquidity CHOLD [(Cash & Cash Equivalents)t - (Cash &
Cash Equivalents)t-1] / Total Assetst
Business Risk VOLAT 3.3 x (EBIT / Total Assets) + 1.0 x (Sales / Total Assets) + 1.4 x (Net Income / Total Assets) + 0.6 x (Market Value of Equity / Book Value of Equity) Tangible
Assets TASSET Tangible Assets / Total
Assets Change in Net
Investment NETINVE (Tangible Assetst - Tangible Assetst-1)/
Total Assetst-1
Moreover, based on the industry classification regulated by KSIC (Korean Standard Industrial Classification) and the criteria guided by KRX (Korea Stock Exchange), firms belonging to the 9 domestic industries (inclusive of the electric &
electronic and the pharmaceutical industries) are classified into those in the high-tech sector of the study. And then, among total sample 20 industries for the chaebol groups, their counterparts in the other domestic industries (11) are categorized into a low-tech sector on a relative basis, as in [10]. The criteria to classify total industries into either the high-tech or the low-tech one generally follow those in [4], given that there still exist several differences between the criteria of [4] and the present study in association with different time references and capital markets. Meanwhile, one of the other independent variables to represent corporate R&D intensity of the last fiscal year (Lag_RD), is also employed to examine its influence on the R&D intensity (RD) of the current year. which showed its pronounced effect in a majority of the preceding studies as in [1] and [4]. For reference, financial data for the year, 2010 were used as a base one to estimate the one-year lagged variable of Lag_RD.
3.2 Hypothesis Postulations and Methodologies Two primary hypotheses are separately postulated as described below: First, it is to test for inter-industry influences on the level of corporate R&D expenditures among the chaebol firms and then compatible procedures are implemented for the non-chaebol firms for the purpost of comparability. Second, on a relative basis, various econometric tests are also conducted to discriminate unique financial attributes of the former groups from their counterparts of the non-chaebol firms under each classification such as high- and low-tech sector. The null hypothesis for the former issue is posited as follows:
H1: During the post-era of the global financial turmoil occurred in 2008 (i.e, from 2011 to 2015), there may not exist any statistically significant inter-industry financial differences among the sample industries consisting of the chaebol firms in terms of corporate R&D intensity.
As for econometric methodologies for estimation, both the analysis of covariance models are applied in the context of a parametric (ANCOVA) and a non-parametric (RANCOVA) assumption. They employ a proxy variable (to represent firm size (SIZE) at the end of the fiscal-year) functioned as a covariate in each corresponding model as in [10]. On the other hand, to make a statistical comparison between the two comparing sample groups (i.e., chaebol firms vs. non-chaebol firms), separate estimations are conducted for both groups belonging to the high-tech sector and then in the low-tech one, in the second hypothesis test. as to the following hypothesis.
H2: In relation to the aforementioned hypothesis (i.e., H1), there may not be any discriminating factor(s) associated with corporate R&D intensity, that financially separates chaebol firms from non-chaebol firms belonging to the high-tech or low-tech sector during the sample
period.
To specify, various econometric estimations are carried out to detect any significant financial factors that may discriminate between the chaebol and the non-chaebol firms under each sector. Results obtained under each sector (i.e., high-tech and low-tech industry) are then compared to identify financial differences among the explanatory variables that are listed in [Table 2]. As used in the preceding study of [1], logistic and probit regression models as well as complementary log-log model (CLOG) are applied to derive outcome of the study. The latter (CLOG) may be more useful to estimate coefficients of the model, assuming asymmetric distribution of a disturbance term, as described in [11].
4. Analysis and Discussion
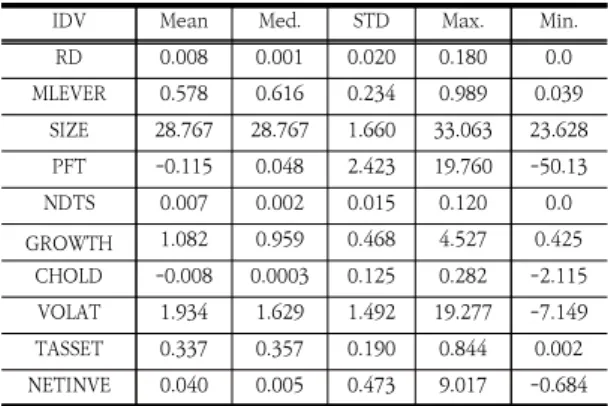
4.1 Analysis on the Results of the Hypotheses4.1.1 Descriptive Statistics for the Sample Data As an antecedent of a legitimate empirical research, descriptive statistics on the sample groups (i.e., chaebol vs. non-chaebol firms) are reported in [Table 3] and [Table 4]. For reference, the statistics of the former table were also presented in [1] for the chaebol firms.
IDV Mean Med. STD Max. Min.
RD 0.008 0.001 0.020 0.180 0.0
MLEVER 0.578 0.616 0.234 0.989 0.039
SIZE 28.767 28.767 1.660 33.063 23.628
PFT -0.115 0.048 2.423 19.760 -50.13
NDTS 0.007 0.002 0.015 0.120 0.0
GROWTH 1.082 0.959 0.468 4.527 0.425
CHOLD -0.008 0.0003 0.125 0.282 -2.115
VOLAT 1.934 1.629 1.492 19.277 -7.149
TASSET 0.337 0.357 0.190 0.844 0.002
NETINVE 0.040 0.005 0.473 9.017 -0.684
Table 3. Descriptive statistics for chaebol firms
IDV Mean Med. STD Max. Min.
RD 0.008 0.001 0.018 0.178 0.0
MLEVER 0.495 0.495 0.240 0.992 0.009
SIZE 26.279 26.246 1.266 31.708 22.156
PFT -0.063 0.049 1.949 5.070 -88.003
NDTS 0.004 0.002 0.008 0.130 0.0
GROWTH 1.085 0.900 0.787 15.918 0.158
CHOLD 0.005 0.002 0.062 0.791 -0.431
VOLAT 1.814 1.601 1.192 13.513 -1.736
TASSET 0.389 0.343 0.878 25.054 0.002
NETINVE 0.022 0.004 0.169 5.214 -0.882
Table 4. Descriptive statistics for non-chaebol firms
As for total numbers of the chaebol and the non-chaebol sample firms listed on the KOSPI stock market are finalized as 127 firms in the 20 domestic industries and 458 firms across the 23 industries, respectively, according to the criteria listed in [Table 1].
4.1.2 Results of the First Hypothesis
For the test of the 2nd hypothesis, both ANCOVA and RANCOVA models are simultaneously applied for the purposes of enhancing the validity and consistency of the output, as also utilized in [12]. It is to detect possible inter-industry effects on the R&D intensity for the chaebol and the non-chaebol firms. As an a posteriori test, Scheffe estimation is subsequently employed for multiple comparison purpose among the sample industries. Information on the analyses are presented in the following tables.
Year for Dependent
Variable of RD Chaebol firms
(p-value) Non-chaebol firms (p-value) The year, 2011 <0.001 <0.001
2012 <0.001 <0.001
2013 <0.001 <0.001
2014 <0.001 <0.001
2015 <0.001 <0.001
Table 5. ANCOVA of R&D Intensity for each tested year
To specify, p-values are obtained from Type III sums of squares in the statistical package
(SAS) to estimate a unique contribution of each industry on the dependent variable. It is interesting to identify that there exist statistically significant inter-industry effects on the dependent variable at the 1% level for both sample groups across the entire sample period. Moreover, the phenomenon is corroborated by the results from the analysis of covariance model in terms of non-parametric statistical context (RANCOVA).
However, covariate (SIZE) did not show its pronounced effect to account for the level of R&D outlay for each year under a parametric context. Results from Scheffe specification test are presented in [Table 6] and [Table 7].
Grouping the industries by RD in 2011
Industry Name Pharmaceutical The other 19 Sample Industry
Grouping A
B Grouping the industries by RD in 2015 Industry Name Pharmaceutical Electric &
Electronic
The other 18 Sample Industry Grouping
A
B
C
<Note> 'Grouping' indicates that among total sample industries, industries which do not show statistically significant difference among themselves shares the same alphabet such as 'A' and 'B'.
Table 6. Results of multiple comparisons for industry differences for Korean chaebol firms
Grouping the industries by RD in 2011 Industry
number Pharmaceutical The other 22 Sample Industry
Grouping A
B Grouping the industries by RD in 2015 Industry
number Pharmaceutical The other 22 Sample Industry
Grouping A
B
Table 7. Results of multiple comparisons for industry Differences for Korean non-chaebol firms
4.1.3 Results of the Second Hypothesis As described, empirical analyses as an extension of [1] are further implemented to
analyze a binary relationship between the chaebol and non-chaebol firms on the KOSPI stock market, according to each category of technical involvement, as follows.
Proxy Variable Logit Probit CLOG
constant -38.006* -19.892* -31.899*
Lag_RD 9.088* 4.209* 7.772*
MLEVER 0.198 0.110 0.158
SIZE 1.332* 0.696* 1.105*
PFT -0.216 -0.062 -0.210
NDTS 7.457 4.464 3.864
GROWTH 0.328 0.171 0.386*
CHOLD -3.992* -2.179* -3.143*
VOLAT -0.202 -0.118 -0.306*
TASSET -0.202 -0.169 -0.171
NETINVE -0.075 -0.027 -0.060
Goodness of Fit 778.581* 753.444* 807.959*
<Note> Each coefficient was estimated by the maximum likelihood method. Test for overall goodness of fit was performed by the likelihood ratio test, while the Wald test was used to test for a significance of each individual coefficient. * indicates a significance at the 5% level.
Table 8. Results on discriminating dactors of R&D intensity between chaebols and non-chaebols in high-tech sector
Proxy Variable Logit Probit CLOG
constant -32533* -17.838* -23.102*
Lag_RD -101.4* -48.154* -93.378*
MLEVER -0.491 -0.369 -0.372
SIZE 1.208* 0.663* 0.844*
PFT -0.044* -0.023 -0.035*
NDTS 18.704 10.125 18.710*
GROWTH -0.279 -0.184 -0.159
CHOLD -1.276 -0.830 -1.306
VOLAT -0.152 -0.055 -0.107
TASSET -2.427* -1.376* -2.321*
NETINVE -0.728 -0.366 -1.011
Goodness of Fit 486.847* 480.097* 471.112*
Table 9. Results on discriminating factors of R&D intensity between chaebols and non-chaebols in low-tech sector
Concerning the consequences reported in [Table 8], it is found that the chaebol firms may demonstrate their statistical discrepancy in terms of Lag_RD, SIZE and CHOLD in comparison with their counterparts of non-chaebol group. To recap, the former two variables have positively significant power to discriminate between the two comparing sample groups classified in the high-tech sector, whereas the sign of the latter
variable (i.e., CHOLD) is negative and statistically significant across all binary models (i.e., Logit, Probit and CLOG). On the other hand, in the low-tech sector, the variables such as Lag_RD, SIZE and TASSET are found to be significant to financially discriminate the chaebol firms from their counterparts, as in [Table 9]. Meanwhile, PFT to represent corporate profitability shows its importance to discriminate two sample groups in the low-tech sector in the majority of the models, whereas it does not have a significance effect on these groups belonging to the high-tech sector.
4.2 Discussion
In this section, financial interpretations are described on the results of the aforementioned primary hypothesis tests. As an antecedent of main interpretations, the results of the descriptive statistics are reported in [Table 3] and [Table 4]. It is identified that the values of RD for the chaebol sample firms are almost the same (with rounding) as that of their counterparts in non-chaebol groups with their mean (=0.008) and medians (=0.001) during the study period. Both sample groups tend to have right-skewed distributions in terms of R&D intensity. The phenomenon may suggest that larger value of the R&D intensity (i.e., the value of mean > median) are maintained by only a few chaebol firms and also non-chaebol firms in the domestic capital market. Besides, as presented in [1] for the group of chaebol firms, the coefficients of variation (CV) for SIZE and PFT are estimated at 0.058 (=
the largest value amongst total proxy variables) and (-)21.07 (=the smallest one), respectively. In contrast, the non-chaebol sample group has a smaller value of SIZE (=0.048), but a larger one of PFT (=(-)30.94), in terms of CV.
Regarding the results of the first hypothesis test, it is interesting to identify that only one or two industries show their statistical importance at the 5% level across the study period (i.e., from
2011 to 2015), as shown in [Table 6] and [Table 7]. For chaebol group, firms in the domestic pharmaceutical industry grouped as “A” with its largest least squares (LS) means of 0.1100 for the year, 2011 and 0.1041 for 2015, respectively, among the 20 total sample industries. In the last year of the sample period (i.e., the year, 2015), the electric & electronic industry grouped as “B”
followed the pharmaceutical industry with a LS mean of 0.0424 as the 2nd largest one. Likewise, for the non-chaebol firms, the pharmaceutical industry with a LS of 0.032 for the year, 2011 and 0.0349 for 2015 is also revealed as the only industry to discriminate it from the other 22 domestic industries, in the context of Scheffe specification test. Based on these outcome, it may be theoretically suggested that corporate R&D expenditures relative its sales amount are heavily or extremely polarized in only a few industries (i.e., 1 or 2) without having a balanced distributional dispersion relative to the ratio. The findings are generally compatible with those obtained from the study of [10] for the KOSPI-listed firms. Moreover, the phenomenon of the study may imply the following practical issue. First, significant inter-industry differences on R&D intensity that had been found in [10], may not statistically exit if the industries grouped as ‘A’ and ‘B’ in the study are not included in the sample industries. Accordingly, in the case of non-existence of inter-industry differences, it may imply that optimal level of R&D expenditures has not been attained yet in the domestic capital market at the inter-industry level. Second, discretion of accounting procedure to deal in the development costs under K-IFRS (Korea International Financial Reporting Standards) may, in part, cause the statistical differences of the two industries from the other sample industries.
In other words, development costs in R&D expenditures are capitalized if certain conditions are met under the current accounting principle.
Nature of the products manufactured by the two
significant industries seems to be higher in terms of business risk and volatility of cash flow, in developing medicine and sophisticated items in technology such as semiconductor. Therefore, conservatism on treating corporate R&D spending as development costs in total assets may cause the dependent variable of RD of the industries to be larger than those of their counterparts belonging to the other industries during the study period.
Results of the second hypothesis are presented in [Table 7] and [Table 8]. Among the explanatory variables showing their significant discriminating influence in a statistical perspective, it is of concern to identify that the variable of Lag_RD demonstrates a conflicting result in terms of a sign of an estimated coefficient. That is, sign of the variable is positive (+), which indicates that there is a higher possibility to be classified into a chaebol firm in terms of the high-tech sector, if the value of the variable increases. The result is also compatible with the finding obtained in [13] for the KOSPI-listed firms (e.g., not only for the chaebol group). On the contrary, the opposite results are obtained in the case of the non-chaebol firms in the low-tech sector with its negative (-) sign. Based on the findings, it is plausible that investment opportunities supported by corporate R&D activities are relatively few or scarce for the chaebol firms in the low-tech sector in comparison with their counterparts of the same sector. Second, CHOLD and TASSETS show negatively significant effects to differentiate the chaebol firms from their counterparts during the post-era of the global financial turmoil. In other words, in the high-tech sector or industries, future investment opportunities projected by internally generated fund seem to be higher or abundant for the chaebol firms than non-chaebol counterparts, thereby resulting in low increase of CHOLD in terms of a change in cash holdings. Likewise, firms in the non-chaebol group under the
low-tech sector, appear to maintain a higher proportion of tangible assets over total assets (i.e., TASSET) as reported in [Table 8]. This phenomenon may, to a larger extent, be attributable to the fact that more active and aggressive strategies are exercised by management of the chaebol firms than their counterparts with purchasing patents or licenses or realizing goodwill through corporate takeovers. Consequently, it is plausible that TASSET becomes lower due to an increase of intangible assets for the chaebol firms, that may result in the a negative sign of the coefficient of the variable. Meanwhile, the effects of MLEVER are found to be insignificant to discriminate between firms in each sample group across the two tech sectors. Coupled with the finding of [13], which had showed its significant discriminating power to separate KOSPI-listed firms into the two sectors, the phenomenon seems to be corroborated by the conventional finance theory. That is, corporate capital structure is inversely related to the degree of technical involvement such that firms in a high-tech or high-growth sector tend to prefer equity financing over debt financing due to higher volatility of cash flows. Finally, it is of interest that PFT defined by a return on equity (ROE) reveals its significant role to financially discriminate between the two sample groups in the case of the low-tech sector. It had been identified that firms in high-tech industries overall showed a higher profitability in terms of operating earnings as presented in [13], while KOSPI-listed chaebol group seem to have maintained a lower profitability of ROE than their counterparts as described in [1]. Coupled with the results obtained from the previous research, the finding of the study may provide statistical evidence that the lower profitability (PFT) overall results from that of the chaebol firms in the low-tech sector, in comparison with their counterparts. Therefore, it may be
worthwhile to pay more attention to the chaebol firms in the sector to improve or enhance corporate profitability at the macro-level.
5. Concluding Remarks
The study addresses one of the subjects, corporate R&D intensity, in modern financial theories, but it may need to draw more attention in academic and practical perspectives. As an extension of the preceding study of [1], financial attributes of the R&D intensity for the sample firms are compared to those of non-chaebol firms) in the post-period of the global financial turmoil. Various econometric estimations are conducted to test for two primary hypotheses. It is empirically identified that there exit significant inter-industry differences among the industries for each tested year, but the phenomenon seems to arise from only a few industries that are mostly engaged in high-growth businesses. In the second hypothesis, Lag_RD, SIZE and CHOLD show their explanatory power to financially discriminate chaebol firms from their counterparts, both of which belong to the high-tech sector. On the contrary, Lag_RD, SIZE and TASSET are detected as significant factors in the low-tech sector. Despite possible weaknesses or disparity of the study by adopting different legitimate empirical settings from those in preceding studies in terms of time reference and sampling criteria, it is expected that results are effectively utilized to increase of corporate profits for both chaebol an non-chaebol firms.
That is, financially significant variables found in the study, that are further reinforced by various methodologies in comparison with previous literature, may contribute to approaching to the optimal level of R&D intensity, that is then to maximize profits.
References
[1] H. Kim, "Empirical Analyses on the Financial Profile of Korean Chaebols in Corporate Research &
Development Intensity," Journal of the Korea Academia-Industrial Cooperation Society, vol. 20, no.
4, pp.232-241, 2019.
DOI: https://doi.org/10.5762/KAIS.2019.20.4.232 [2] Ministry of Science and ICT (2015), Report on the
2016 R&D Activities [Internet]. Available From:
http://www.msip.go.kr/SYNAP (accessed Nov. 8, 2018) [3] The Maeil Kyoungje, [Internet]. Available at
http://news.mk.co.kr/newsRead.php?year=2018&no=7 74123 (accessed Dec. 19, 2018)
[4] S. Chan, K. Martin, J. Kensinger, “Corporate Research and Development Expenditures and Share Value,”
Journal of Financial Economics, vol. 26, pp. 255-276, 1990.
DOI: https://doi.org/10.1016/0304-405X(90)90005-K [5] H. Kim, “Conditional Quantile Regression Analyses on
the Research & Development Expenses for KOSPI-listed Firms in the Post-era of the Global Financial Turmoil,” Journal of Contents Association, vol. 18, no. 4, pp.444-453, 2018.
DOI: http://doi.org/10.5392/JKCA.2018.18.04.444 [6] S. Perry, R. Grinaker, “Earnings Expectations and
Discretionary Research and Development Spending,”
Accounting Horizons, vol. 8, no. 4, pp.43-51, 1994.
[7] B. Lev, T. Sougiannis, "The Capitalization, Amortization, and Value-relevance of R&D,” Journal of Accounting and Economics, vol. 21, pp.107-138, 1996.
DOI: https://doi.org/10.1016/0165-4101(95)00410-6 [8] C. Shi, "On the Trade-off between the Future Benefits
and Riskness of R&D: a Bondholders' Perspective,"
Journal of Accounting and Economics, vol. 35, pp.
227-254, 2003.
DOI: https://doi.org/10.1016/S0165-4101(03)00020-X [9] A. Everhart, W. Maxwell, A. Siddique, “An Examination
of Long-term Abnormal Stock Returns and Operating Performance Following R&D Increases,” Journal of Finance, vol. 59, no. 2, pp.623-650, 2004.
DOI: https://doi.org/10.1111/j.1540-6261.2004.00644.x [10] H. Kim, “Evidence on the Optimal Level of Research
& Development (R&D) Expenses for KOSPI-listed Firms in the Domestic Capital Market,” Journal of International Trade & Commerce, vol. 14, no. 1, pp.147-165, 2018
DOI: http://dx.doi.org/10.16980/jitc.14.1.201802.147 [11] P. Allison, “Logistic Regression Using SAS: Theory and
Application (2nd ed.),” SAS Institute, NC, USA, pp.91-96, 2012.
[12] H. Kim, “Further Analyses on the Contemporary Changes of Profitability for the Firms Belonging to the Chaebol in the Republic of Korea,” Journal of
Contents Association, vol. 14, no. 6, pp.367-384, 2014.
DOI: http://dx.doi.org/10.5392/JKCA.2014.14.06.367 [13] H. Kim, "Further Examinations on the Financial
Aspects of R&D Expenditure For Firms Listed on the KOSPI Stock Market," Journal of the Korea Academia-Industrial Cooperation Society, vol. 19, no.
4, pp. 446-453, 2018.
DOI: https://doi.org/10.5762/KAIS.2018.19.4.446
Hanjoon Kim [regular member]
• Feb., 1985 : Yonsei Univ., Seoul.
• Sept., 1987 : The George Washington Univ., MBA, U.S.A.
• Jan., 1999 : Boston University DBA (Major: Finance), U.S.A.
• Mar. 2010 ∼ Present : Hoseo Univ. Dept. of Business Administration. Professor
<Research Interests>
Corporate Finance, M&A