812 PISSN 0304-128X, EISSN 2233-9558
Selection of Medium Components by Plackett-Burman Design for Cell Growth of a Newly Isolated Methylobacterium sp. WJ4
Wangjun Lee and Jinwon Lee†
Department of Chemical and Biomolecular Engineering, Sogang University, 35, Baekbeom-ro, Mapo-gu, Seoul, 04107, Korea (Received 26 August 2016; Received in revised form 7 September 2016; accepted 9 September 2016)
Abstract − We isolated a novel methylotrophic bacterium from soil collected in Dongducheon Environment Affairs Agency. The isolate was identified as Methylobacterium sp. WJ4 based on phylogenetic analysis. Plackett-Burman design was employed for screening eight parameters of nitrate mineral salts (NMS) medium for cell growth of a newly isolated Methylobacterium sp. WJ4 with experimental validation. Trace element solution and vitamin stock were found to affect cell growth, which can be further optimized for increased cell growth. This is the first report of screening parameters of NMS medium which affect cell growth of strain belonging to the genus Methylobacterium using Plackett- Burman design.
Key words: Cell growth, Isolation, Methylobacterium, NMS medium, Plackett-Burman design
1. Introduction
Currently, further methanol production facilities are being set up based on the abundance of resources for its production, such as natu- ral gas. The advantages of methanol include its price stability, low price, complete water miscibility and restricted use by microorgan- isms. Methanol reduces the risk of contamination in fermentations due to its toxicity towards numerous microbial species. Thus, metha- nol has attracted much attention due to its many advantages as a raw material in the field of biotechnology [1-4].
Methylobacterium strains are Gram-negative, pink-pigmented, strictly aerobic, facultatively methylotrophic bacteria. They can utilize single- carbon compounds as their sole carbon and energy source, as well as a wide range of multi-carbon growth substrates [5]. They belong to the Alphaproteobacteria and have been isolated from soils, dust, lake sediments and plants, specifically from leaf surfaces [6,7]. Amino acids [8], various proteins [9, 10] and polyhydroxyalkanoates (PHA) [3]
are products of Methylobacterium strains using methanol as a feed- stock. This genus has appeared as premier biocatalysts for methanol- based biotechnology and been considered as a key model system for converting methanol into value-added products [11]. Thus, metha- nol and Methylobacterium strains have received considerable atten- tion as a feedstock in the field of biotechnology.
An efficient way to screen for the most important growth factors among a large number of variables is the use of the Plackett-Burman design [12,13]. This technique generates different combinations of
the individual components with varying amounts. Medium compo- nents are simultaneously varied in one large experiment rather than in multiple separate experiments. Subsequently, statistical models are assigned to estimate the effect of varying one component either independently or in unison with other components. Thus, this approach can identify interactions between variables and use quantitative mod- els to guide the optimization process [14-16]. In this study, signifi- cant growth factors of nitrate mineral salts (NMS) medium screened on the basis of the Plackett-Burman design for growth of Methylo- bacterium sp. WJ4 are reported.
2. Experimental
2-1. Culture medium
The cultivation was conducted in modified NMS medium con- taining MgSO4·7H2O 1 g/L, KNO3 1 g/L, CaCl2·H2O 0.2 g/L, Fe- EDTA 0.0038 g/L, NaMo·4H2O 0.0005 g/L and CuCl2·2H2O 0.0017 g/L.
Phosphate buffer (10 mL/L), Trace element solution (1 mL/L) and vitamin stock (0.1 ml/L) were added to the medium. Phosphate buffer, pH 7.0 contained KH2PO4 26 g/L and Na2HPO4·7H2O 62 g/L. The trace element solution contained FeSO4·7H2O 0.5 g/L, ZnSO4·7H2O 0.4 g/L, MnCl2·7H2O 0.02 g/L, CoCl2·6H2O 0.05 g/L, NiCl2·6H2O 0.01 g/L, H3BO3 0.015 g/L and EDTA 0.25 g/L. Vitamin stock con- tained biotin 0.002 g/L, folic acid 0.002 g/L, thiamine HCl 0.005 g/L, Ca pantothenate 0.005 g/L, vitamin B12 0.0001 g/L, riboflavin 0.005 g/L and nicotinamide 0.005 g/L. Methanol was added to give desired concentration [17,18].
2-2. Isolation of microorganism
Methylobacterium sp. WJ4 was isolated from the soil of the Dong- ducheon Environment Affairs Agency (Dongducheon city, Gyeo- nggi-do province, Republic of Korea). The soil sample was collected
†To whom correspondence should be addressed.
E-mail: [email protected]
‡This article is dedicated to Prof. Choon Han on the occasion of his retire- ment from Kwangwoon University.
This is an Open-Access article distributed under the terms of the Creative Com- mons Attribution Non-Commercial License (http://creativecommons.org/licenses/by- nc/3.0) which permits unrestricted non-commercial use, distribution, and reproduc- tion in any medium, provided the original work is properly cited.
in the facility. One gram of soil sample was suspended in 50 mL of liquid NMS medium containing 1% (v/v) methanol in a 250 mL flask and then incubated in a shaking incubator at 30oC and 200 rpm for one week. Subsequently, 500 μL of the supernatant was transferred to 50 mL of same medium and incubated under the same conditions.
This procedure was performed for four weeks and the supernatant was streaked onto modified NMS agar plates. The plates were incu- bated at 30oC. After incubation, single colonies were picked up from plate with a loop and restreaked onto modified NMS agar plates until colonies derived from single colony were obtained. Isolates were checked for purity using 16S ribosomal RNA (16S rRNA) gene sequencing.
2-3. Identification of the isolate by 16S rRNA gene sequencing and phylogenetic analysis
For identification of the isolate, 16S rRNA gene was amplified by polymerase chain reaction (PCR) with universal primer pair 27F [5'- AGAGTTTGATCCTGGCTCAG-3'] and 1492R [5'-GGTTACCTTG TTACGACTT-3']. Sequencing was done according to the Sanger dideoxy method [19]. The sequence was compared with those available in the GenBank database using Basic Local Alignment Search Tool (BLAST). To identify the isolate from the 16S rRNA gene sequence, phylogenetic and molecular evolutionary comparisons between the isolate and related methylotrophs were conducted using Clustal Omega and MEGA version 7.0.14 program by neighbor-joining method [20].
2-4. Plackett-Burman design
Plackett-Burman design is an efficient way to identify the most significant factors among a large number of variables [10]. In the present study, Plackett-Burman design experimental matrix was set to identify the important variables and estimate their significance in cell growth. The variables chosen were MgSO4·7H2O, CaCl2·H2O,
NaMo·4H2O, Fe-EDTA, trace element solution, vitamin stock, phos- phate buffer and CuCl2·2H2O. The experimental designs for the screen- ing of the variables are shown in Table 2 and 3. Plackett-Burman design is based on the first order model:
(1)
where Y = response (cell growth), β0, βi = constant coefficients, Xi = the coded independent factors and k is the number of factors.
Interaction among factors was not described in this model and the important factors that influence cell growth were screened by using this model [21,22]. The factors with p-values <0.05 are considered the most significant factors that affect cell growth.
2-5. Cultivation for screening of medium components using Plackett-Burman design and analytical methods
Cultivations were carried out in 250 mL Erlenmeyer flasks con- taining 50 mL of modified NMS medium in a shaking incubator at 30oC and 200 rpm. The medium was inoculated with 1% inoculum.
Cell growth was monitored by measuring the optical density (OD) at 600 nm (7300 Spectrophotometer, Jenway) after appropriate dilu- tion of culture broth with distilled water. Plackett-Burman design was generated by Minitab 17 Software. In addition, the experimen- tal results of designs were analyzed by Minitab 17 Software.
3. Results and Discussion
3-1. Identification of the isolate by 16S rRNA gene sequence and phylogenetic analysis
The microorganism isolated from the soil sample was related to the genera, Methylobacterium based on 16S rRNA gene sequences
Y β0 βi i 1=
∑
k Xi+
=
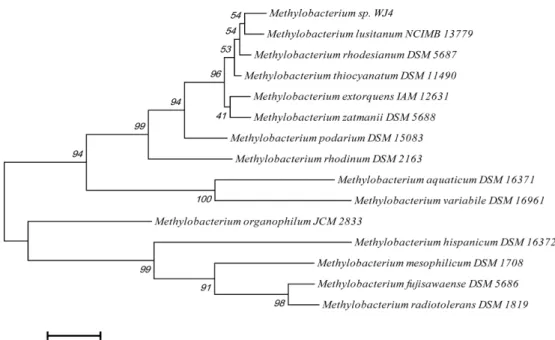
Fig. 1. Neighbor-joining phylogenetic tree based on 16S rRNA gene sequences showing the relationships between isolate and other methy- lotrophs. The scale bar represents 0.005 substitutions per nucleotide sequence position. The numbers at the nodes of the tree indicate bootstrap values for each node out of 1000 bootstrap resamplings.
and phylogenetic analysis (Fig. 1). The isolate, identified as Methylo- bacterium sp. WJ4, showed 99.6%, 99.5%, 99.2%, 97.7%, 96.7% and 96.6% similarity to Methylobacterium rhodesianum, M. lusitanim, M. thiocyanatum, M. rhodinum, M. organophilum and M. extorquens, respectively. Levels of 16S rRNA gene sequence similarity were high to assign the isolate to a member of the genus Methylobacterium.
3-2. Determination of a suitable nitrogen source for Methy- lobacterium sp. WJ4
The optimal nitrogen source was determined by culturing Methy- lobacterium sp. WJ4 in 250 mL Erlenmeyer flasks containing 50 mL of modified NMS medium with each different nitrogen source in a shaking incubator (200 rpm at 30 °C for 60 h). As shown in Table 1, the highest OD600 value of 2.948 and cell dry weight of 0.7 g/L was obtained in medium containing KNO3 as a nitrogen source. The same cell dry weight and similar OD600 values of 1.881 and 1.941 were obtained in medium containing NH4Cl and (NH4)2SO4 as a nitrogen source, respectively. Thus, KNO3 was deemed to be the most suit- able nitrogen source for Methylobacterium sp. WJ4.
3-3. Determination of the most significant medium components using Plackett-Burman design
Carbon and nitrogen source (methanol and KNO3) were essentially required for cell growth in microbial cultivation. A total of eight components (X1−X8) of NMS medium except for carbon and nitrogen source were analyzed regarding their effects on cell growth using a Plackett-Burman design. Table 2 shows the Plackett-Burman design used in this study. The list of various components and their amounts in the NMS medium is given in Table 2. The Plackett-Burman exper- iment was performed in 250 mL Erlenmeyer flasks containing 50 mL of growth medium in a shaking incubator (200 rpm at 30oC for 48 h).
A 13-run Plackett-Burman design generated for eight factors and the corresponding results are shown in Table 3. The high OD600 values were observed in combinations 9 and 10. Analysis of variance (ANOVA) was performed to estimate the effect of each factor regarding our system (Table 4). Table 4 illustrates the regression coefficient, t-value and p- value of the eight experimental variables. The equation obtained for Plackett-Burman design was as follows:
Y = 2.645 + 0.057 X1 – 0.239 X2 + 0.165 X3 + 0.230 X4 + 0.466 X5
– 0.569 X6 – 0.090 X7 – 0.415 X8 (2)
where Y = response (cell growth), X1 = coded value of MgSO4·7H2O, X2 = coded value of CaCl2·H2O, X3 = coded value of NaMo·4H2O, X4 = coded value of Fe-EDTA, X5 = coded value of trace element solution, X6 = coded value of vitamin stock, X7 = coded value of phosphate buffer, X8 = coded value of CuCl2·2H2O.
It is clear from Table 4 that MgSO4·7H2O (X1), NaMo·4H2O (X3), Fe-EDTA (X4), and trace element solution (X5) had positive effects on cell growth, whereas other factors had negative effects. Factors evidencing p-values of less than 0.05 were considered to have signif- icant effects on the cell growth. The p-values of vitamin stock and trace element solution were 0.043 and 0.026, respectively. Thus, trace element solution (X5) and vitamin stock (X6) were determined to be signifi- cant components for cell growth. In contrast, the other six variables, MgSO4·7H2O, CaCl2·H2O, NaMo·4H2O, Fe-EDTA, phosphate buf- fer, CuCl2·2H2O, were found to be insignificant. MgSO4·7H2O and Table 1. Effect of nitrogen sources on cell growth
Nitrogen source Optical density (600 nm) Cell dry weight (g/L)
KNO3 2.948 0.7
NH4Cl 1.881 0.4
(NH4)2SO4 1.947 0.4
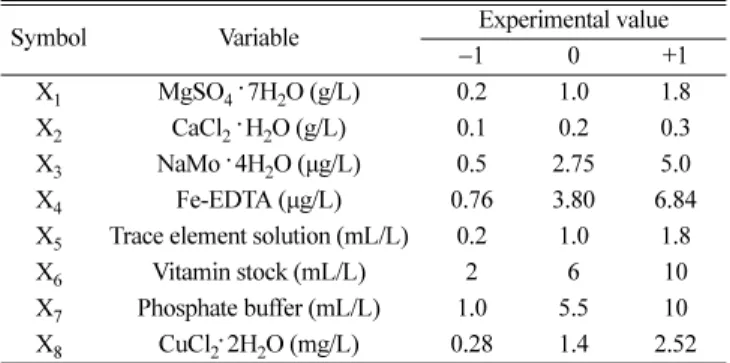
Table 2. Medium components and their levels used in Plackett-Burman design
Symbol Variable Experimental value
−1 0 +1
X1 MgSO4. 7H2O (g/L) 0.2 1.0 1.8
X2 CaCl2. H2O (g/L) 0.1 0.2 0.3
X3 NaMo. 4H2O (µg/L) 0.5 2.75 5.0
X4 Fe-EDTA (µg/L) 0.76 3.80 6.84
X5 Trace element solution (mL/L) 0.2 1.0 1.8
X6 Vitamin stock (mL/L) 2 6 10
X7 Phosphate buffer (mL/L) 1.0 5.5 10
X8 CuCl2. 2H2O (mg/L) 0.28 1.4 2.52
Table 3. Plackett-Burman design of variables with corresponding results
Run order Coded factors
Cell growth (OD600)
X1 X2 X3 X4 X5 X6 X7 X8
1 0 0 0 0 0 0 0 0 2.805
2 −1 −1 −1 −1 −1 −1 −1 −1 3.102
3 −1 −1 1 1 1 −1 1 1 3.388
4 1 1 −1 1 −1 −1 −1 1 2.079
5 −1 1 1 1 −1 1 1 −1 2.233
6 −1 1 −1 −1 −1 1 1 1 0.215
7 1 −1 −1 −1 1 1 1 −1 2.541
8 −1 −1 −1 1 1 1 −1 1 2.827
9 1 1 −1 1 1 −1 1 −1 4.114
10 −1 1 1 −1 1 −1 −1 −1 3.762
11 1 1 1 −1 1 1 −1 1 2.035
12 1 −1 1 1 −1 1 −1 −1 2.607
13 1 −1 1 −1 −1 −1 1 1 2.838
Phosphate buffer showed lower coefficients, 0.057, and −0.090, respec- tively compared to that of other variables. It indicates that these variables can be deleted in experiments for optimizing the amounts. As the NaMo·4H2O, Fe-EDTA showed positive coefficients, the higher levels of these components are suggested for further experiments. In contrast, CaCl2·H2O and CuCl2·2H2O showed negative coefficients.
The lower levels of these components are suggested for future exper- iments.
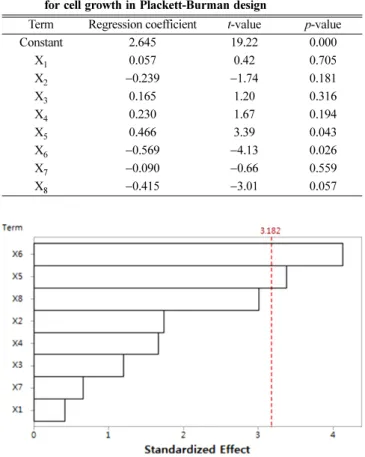
The Pareto chart of main effects as shown in Fig. 2 displays the order of significance of the factors affecting the cell growth and is a convenient way to view the results of a Plackett-Burman design. The maximal effect was presented in the upper portion of the chart and then progressed down to the minimal effect. The order of significance as indicated by the chart is vitamin stock, trace element solution, CuCl2·2H2O, CaCl2·H2O, Fe-EDTA, NaMo·4H2O, phosphate buffer and MgSO4·7H2O. The vertical line on the chart judges the effects which are statistically significant at the 95% confidence level. According to the Pareto chart, vitamin stock was the most significant factor, subse- quently trace element solution was the next most significant factor.
4. Conclusions
We isolated a novel methylotrophic bacterium, identified as Meth-
ylobacterium sp. WJ4, from soil collected in Dongducheon Environ- ment Affairs Agency. Plackett-Burman design was used to screen the most important growth factors among eight medium components of NMS medium for the cell growth. The effects of eight medium compo- nents were evaluated by Plackett-Burman design. Among them, trace element solution and vitamin stock were found to be significant com- ponents for the cell growth. These results based on ANOVA indicate that trace element solution and vitamin stock play a key role in the cell growth. The effects of trace element solution and vitamin stock can be further investigated to find the optimal concentration.
References
1. Hou, C.-T., Methylotrophs: Microbiology, biochemistry, and genetics, CRC pp. 1-53(1984).
2. Faust, U. and Präve, H., “Biomass from Methane and Metha- nol,” Biotechnology. VCH Weinheim 3, 84-108(1991).
3. Kim, P., Kim, J. H. and Oh, D. K., “Improvement in Cell Yield of Methylobacterium sp. by Reducing the Inhibition of Medium Components for Poly-β-hydroxybutyrate Production,” World J. Micro- biol. Biotechnol., 19, 357-361(2003).
4. Schrader, J., Schilling, M., Holtmann, D., Sell, D., Filho, M. V., Marx, A. and Vorholt, J. A., “Methanol-based Industrial Biotechnol- ogy: Current Status and Future Perspectives of Methylotrophic Bac- teria,” Trends Biotechnol., 27, 107-115(2009).
5. Green, P. N., Methylobacterium, The prokaryotes, Springer, pp.
257-265(2006).
6. Corpe, W. and Rheem, S., “Ecology of the Methylotrophic Bacte- ria on Living Leaf Surfaces,” FEMS Microbiol. Ecol., 5, 243-249 (1989).
7. Hirano, S. S. and Upper, C. D., “Bacterial Community Dynamics, Microbial Ecology of Leaves,” Springer, pp. 271-294(1991).
8. Sirirote, P., Tsuneo, Y. and Shoichi, S., “L-serine Production from Methanol and Glycine with An Immobilized Methylotroph,” J.
Ferment. Technol., 66, 291-297(1988).
9. Bélanger, L., Figueira, M., Bourque, D., Morel, L., Béland, M., Laramée, L., Groleau, D. and Míguez, C., “Production of Heter- ologous Protein by Methylobacterium extorquens in High Cell Density Fermentation,” FEMS Microbiol. Lett., 231, 197-204(2004).
10. Choi, Y. J., Gringorten, J. L., Bélanger, L., Morel, L., Bourque, D., Masson, L., Groleau, D. and Míguez, C. B., “Production of An Insecticidal Crystal Protein from Bacillus Thuringiensis by the Methylotroph Methylobacterium extorquens,” Appl. Environ. Micro- biol., 74, 5178-5182(2008).
11. Carroll, S. M., Chubiz, L. M., Agashe, D. and Marx, C. J., “Par- allel and Divergent Evolutionary Solutions for the Optimization of an Engineered Central Metabolism in Methylobacterium extorquens AM1,” Microorganisms 3, 152-174(2015).
12. Stanbury, P. F., Whitaker, A. and Hall, S. J., Principles of fer- mentation technology, Elsevier(2013).
13. Quan, Y., Liu, Y. and Xie, S., “Optimization of Fermentation Medium for Glycyrrhizin Biotransformation to Monoglucuronyl-glycyr- rhetinic Acid by Plackett-Burman and Box-Behnken Design,”
Korean Chem. Eng. Res., 53, 321-326(2015).
14. Li, C., Bai, J., Cai, Z. and Ouyang, F., “Optimization of a Cultural Medium for Bacteriocin Production by Lactococcus lactis Using Table 4. Regression coefficients and corresponding t-value and p-value
for cell growth in Plackett-Burman design
Term Regression coefficient t-value p-value
Constant 2.645 19.22 0.000
X1 0.057 0.42 0.705
X2 −0.239 −1.74 0.181
X3 0.165 1.20 0.316
X4 0.230 1.67 0.194
X5 0.466 3.39 0.043
X6 −0.569 −4.13 0.026
X7 −0.090 −0.66 0.559
X8 −0.415 −3.01 0.057
Fig. 2. Pareto chart of eight-factor standardized effects on cell growth. X1: MgSO4·7H2O, X2: CaCl2·H2O, X3: NaMo·4H2O, X4: Fe-EDTA, X5: Trace element solution, X6: Vitamin stock, X7: phosphate buffer, X8: CuCl2·2H2O.
Response Surface Methodology,” J. Biotechnol., 93, 27-34(2002).
15. Box, G. E., Hunter, J. S. and Hunter, W. G., Statistics for Exper- imenters: Design, Innovation, and Discovery, Wiley-Interscience New York(2005).
16. Delaney, N. F., Kaczmarek, M. E., Ward, L. M., Swanson, P. K., Lee, M. C. and Marx, C. J., “Development of An Optimized Medium,” Strain and High-throughput Culturing Methods for Methylobacterium extorquens, PLoS One, 8, e62957(2013).
17. Whittenbury, R., Phillips, K. and Wilkinson, J., “Enrichment, Isolation and Some Properties of Methane-utilizing Bacteria,”
Microbiology, 61, 205-218(1970).
18. Dedysh, S. N. and Dunfield, P. F., Cultivation of Methanotrophs, Hydrocarbon and Lipid Microbiology Protocols, Springer protocols handbooks. Berlin: Springer-Verlag (2014).
19. Sanger, F., Nicklen, S. and Coulson, A. R., “DNA Sequencing with Chain-terminating Inhibitors,” Proc. Natl. Acad. Sci. U.S.A., 74, 5463-5467(1977).
20. Kumar, S., Stecher, G. and Tamura, K., Mega7: Molecular evo- lutionary genetics analysis version 7.0 for bigger datasets, Mol.
Biol. Evol., 1870-1874(2016).
21. Crolla, A. and Kennedy, K., “Optimization of Citric Acid Produc- tion from Candida lipolytica Y-1095 Using n-paraffin,” J. Biotech- nol., 89, 27-40(2001).
22. Abdel-Fattah, Y. R., Saeed, H. M., Gohar, Y. M. and El-Baz, M.
A., “Improved Production of Pseudomonas aeruginosa Uricase by Optimization of Process Parameters Through Statistical Experi- mental Designs,” Process Biochem., 40, 1707-1714(2005).