321 http://dx.doi.org/10.9713/kcer.2015.53.3.321
PISSN 0304-128X, EISSN 2233-9558
Optimization of Fermentation Medium for Glycyrrhizin Biotransformation to Monoglucuronyl-glycyrrhetinic Acid by Plackett-Burman and Box-Behnken Design
Yanling Quan*, Lin Wang*, Yisheng Liu*, Jingxiang Cong*, Shengquan Xie** and Xiuhong Wu*,†
*Department of Chemistry and Engineering, University of Science and Technology of Liaoning, Anshan, Liaoning 114051, China
**Liaoning Economic Vocational Technology Institute, Shenyang, Liaoning 110122, China (Received 31 July 2014; Received in revised form 25 September 2014; accepted 13 October 2014)
Abstract: Plackett-Burman (PB) and Box-Behnken (BB) experimental designs were used to optimize fermentation variables for the biotransformation of glycyrrhizin (GL) to monoglucuronyl-glycyrrhetinic acid (MGGA). The PB design was first used to screen the important factors among the medium variables. The steepest ascent method was used to approach the optimum range for each of these factors. The BB design was finally used to analyze the response surfaces of the screened factors for further optimization. The optimized conditions for this system were 0.7 g/L MgSO4·7H2O, 1.19 g/L GL, and cultivation for six days. The biotransformation of GL to MGGA could reach up to 35.72%, which is a good result for this kind of transformation.
Key words: Glycyrrhizin, Aspergillus niger, Plackett-Burman Design, Biotransformation, Box-Behnken Design
1. Introduction
Natural products have been used for thousands of years to pro- mote health and treat diseases, especially in countries such as China, Japan, and Korea. With the development of modern technologies, the exact functions of the components of many of these natural products have been elucidated. For example, the active compo- nents of ginseng are ginsenosides, including ginsenosides Rg1, Rg2, Rg3, Rb1, Rb2, and Re. These major components have neuro- protective, cardioprotective, antioxidant, antidiabetic, and antican- cer effects [1-3]. Glycyrrhizin, the major component of liquorice root (Glycyrrhiza glabra), has been shown to have anti-inflammatory, anticancer, and antiviral properties [4,5]. In ginkgo, the active com- ponents are ginkgolides. These components, especially ginkgolide B, present antihypertensive, anti-anaphylactic, and cardioprotec- tive effects [6,7].
In addition to the major components of natural herbs, some rare components have attracted increasing attention because of their physiological effects. For example, taxol and ginsenoside Rh2 are rare components that are effective in cancer treatment [8-11]. For the large-scale preparation of rare components such as ginsenoside Rh2, enzymatic biotransformation may be a feasible method [12-14].
Through hydrolysis of two glucuronides, glycyrrhizin (GL) is trans- formed to glycyrrhetinic acid (GA). If one glucuronide is cleaved, glycyrrhizin is converted to monoglucuronyl-glycyrrhetinic acid (MGGA). Because of its moderate polarity, MGGA is more soluble
and more readily transported through the cell membrane than GL and GA. It has been shown that MGGA has a more potent pharmaco- logical effect than GL and GA [15]. With the help of enzymes, major components can be converted to rare components. Although bio- reactions typically require mild reaction conditions and have rela- tively high selectivity, product yields are still relatively low owing to the complexity of these systems. To optimize complex biotransfor- mation systems, statistical methods such as Plackett-Burman (PB) design and Box-Behnken (BB) design are often used [16,17].
We used PB and BB experimental designs to optimize fermentation variables for the biotransformation of GL to MGGA. Under optimal conditions, the bioconversion may reach 35.72%.
2. Materials and Methods
2-1. Materials 2-1-1. Microorganism
Aspergillus niger was isolated at the Department of Microorgan- isms of the University of Science and Technology of Liaoning and identified according to its morphology and rDNA gene sequence (CPCC 480386) by Sangon Biotech (Shanghai) Co. Ltd.
2-1-2. Media
The composition of the slope plate medium was as follows (g/L):
potato juice, 200; glucose, 20.00; peptone, 10.00; agar, 20.00 (pH 5.50). The composition of the seed culture medium was as follows (g/L): potato juice, 20.00; raw extract of GL, 1.00; glucose, 10.00;
peptone, 10.00 (pH 5.50), and that of the basal fermentation medium was as follows (g/L): 98% GL, 1.20; NaNO3, 1.50; K2HPO4, 1.00;
MgSO4·7H2O, 0.50; FeSO4, 0.1; peptone, 1.00 (pH 5.50). All media were sterilized at 121oC for 20 min.
†To whom correspondence should be addressed.
E-mail: [email protected]
This is an Open-Access article distributed under the terms of the Creative Com- mons Attribution Non-Commercial License (http://creativecommons.org/licenses/by- nc/3.0) which permits unrestricted non-commercial use, distribution, and reproduc- tion in any medium, provided the original work is properly cited.
2-2. Methods
2-2-1. Preparation of A. niger seed culture
Under sterile conditions, an A. niger spore suspension was prepared by washing spores from slope plates with sterile water. The suspen- sion was cultivated for 72 h in a rotary shaker at 28oC and 160 r/min.
Under sterile conditions, the seed culture was filtered through gauze and washed several times with sterile water until the prepared myce- lial suspension contained no GL, as determined by HPLC. The seed culture was then used for further experiments.
2-2-2. Preparation of fermentation culture
Ten milliliters of seed culture was inoculated into 100 mL of fer- mentation medium in a 250 mL Erlenmeyer flask and cultured in a rotary shaker at 160 r/min and 28oC for 120 h. The fermentation cul- ture was centrifuged at 4000 r/min for 10 min and the supernatant was analyzed by HPLC. The percent transformation of GL was cal- culated with the following formula:
where A is the percent transformation, C0 is the initial concentration of GL (mg/L) at the start of fermentation, V0 is the initial volume (mL) of transformation broth, C1 is the concentration of MGGA (mg/L), and V1 is the final volume of fermentation medium. Concentrations of GL and MGGA were measured using an Agilent 1100 HPLC system (Agilent Technologies, USA) with an Agilent Extend-C18 column (4.6 mm×150 mm, 5 μm). The following conditions were used for HPLC: mobile phase, 85:15 (v/v) methanol:3.0% acetic acid;
column temperature, 25.0oC; flow rate, 1.00 mL/min; wavelength, 254 nm; UV detector.
2-3. Experimental design 2-3-1. Plackett-Burman design
PB designs, first described by Plackett and Burman [18], are satu- rated two-level experimental designs based on balanced incomplete blocks. With this method, the main effects can be detected with fewer experimental runs, so important factors influencing an outcome can be identified rapidly and efficiently for subsequent investigation [16].
2-3-2. Steepest ascent method
Once the most influential factors have been identified using PB design, the steepest ascent method can be used to approach the opti- mal range for each factor, and then effective response surface equa- tions can be established. The steepest ascent method takes the direction of the gradient to be the direction of ascent. The step length is based on the efficient value of various factors. With this method, the optimal range of each influence factor can be determined rapidly and eco- nomically.
2-3-3. Box-Behnken design
BB design is a statistical method for solving multivariate problems
that uses multivariate quadratic equations to search the fitting func- tion of influence factors and their response values. The optimization procedure is based on analysis of the regression equation. Compared with other methods used to determine optimal levels of influence factors, such as single-factor experimental and orthogonal designs, BB designs require less experimental time and lead to a more accurate regression equation. BB designs can also be used to explore interac- tions between several key factors. The method has been widely used to reduce exploration costs, optimize working conditions, and improve product quality in areas such as agriculture, food science, and chem- istry [19-20].
3. Results and Discussion
3-1. Estimation of the main influence factors
This fermentation system contained the basic elements required to support Aspergillus niger growth, including nutrients such as peptone, nitrogen (applied by NaNO3), phosphorus, and K (applied by K2HPO4) and other inorganic elements such as Na (applied by NaNO3), mag- nesium (applied by MgSO4·7H2O), and ferrum (applied by FeSO4).
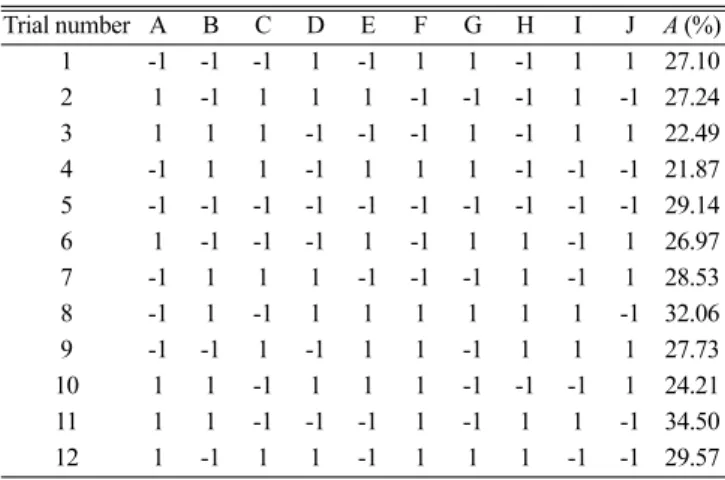
With respect to biotransformation of GL, the concentration of GL was one of the important factors that needed optimization. Gener- ally, the effects of pH and cultivation temperature should be consid- ered in a fermentation process. However, in this work, ten influence factors were investigated: pH (A), temperature (B), GL concentration (C), inoculum size (D), peptone (E), NaNO3 (F), K2HPO4 (G), MgSO4· 7H2O (H), FeSO4 (I), and cultivation time (J). Software Design- Expert 8.0.6 was used to design the PB experiment. According to the number of factors in the biotransformation system, the number of experi- mental runs was set to N=12. Low and high levels of each factor were considered. The response variable used was percent biotrans- formation, and parallel experiments were carried out. Details of the experimental design as well as the results of the experiment are shown in Table 1. Statistical analysis was performed using SPSS software.
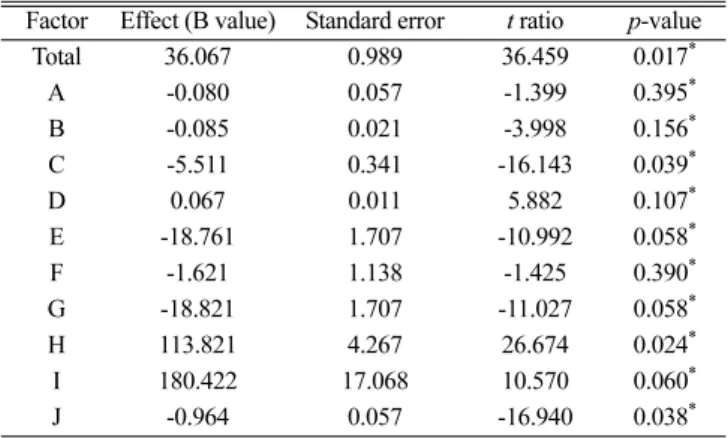
The effects of the various factors on the response variable are listed in Table 2, which shows that factors C, H, and J had significant effects (p A% C1V1
C0V0 --- 100%×
=
Table 1. Plackett-Burman design (coded values) and corresponding response variable measurements (percent transformation; A) (N=12)
Trial number A B C D E F G H I J A (%)
1 -1 -1 -1 1 -1 1 1 -1 1 1 27.10
2 1 -1 1 1 1 -1 -1 -1 1 -1 27.24
3 1 1 1 -1 -1 -1 1 -1 1 1 22.49
4 -1 1 1 -1 1 1 1 -1 -1 -1 21.87
5 -1 -1 -1 -1 -1 -1 -1 -1 -1 -1 29.14
6 1 -1 -1 -1 1 -1 1 1 -1 1 26.97
7 -1 1 1 1 -1 -1 -1 1 -1 1 28.53
8 -1 1 -1 1 1 1 1 1 1 -1 32.06
9 -1 -1 1 -1 1 1 -1 1 1 1 27.73
10 1 1 -1 1 1 1 -1 -1 -1 1 24.21
11 1 1 -1 -1 -1 1 -1 1 1 -1 34.50
12 1 -1 1 1 -1 1 1 1 -1 -1 29.57
< 0.05). In Table 2, the B value indicates a positive or negative effect of the factor. A positive value for B implies that the corresponding factor should be increased in the next experiment, whereas a nega- tive value implies that the corresponding factor should be decreased.
Therefore, MgSO4·7H2O (H) was increased and cultivation time (J) and GL concentration (C) were decreased in the subsequent steepest ascent experiment.
Table 2 shows that magnesium exerts greater effects than do sodium and ferrum. This could be mainly attributed to the fact that magnesium is a necessary trace element for all organisms and plays important roles in physiological activities and, as a cofactor for many enzymes, in energy metabolism, protein and nucleic acid synthesis, and the regulation of cell cycle and cell death.
3-2. Estimation of the levels of optimal factors by the steepest ascent method
Based on the results shown in Table 2, a steepest ascent experi- ment was conducted. The tested ranges for the most important factors
are shown in Table 3. The other factors were maintained at optimal levels. The corresponding biotransformation results are also shown in Table 3.
As shown in Table 3, the highest percent biotransformation was obtained in trial 2. Therefore, the factor levels from this trial were used as the central point for response surface optimization in the sub- sequent Box-Behnken experiment.
3-3. Estimation of optimal levels of the main factors by Box- Behnken design
The results of the steepest ascent experiment were used to deter- mine the factors and levels to be tested in the BB design. Details of the design are shown in Table 4.
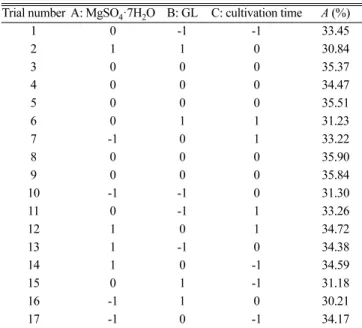
According to the principle of BB design, three influence factors, each with three levels, were used for the response surface analysis experiment. Two types of experimental data points were selected: the factorial point and the zero point, which was the central point of the investigated range. The results of the 17 trials are shown in Table 5.
3-4. Analysis of BB experimental data
Percent biotransformation was the response variable. Multivariate regression analysis was carried out based on the results shown in Table 5 using the software Design-Expert 8.0.6. The results of the analysis are shown in Table 6. After regression and fitting, a quadratic polynomial regression model was obtained. The response value expressed in terms of variables A, B, and C (coded value) is as follows:
A% = 35.42 + 0.70A - 1.12B - 0.12C - 0.61AB + 0.27AC + 0.062BC - 0.092A2 - 2.82B2 - 0.32C2
where A was the dependent variable, the arithmetic mean response of the 17 runs was 35.42, and the estimated coefficients for factors A, B, and C were 0.70, -1.12, and -0.12, respectively. The main effects (A and B) represented the average result of changing one factor at a time from a low to high value. The interactive terms (AB, BC, and AC) show how the response changes when three factors were simultaneously changed. The polynomial terms (A2, B2, and C2) were included to investigate nonlinearity. The regression model needed to be evaluated for model significance and the lack-of-fit. Analysis of variance (ANOVA) was used for these evaluations. As shown in Table 6, both linear and quadratic terms of the equation were Table 2. Regression coefficients and their significance (Sig.) level
Factor Effect (B value) Standard error t ratio p-value
Total 36.067 0.989 36.459 0.017*
A -0.080 0.057 -1.399 0.395*
B -0.085 0.021 -3.998 0.156*
C -5.511 0.341 -16.143 0.039*
D 0.067 0.011 5.882 0.107*
E -18.761 1.707 -10.992 0.058*
F -1.621 1.138 -1.425 0.390*
G -18.821 1.707 -11.027 0.058*
H 113.821 4.267 26.674 0.024*
I 180.422 17.068 10.570 0.060*
J -0.964 0.057 -16.940 0.038*
*Significant at p < 0.05
Table 3. Steepest ascent design and corresponding response values Trial
number
Cultivation time (days)
MgSO4·7H2O (g/L)
GL (g/L)
A (%)
1 7 0.5 1.5 23.357
2 6 0.7 1.25 35.356
3 5 0.9 1 32.672
4 4 1.1 0.75 26.159
GL, glycyrrhizin; A= percent transformation
Table 4. Factors and levels for the Box-Behnken design
Variable No. Factor Unit Lower level (-1) Fixed Level Upper level (1)
A MgSO4·7H2O g/L 0.6 0.8
B GL g/L 1.0 1.5
C Cultivation time day 5 7
Fixed Peptone g/L 1.0
Fixed NaNO3 g/L 2.0
Fixed K2HPO4 g/L 1.0
Fixed FeSO4 g/L 0.1
Fixed Inoculum size mL 1.0
Fixed Temperature °C 28.0
Fixed pH 5.50
significant, indicating a nonlinear relationship between the influence variables and percent biotransformation. The coefficient of deter- mination for the regression equation is R2= 0.9688, indicating that the model is a good fit to the experimental data. The adjusted R2 indicates that the three influence factors identified in the PB experiment explained 92.88% of the variance in the response variable. In addition, the lack of fit P >F was 0.7167; therefore, the model has practical significance [20,21].
According to the regression equation and the analysis summa- rized in Table 6, fitted surfaces of each pair of factors in the reaction analysis can be derived; the three-dimensional plots of interactions are shown in Figs. 1-3.
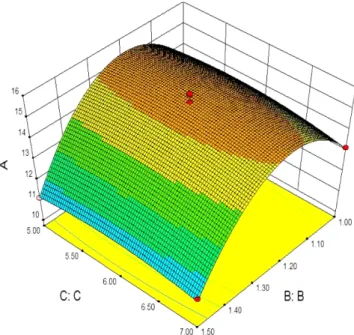
Figs. 1-3 show that the relationship between each pair of factors is parabolic. Fig. 1 shows that GL affected the percent biotransforma- tion more significantly than MgSO4·7H2O. The optimum glycyr- rhizin concentrations were located between 1.00 and 1.30. As can be Table 5. Box-Behnken experimental design and corresponding response
values (percent transformation; A)
Trial number A: MgSO4·7H2O B: GL C: cultivation time A (%)
1 0 -1 -1 33.45
2 1 1 0 30.84
3 0 0 0 35.37
4 0 0 0 34.47
5 0 0 0 35.51
6 0 1 1 31.23
7 -1 0 1 33.22
8 0 0 0 35.90
9 0 0 0 35.84
10 -1 -1 0 31.30
11 0 -1 1 33.26
12 1 0 1 34.72
13 1 -1 0 34.38
14 1 0 -1 34.59
15 0 1 -1 31.18
16 -1 1 0 30.21
17 -1 0 -1 34.17
Table 6. ANOVA for Box-Behnken design quadratic model
Source Sum of squares df Mean square F value P value Significance
Model 55.26 9 6.14 24.18 0.0002 Significant
A 3.95 1 3.95 15.56 0.0056
B 9.96 1 9.96 39.22 0.0004
C 0.12 1 0.12 0.46 0.5177
AB 1.51 1 1.51 5.94 0.0450
AC 0.29 1 0.29 1.14 0.3214
BC 0.016 1 0.016 0.061 0.8118
A2 3.57 1 3.57 14.05 0.0072
B2 33.41 1 33.41 131.58 <0.0001
C2 0.44 1 0.44 1.72 0.2312
Residual 1.78 7 0.25
Lack of fit 0.47 3 0.16 0.47 0.7167 Not significant
Pure error 1.31 4 0.33
Corrected total 57.04 16
R2 0.9688 Adj. R2 0.9288
Fig. 1. Fitted surface for percent transformation as a function of MgSO4·H2O (A) and glycyrrhizin (B).
Fig. 2. Fitted surface for percent transformation as a function of MgSO4·H2O (A) and cultivation time (C).
seen from Figs. 2 and 3, MgSO4·7H2O and GL concentrations affected the percent biotransformation more significantly than cultivation time. The point at which the percent biotransformation was the high- est for each factor is indicated in each of the three figures. The optimal conditions derived from the regression equation are 1.19 g/L GL, 0.7 g/L MgSO4·7H2O, and cultivation for 6 days. A maximum transforma- tion of 35.72% was obtained under these conditions (Fig. 4). The result obtained is better than that obtained in a previous study [22].
4. Conclusion
Plackett-Burman design was applied to investigate ten fermenta- tion variables to estimate the most important factors influencing the biotransformation of GL to MGGA. The results showed that GL,
MgSO4·7H2O, and cultivation time were the most influential fac- tors. Decreasing the cultivation time and the concentration of GL and increasing the concentration of MgSO4·7H2O could increase the bio- transformation of GL to MGGA. To determine the central point of the response surface in a reasonable and simple way, a steepest ascent experiment was performed to approach the central point. The best fermentation conditions were determined to be 1.00 g/L GL, 0.7 g/L MgSO4·7H2O, and six days cultivation time. Subsequently, Box- Behnken (BB) design and response surface analysis were used. A regression model was derived from the BB design and the results showed that there was a maximum point. The optimal fermentation conditions determined by the BB design were 1.19 g/L GL, 2.0 g/L NaNO3, 0.7 g/L MgSO4·7H2O, 1.0 g/L K2HPO4, 0.1 g/L FeSO4, 1.0 g/L peptone, pH 5.50, an inoculum size of 10.0 mL, a temperature of 28.0oC, and a cultivation time of 6 days, and under these conditions, better percent biotransformation could be achieved.
The application of both Plackett-Burman and Box-Behnken design provided a rapid and effective means to identify the most influential factors for the biotransformation of GL to MGGA. The optimization results fitted very well with the actual fermentation results.
References
1. Yun, T. K. and Choi, S. Y., “Preventive Effect of Ginseng Intake Against Various Human Cancers: A Case-Control Study on 1987 Pairs,” Cancer. Epidem. Biomar., 4(4), 401-408(1995).
2. Rudakewich, M., Ba, F. and Benishin, C. G., “Neurotrophic and Neuroprotective Actions of Ginsenosides Rb1and Rg1,” Planta.
Med., 67, 533-537(2001).
3. Peng, L., Sun, S., Xie, L. H., Wicks, S. M. and Xie, J. T., “Ginseno- side Re: Pharmacological Effects on Cardiovascular System,”
Cardiovasc. Ther., 30(4), 183-188(2002).
4. Wang, Z. X., Song, J. L. and Yang, G. Z., “Current status of Study on Glycyrrhizin,” Chinese. J. Integr. Tradit. West. Med., 22, 796- 798(2002).
5. Cong, J. X. and Lin, B. C., “Separation of Liquiritin by Simulated Moving Bed Chromatography,” J. Chromatogr. A., 1145, 190-194 (2007).
6. Wang, X. and Zhang, H. I., “Advances in Studies on Pharmaco- logical Activities of Ginkgolides,” Chinese. Tradit. Herbal. Drugs.
36(11), 1741-1744(2005).
7. Xia, S. H. and Fang, D. C., “Pharmacological Action and Mech- anisms of Ginkgolides B,” Chinese. Med. J., 120(10), 922-928 (2007).
8. Clarke, K., Lee, F. T., Brechbiel, M. W., Smyth, F. E., Old, L. J., and Scott, A. M., “Therapeutic Efficacy of Anti-Lewisy Human- ized 3S193 Radioimmunotherapy in a Breast Cancer Model:
Enhanced Activity When Combined with Taxol Chemotherapy,”
Clin. Cancer. Res., 6, 3621-3628(2000).
9. Hou, J. G., Xue, J. J., Wang, C. Y., Liu, L., Zhang, D. L., Wang, Z., Li, W., Zheng, Y. N. and Sung, C. K., “Microbial Transformation of Ginsenoside Rg3 to Ginsenoside Rh2 by Esteya Vermicola CNU 120806,” World. J. Microbiol. Biotechnol., 28, 1807-1811(2012).
10. Kim, H. S., Lee, E. H., Ko, S. R., Choi, K. J., Park, J. H. and Im, D. S., “Effects of Ginsenosides Rg3 and Rh2 on the Proliferation of Fig. 3. Fitted surface for percent transformation as a function of
cultivation time (B) and glycyrrhizin (C).
Fig. 4. Chromatogram of the biotransformation of GL. Chromatog- raphy condition: column, Extend C18 (4.6 mm×150 mm); mobile phase, methanol and 3.20% acetic acid (85:15, v/v); mobile phase rate, 1.00 ml/min; column temperature 25 °C; UV detector;
detective wavelength, 254 nm; injection amount, 10 µl.
Prostate Cancer Cells,” Arch. Pharrn.Res. 27(4), 429-435(2004).
11. Sirikantaramas, S., Asano, T., Sudo, H., Yamazaki, M. and Saito, K., “Camptothecin: Therapeutic Potential and Biotechnology,”
Curr. Pharm. Biotechno., 8, 196-202(2007).
12. Liu, Y. C., Chen, G. Y., Ge, F. L., Li, W., Zeng, L. H. and Cao, W. G., “Efficient Biotransformation of Cholesterol to Androsta- 1,4-diene-3,17-dione by a Newly Isolated Actinomycete Gord- onia Neofelifaecis,” World. J. Microbiol. Biotechnol. 27, 759-765 (2011).
13. Gouiric, S. C., Feresin, G. E., Tapia, A. A., Rossomando, P. C., Schmeda-Hirschmann, G. and Bustos, D. A., “7b-Dihydroxydehy- droabietic acid, a New Biotransformation Product of Dehydroa- bietic Acid by Aspergillus Niger,” World. J. Microbiol. Biotechnol.
20, 281-284(2004).
14. Hu, S. C., Hong, K., Song, Y. C., Liu, J. Y. Tan, R. X., “Biotransfor- mation of Soybean Isoflavones by a Marine Streptomyces sp.
060524 and Cytotoxicity of the Products,” World. J. Microbiol.
Biotechnol., 25, 115-121(2009).
15. Zou, S. P., Zhou, J. J., Kaleem, I., Xie, L. P., Liu, G. Y., Li, C.,
“Preparative Enrichment and Separation of Glycyrrhetinic Acid Monoglucuronide from Fermentation Broths with Macroporous Res- ins,” Sep. Sci Technol., 47, 1055-1062(2012).
16. Li, Y., Liu, Z. Q., Cui, F. J., Liu, Z. S. and Zhao, H., “Application of Plackett-Burman Experimental Design and Doehlert Design to
Evaluate Nutritional Requirements for Xylanase Production by Alter Naria Mali ND-16,” Appl. Microbiol. Biotechnol. 77, 285- 291(2007).
17. Palvannan, T. and Sathishkumar, P., “Production of Laccase from Pleurotus florida NCIM 1243using Plackett-Burman Design and Response Surface Methodology,” J. Basic. Microb. 50, 325-335 (2010).
18. Plackett, R. L. and Burman, J. P., “The Design of Optimum Multi- factorial Experiments,” Biometrika, 37, 305-325(1946).
19. Jacques, P., Hbid, C., Destain, J., Razafindralambo, H., Paquot, M., Pauw, E. D. and Thonart, P., “Optimization of Biosurfactant Lipopeptide Production from Bacillus subtilis S499 by Plackett- Burman Design,” Appl. Biochem. Biotechnol., 77-79, 223-233 (1999).
20. Yue, P. F., Zheng, Q., Wu, B., Hu, P. Y., Wu, Z. F. and Yang, M.,
“Application of Plackett-Burman Design and Box-Behnken Design to Achieve Process Optimization for Geniposide Submicron Emul- sion,” J. Dispersion Sci. Technol., 33, 213-222(2012).
21. Mahdavi, V. and Monajem, A., “Statistical Optimization for Oxida- tion of Ethyl Benzene over Co- Mn/SBA-15 catalyst by Box-Behnken Design,” Korean J. Chem. Eng., 33, 2178-2185(2013).
22. Wu, S. J., Yong, Z. J., Zhu, L. H. and Jin, F. X., “Study on Biotrans- formation of Glycyrrhizin,” Chinese. Tradit. Herbal. Drugs. 34, 516-518(2003).