Print ISSN: 2233-4165 / Online ISSN: 2233-5382 doi:http://dx.doi.org/10.13106/ijidb.2019.vol10.no1.29.
Uncertainty and Manufacturing Stock Market in Korea
Ji-Hong Jeon
*Received: December 11, 2018. Revised: January 03, 2018. Accepted: January 10, 2019.
Abstract
Purpose - We study the dynamic linkages of the economic policy uncertainty (EPU) in the US on the manufacturing stock market returns in Korea. In detail, we examine the casual link between EPU index in the US and the manufacturing stock indexes in Korea.
Research design, data, and methodology - We measure mainly the distribution effect of the US EPU on the manufacturing stock market in Korea of 1990-2017 by the vector error correction model (VECM).
Result - In result, we estimate the impact of the US EPU index has significantly a negative response to the manufacturing stock market in Korea such as non-metal stock index, chemical stock index, food stock index, textile·clothes stock index, automobile·shipbuilding stock index, machinery stock index, steel·metal stock index. Also the remaining variables such as electric·electronics stock index, S&P 500, and producer price index in Korea have a negative relationship with US EPU index.
Conclusions - We find out that the relationship between EPU index of the US and the manufacturing stock market in Korea has the negative relationships. We determine the EPU of the US has the spillover effect on the industry stock markets in Korea.
Keywords: Manufacturing Stock Market, Economy Policy Uncertainty, VECM.
JEL Classifications: C32, E60.
1. Introduction
The share of manufacturing in the industrial economy is so much larger than any other industries. According to the 2017 Bloomberg Innovation Index, Korea ranked first in the world in research and development intensity versus GDP, manufacturing value-added, and patent activity in 2016, among the world's most innovative economies. We find that manufacturing plays a leading part of Korean economy.
By the Korea Customs Service, the US is the second largest exporter in Korea, followed by China. The US economy is closely related to Korea's industrial economy.
We suggest the dynamic linkages of the US economic policy uncertainty (EPU) on Korea 's industrial economy, especially on manufacturing. If the US economic policy is uncertain, the US economy will deteriorate and it has a bad influence on US exports, which may ultimately lead to the production of Korean manufacturing.
In other words, the manufacturing productivity is interrelated
* First Author and Corresponding Author, Adjunct Professor, School of Business, Hanyang University, Korea.
Tel: +82-2-2220-2435, E-mail: [email protected]
to Gross Domestic Product (GDP), employment (Bloom, 2009; Born & Pfeifer, 2014). Increased productivity increases employment and investment (Foster, Haltiwanger, & Krizan, 2006). In addition, Baker, Bloom, and Davis (2016) also show that GDP growth is interrelated to the US EPU. In detail, if the EPU of a country rises, the economy will deteriorate and the GDP growth rate will slow down. Thus, the EPU is interrelated to the production of the manufacturing sector.
This study analyzes the stock price indexes of manufacturing in order to understand Korea's industrial economy by using the US EPU index. Previous studies have explored macroeconomic variables based on economic or policy uncertainty (Abel, 1983; Bachmann, Elstner, & Sims, 2013; Fernandez-Villaverde, Pablo, Keith, & Juan, 2015).
This study not only provides the dynamic link of EPU index reflecting the economic uncertainty but also the policy on the industrial economy of Korea through empirical analysis.
This study is interesting in analyzing the manufacturing more finely compared with previous studies on EPU. Our main research findings provide the impact of the US EPU on each industry stock market returns of manufacturing in Korea and examine the contribution of the different economic mechanisms and effect to the US EPU shock.
and Turtle (2000) study the response to the stock market during the political election period for 33 countries including the US and Korea. In the two weeks prior to the political election, they found that it is positive and meaningful stock market reactions. Thus, they estimate the asset value increases as uncertainty increases and uncertainty resolves just before the election process. Beltratti and Morana (2010) argue that the G-7 countries, especially the US do a key role to global economic fluctuations by creating a global economic crisis. Specifically, they have a large impact on real economic activities such as stock prices. Lee (2010) studies the news shocks on the volatile movement of internal financial markets.
Gourio, Siemer, and Verdelhan (2013) study the relationships among unemployment rate, the world realized volatility, and industrial production (IP) in G7 countries with monthly data. They document the higher disaster risk exposures in a worldwide recession, the larger productivity and capital shocks in a country.
Kang and Ratti (2013) also study that the increase in the US uncertainty has a negative impact on stocks. The impact of oil prices has heightened EPU and adversely affected European stocks and energy exporters, Canada. The impact of EPU in the US has a key impact on the macroeconomics than in the European counterpart.
Bloom (2014) notes that stock market volatility and GDP volatility are often used as a means of uncertainty about US economic policy uncertainty (EPU), because the volatility is becoming more volatile and uncertainty is increasing if unpredictable. Especially in the recession, the volatility of S&P 500 is even higher.
Antonakakis, Gupta, and Andre (2015) examine the relation between the stock market volatility (VIX) and EPU.
They find that the unconditional correlation between EPU and VIX is negative. Besides, EPU has a negative relation with housing market and IP.
Jurado, Ludvigson, and Ng (2015) show the uncertainty shocks and business cycles. They estimate how economic uncertainty can affect the macroeconomic volatility. Choi &
Loungani (2015) explore the relationship between uncertainty shocks and unemployment dynamics using S&P 500. They suggest that the more aggregate uncertainties, the more unemployment rate. Leduc and Liu (2016) show the uncertainty and an aggregate demand shock is a negative
and exchange rate in South Korea. In an empirical result, the monetary policy in China has a negative relation with exchange rate by using the VECM. Jeon (2018) documents the housing market in Korea using Asian EPU indexes.
Section 3 evaluates the sample we use to estimate the empirical methodology. Section 4 provides the summary of the VECM. Section 5 provides the discussions. Section 6 concludes and offers the summary, limitations, and future studies.
3. Sample and methodology 3.1. Sample
Sample frequencies are monthly. The sample used to this study includes the period 1990-2017. In the model with the EPU index of the US, non-metal stock index (NSI), chemical stock index (CSI), food stock index (FSI), textile·clothes stock index (TSI), automobile·shipbuilding stock index (ASI), machinery stock index (MSI), electric·electronics stock index (ESI), steel·metal stock index (SSI), producer price index (PPI) in Korea, and S&P 500.
Firstly, the EPU index is gained by Baker et al. (2016) and determines economic-related policy uncertainty of the US. The EPU index of the US contains the following three words about the ‘economy’, ‘policy’, ‘uncertainty’ from leading newspapers such as Washington Post, Dallas Morning News, Boston Globe, and so on. The EPU index calculates the article volume and standardize monthly the newspaper series, and normalize the newspapers using a mean of 100 for 1985-2009 to make the EPU index.
The stock index in Korea and S&P 500 for this study is collected by Fnguide in Korea. The PPI is obtained from the Bank of Korea. Jeon (2017) shows the PPI is a signal to improve the economy in the research of the US purchasing managers’ index (PMI) to Korea. In Figure 1, we find the exports of Korea to the US was affected by Lehman collapse during the recession period from 2008: M9 to 2009:
M12 in the US. The EPU index had increased over the recession period. the export amount of Korea was decreased for the economy deterioration of the US. This phenomenon indirectly shows the EPU of the US and the economy of Korea is inextricably linked.
Note: The dotted box denotes periods for Lehman collapse & recession from 2008:M9 to 2009:M12.
Figure 1: Trend of EPU index (EPUI) of US and Korean Exports to US
Table 1: Statistics Summary
US EPUI NSI CSI FSI TSI ASI MSI ESI SSI S&P 500 PPI
Mean 4.657 6.740 7.248 7.335 5.731 6.789 6.628 8.250 7.666 6.924 4.409
Median 4.625 6.732 6.973 7.165 5.611 6.774 6.790 8.401 7.471 7.057 4.406
Min. 3.802 5.360 5.574 6.117 4.252 5.190 4.979 6.616 6.243 5.727 4.007
Max. 5.648 7.552 8.726 8.690 7.104 8.147 7.834 9.902 8.975 7.888 4.691
S.D. 0.347 0.392 0.898 0.736 0.726 0.752 0.588 0.863 0.832 0.539 0.201
N 336 336 336 336 336 336 336 336 336 336 336
Note: EPUI, NSI, CSI, FSI, TSI, ASI, MSI, ESI, SSI, S&P 500, and PPI indicate separately economic policy uncertainty index, non-metal stock index, chemical stock index, food stock index, textile·clothes stock index, automobile·shipbuilding stock index, machinery stock index, electric·electronics stock index, steel·metal stock index, Standard and Poor’s 500, and producer price index.
We show the summary of descriptive statistics using the natural logs of the sample in Table 1.
3.2. Methodology
Firstly, we estimate the stationary of time series with unit root tests. When the samples have a unit root, the data are not stationary. And we measure whether the data exist a cointegration to confirm the long-term relationship and check the short-run dynamics. Even if the first differenced model has no unit root, we have to analyze the cointegration. In the result of unit root tests and cointegration test, we choose the VECM not VAR as Equation (1) because the first differenced model can cause the loss of long-run information by Engle and Granger (1987).
∆
∆
′
(1)
where is a vector of ( × ) matrix when the endogenous variables are I (1), that is, is US EPU index, NSI, CSI, FSI, TSI, ASI, MSI, ESI, SSI, PPI, S&P 500; is lag order (1, 2, ..., N);
is maximum of lag order;
is period (1, 2, ..., T); is × matrix coefficient; ′ is lagged error correction term, where
is adjustment parameters, and
′ is cointegration vectors;
is vector of deterministic components;
is × vector of disturbances.4. Results
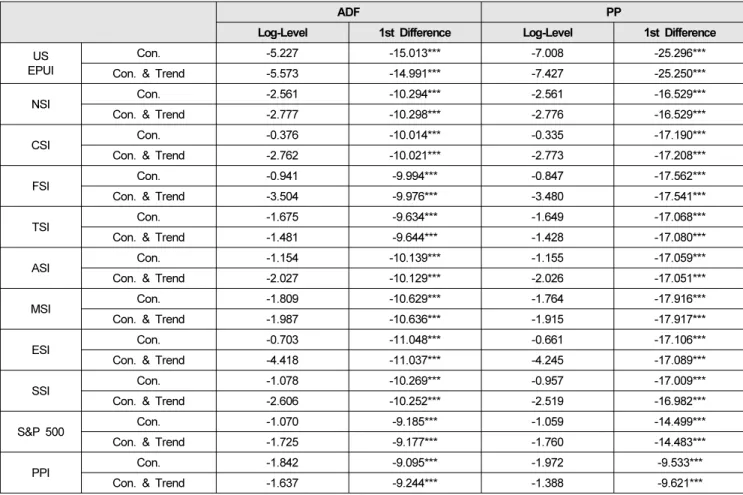
4.1. Unit Root Tests
We estimate where a unit root exists in the natural logarithm of the samples. In Table 2, the first difference data has not a unit root so that the samples have the stationary data.
FSI Con. -0.941 -9.994*** -0.847 -17.562***
Con. & Trend -3.504 -9.976*** -3.480 -17.541***
TSI Con. -1.675 -9.634*** -1.649 -17.068***
Con. & Trend -1.481 -9.644*** -1.428 -17.080***
ASI Con. -1.154 -10.139*** -1.155 -17.059***
Con. & Trend -2.027 -10.129*** -2.026 -17.051***
MSI Con. -1.809 -10.629*** -1.764 -17.916***
Con. & Trend -1.987 -10.636*** -1.915 -17.917***
ESI Con. -0.703 -11.048*** -0.661 -17.106***
Con. & Trend -4.418 -11.037*** -4.245 -17.089***
SSI Con. -1.078 -10.269*** -0.957 -17.009***
Con. & Trend -2.606 -10.252*** -2.519 -16.982***
S&P 500 Con. -1.070 -9.185*** -1.059 -14.499***
Con. & Trend -1.725 -9.177*** -1.760 -14.483***
PPI Con. -1.842 -9.095*** -1.972 -9.533***
Con. & Trend -1.637 -9.244*** -1.388 -9.621***
Note:
1. EPUI, NSI, CSI, FSI, TSI, ASI, MSI, ESI, SSI, S&P 500, and PPI indicate separately economic policy uncertainty index, non-metal stock index, chemical stock index, food stock index, textile·clothes stock index, automobile·shipbuilding stock index, machinery stock index, electric·electronics stock index, steel·metal stock index, Standard and Poor’s 500 index, and producer price index.
2. ***, **, * represent 1%, 5%, 10% levels.
3. Con, Con. & Trend connote constant, and constant and trend separately.
Table 3: Cointegration test results
Null hypothesis Trace 5% Critical Value λmax 5% Critical Value
r=0 344.34 277.71 104.48 68.83
r≤1 239.86 233.13 65.03 62.81
r≤2 174.83* 192.89 49.29 57.12
r≤3 125.53 156.00 35.56 51.42
r≤4 89.96 124.24 26.73 45.28
r≤563.22 94.1522.10 39.37
Note: * represents 5% levels.
4.2. Johansen’s co-integration Test
To check the long-term equilibrium of samples, we examine more than one co-integration relationship by using the cointegration test by Johansen(1991). As a result, we document that the samples have the cointegration in Table 3.
4.3. Granger Causality Tests
In Table 4, Granger causality tests show the results the between the US EPU index and the samples in Korea. The null hypothesis (Ho) of Granger causality indicates the EPU index does not cause the samples, or the samples do not
cause the EPU index.
The US EPU index has a significant cause for the samples except S&P 500 and PPI in Korea. Then, the manufacturing stock indexes in this study are significantly affected by the US EPU index. On the contrary, the manufacturing stock indexes have a significant cause for the US EPU index except TSI. In other words, the US EPU index is significantly affected by the samples except TSI.
Table 4: Granger causality tests
Ho F-Statistic
NSI and US EPUI NSI ⇏ US EPUI 2.670**
US EPUI ⇏ NSI 3.983**
CSI and US EPUI CSI ⇏ US EPUI 4.254**
US EPUI ⇏ CSI 2.556**
FSI and US EPUI FSI ⇏ US EPUI 2.938***
US EPUI ⇏ FSI 3.557**
TSI and US EPUI TSI ⇏ US EPUI 1.555 US EPUI ⇏ TSI 2.298**
ASI and US EPUI ASI ⇏ US EPUI 2.930**
US EPUI ⇏ ASI 3.411***
MSI and US EPUI MSI ⇏ US EPUI 3.033**
US EPUI ⇏ MSI 3.412***
ESI and US EPUI ESI ⇏ US EPUI 4.894***
US EPUI ⇏ ESI 5.317***
SSI and US EPUI SSI ⇏ US EPUI 4.751***
US EPUI ⇏ SSI 2.009*
S&P 500 and US EPUI S&P 500 ⇏ US EPUI 4.508***
US EPUI ⇏ S&P 500 0.670 PPI and US EPUI PPI ⇏ US EPUI 4.355**
US EPUI ⇏ PPI 0.385 Notes:
1. ***, **, * connote 1%, 5%, and 10% levels.
2. ⇏ represents “does not Granger Cause”.
3. EPUI, NSI, CSI, FSI, TSI, ASI, MSI, ESI, SSI, S&P 500, and PPI indicate separately economic policy uncertainty index, non-metal stock index, chemical stock index, food stock index, textile·clothes stock index, automobile·
shipbuilding stock index, machinery stock index, electric·electronics stock index, steel·metal stock index, Standard and Poor’s 500 index, and producer price index.
4.4. VECM Results
We select the optimal lag order before analyzing the VECM. In Table 5, Lag 2 by AIC is decided as the optimal lag length.
Table 5: Lag Selection
lag AIC HQIC SBIC
0 -1.837 -1.787 -1.711
1 -33.583 -32.980 -32.070
2 -33.773* -32.617 -30.874
3 -33.633 -31.924 -29.347
4 -33.424 -31.161 -27.750
Note: * means the selected lag order.
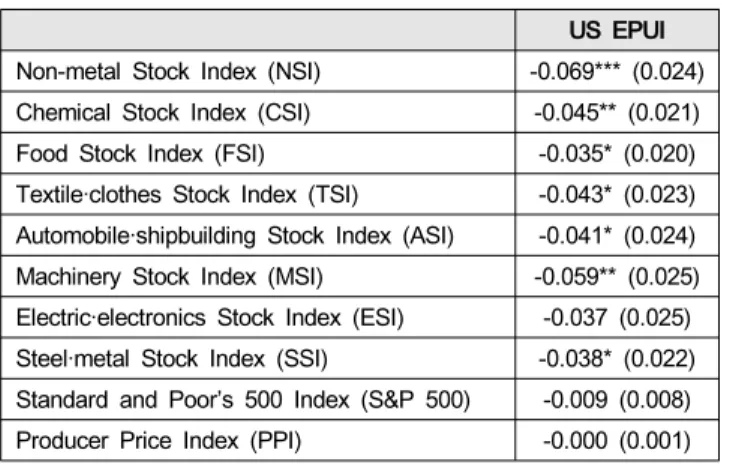
We find the samples in this study is affected by the US EPU index in Table 6. In detail, the manufacturing stock indexes except ESI in Korea has negatively a significant relationship with the US EPU index. Meanwhile, the S&P 500 and PPI is not significantly affected by the US EPU index. And all samples have a negative relationship with the US EPU index.
Table 6: VECM results
US EPUI
Non-metal Stock Index (NSI) -0.069*** (0.024) Chemical Stock Index (CSI) -0.045** (0.021) Food Stock Index (FSI) -0.035* (0.020) Textile·clothes Stock Index (TSI) -0.043* (0.023) Automobile·shipbuilding Stock Index (ASI) -0.041* (0.024) Machinery Stock Index (MSI) -0.059** (0.025) Electric·electronics Stock Index (ESI) -0.037 (0.025) Steel·metal Stock Index (SSI) -0.038* (0.022) Standard and Poor’s 500 Index (S&P 500) -0.009 (0.008) Producer Price Index (PPI) -0.000 (0.001) Notes:
1. ***, **, * connote 1%, 5%, and 10% levels.
2. ( ) represents standard errors.
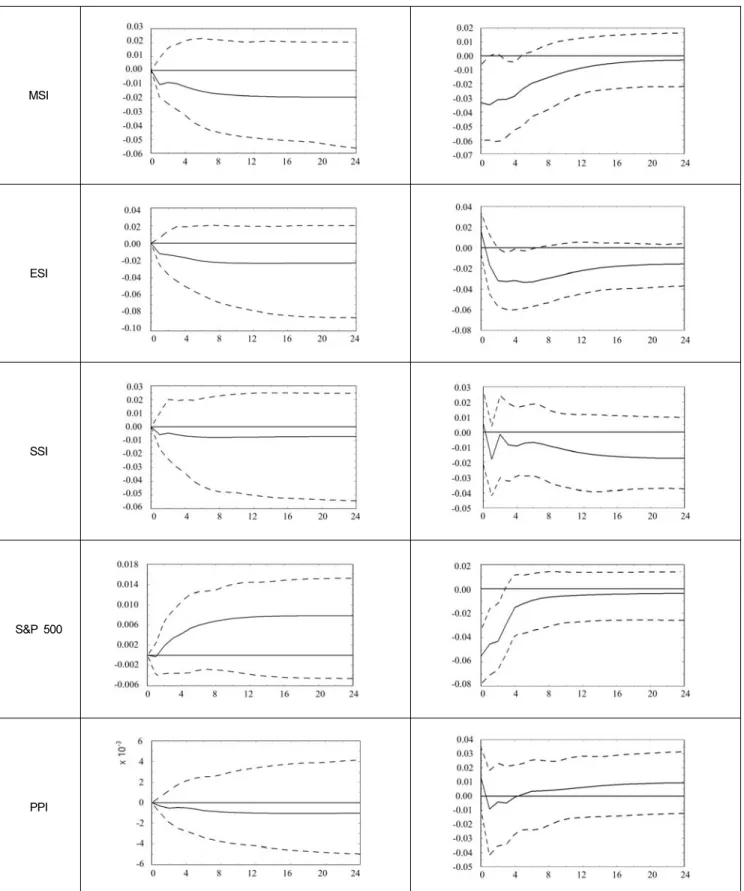
4.5. Impulse Response Function
Using the VECM, we estimate the impulse response function (IRF) between EPU indexes in the US and the samples of Korea. In Figure 2, all responses of the samples in Korea as well as S&P 500 have initially moving toward a negative direction to the shock of the US EPU index. This result of the negative responses at the beginning by impulse response function is the same as it of the VECM.
In particular, NSI, TSI, ASI, MSI, ESI, SSI, PPI tend to remain in the negative area due to the spillover effect of an impact of the US EPU. In addition, responses of CSI and FSI are intersecting in 3 months and going toward the zero point.
Otherwise, the response of the US EPU index has been initially declining toward the negative direction to the shock of ASI, MSI, ESI, SSI, and PPI. On the other hand, the US EPU index has been rising toward the positive direction to the shock of NSI, CSI, FSI, TSI, and S&P 500 at the beginning.
Moreover, FSI, ASI, MSI, and S&P 500 tend to stay on the negative area due to the spillover effect of an impact of the US EPU. Additionally, responses of NSI, CSI, TSI, ESI, SSI, and PPI are crossing in turn the negative and positive ways, and going toward the zero point.
CSI
FSI
TSI
ASI
MSI
ESI
SSI
S&P 500
PPI
Figure 2: Impulse response between EPU Index of the US and variables in Korea
samples except S&P 500 and PPI in Korea is affected by the US EPU index. It shows the manufacturing stock indexes are closely related with the US EPU index.
Whereas the manufacturing stock indexes except TSI have a significant cause for the US EPU index. Therefore, the US EPU index is significantly affected from all samples except TSI.
6. Conclusions 6.1. Summary
In the empirical results of the VECM, we find the relationship between the US EPU index and the manufacturing stock indexes has a negative correlation.
Shortly, if the US EPU index will move up, the manufacturing stock indexes will worsen, and then the PPI will decrease.
This paper has three contributions referring on EPU. First, we estimate the dynamic relationship between the US EPU and the manufacturing stock market in Korea using the US EPU index designed by Baker et al. (2016). Then, we find out that the relationship between the US EPU index and the manufacturing stock index in Korea has the negative relationships. We determine the EPU of the US has the spillover effect on the industry stock markets in Korea by the VECM. Second, we use the stock indexes of the manufacturing in the major industry categories of Korean exports for the US to verify the casual link between the Korean stock market and the US EPU index. And we select the PPI as one of the indexes related to both the manufacturing and production. Finally, unlike the previous literatures, this study indirectly leads to an evidence for the Korean industry market closely connected with the US EPU.
In sum, we suggest that this study can provide the important information to make a decision for the production scale in manufacturing and to predict the export market to the US following the US EPU index.
6.2. Limitations and Future studies
We propose the stock market of manufacturing in Korea
financial crisis.
References
Abel, A. (1983). Optimal Investment under Uncertainty.
American Economic Review, 73(1), 228–233.
Antonakakis, N., Gupta, R., & Andre, C. (2015). Dynamic co-movements between economic policy uncertainty and housing market returns. Journal of Real Estate Portfolio Management, 21(1), 53-60.
Bachmann, R., Elstner, S., & Sims, E. R. (2013).
Uncertainty and Economic Activity: Evidence from Business Survey Data. American Economic Journal:
Macroeconomics, 5(2), 217-249.
Baker, S. R., Bloom, N., & Davis, S. J. (2016).
Measuring Economic Policy Uncertainty. Quarterly Journal of Economics, 131(4), 1593-1636.
Beltratti, A., & Morana, C. (2010). International house prices and macroeconomic fluctuations. Journal of Banking & Finance, 34(3), 533-545.
Bloom, N. (2009). The impact of uncertainty shocks.
Econometrica, 77(3), 623-685.
Bloom, N. (2014). Fluctuations in uncertainty. Journal of Economic Perspectives, 28(2), 153-176.
Born, B., & Pfeifer, J. (2014). Policy risk and the business cycle. Journal of Monetary Economics, 68(1), 68-85.
Choi, S., & Loungani, P. (2015). Uncertainty and unemployment: The effects of aggregate and sectoral channels. Journal of Macroeconomics, 46(1), 344-358.
Engle, R. F., & Granger, C. W. J. (1987). Co-integration and error correction: Representation, estimation, and testing. Econometrica, 55(2), 251-276.
Fernandez-Villaverde, J., Pablo, G., Keith, K., & Juan, R.
(2015). Fiscal volatility shocks and economic activity.
American Economic Review, 105(11), 3352–3384.
Foster, L., Haltiwanger, J., & Krizan, C. J. (2006). Market Selection, Reallocation, and Restructuring in the U.S.
Retail Trade Sector in the 1990s. Review of Economics and Statistics, 88(4), 748-758.
Gourio, F., Siemer, M., & Verdelhan, A. (2013).
International Risk Cycles. Journal of International
Economics, 89(1), 471-484.
He, Y. (2018). A study on the impact of China’s monetary policy on South Korea’s exchange rate.
International Journal of Industrial Distribution &
Business, 9(6), 17-24.
Jeon, J. (2017). US Purchasing Managers’ Index and its impact on Korea and US. Journal of Distribution science, 15(3), 17-25.
Jeon, J. (2018). The impact of Asian economic policy uncertainty: Evidence from Korean housing market.
Journal of Asian Finance, Economics and Business, 5(2), 43-51.
Johansen, S. (1991). Estimation and hypothesis testing of cointegration vectors in Gaussian vector autoregressive models. Econometrica, 59(6), 1551-1580.
Jurado, K., Ludvigson, S. C., & Ng, S. (2015). Measuring uncertainty. American Economic Review, 105(3), 1177- 1216.
Kang, W., & Ratti R. A. (2013), Structural oil price shocks and policy uncertainty. Economic Modelling, 35(1), 314-319.
Leduc, S., & Liu, Z. (2016). Uncertainty shocks are aggregate demand shocks. Journal of Monetary Economics, 82(1), 20-35
Lee, K. (2010). The Impact of International Financial Shocks on the Volatility of Domestic Financial Markets.
Journal of Money & Finance, 24(4), 49-85.
Meinen, P., & Roehe, O. (2017). On measuring uncertainty and its impact on investment: Cross-country evidence from the Euro area. European Economic Review, 92(1), 161-179.
Morikawa, M. (2016). Business uncertainty and investment: Evidence from Japanese companies.
Journal of Macroeconomics, 49, 224-236.
Pantzalis, C., Stangeland. D. A., & Turtle, H. J. (2000).
Political elections and the resolution of uncertainty: The international evidence. Journal of Banking and Finance, 24(10), 1575-1604.
Warshaw, E. (2016). Parallel currency markets and the monetary exchange rate model: A VECM application to turney over 1987-1998. Eastern European Economics, 54, 473-488.