• 검색 결과가 없습니다.

Water Level Tracking System based on Morphology and Template Matching

N/A
N/A
Protected

Academic year: 2021

Share "Water Level Tracking System based on Morphology and Template Matching"

Copied!
8
0
0

로드 중.... (전체 텍스트 보기)

전체 글

(1)

1. INTRODUCTION

Detecting water level of a river is an essential factor in raising the awareness of any upcoming natural disaster. That is why many researchers are trying to find different possible ways to save and control the water resources. Water resource man- agement is a organizing concept for different water sectors. Basically, water level detection is achieved by three basic ways, firstly measuring the position of buoy in the pipe, Buoys is normally used for field studies and they are well suited to measure the depth of water because they do not need a platform, or a pier fixed to the bottom as was the case of pressure sensors. Floating buoys may follow, up

to some extent, sea surface movements. Estimat- ing the float removals permit wave attributes to be known. Usually, two kinds of buoys are referred to use according to their operating principle and size [1]. Portions of the float writes are known as pitch, roll and hurl floats or wave incline floats. The second method is based on the ultrasonic sensor, and this method generally measures the reflectance of the time between sensor and water body [2]. The third method is by using images of the water resources. Herein we propose an image-based wa- ter level detection using a camera to tracks the scale continuously. Furthermore, this system can also help in the field of agriculture and fishing in- dustries where water level plays an important role.

Water Level Tracking System based on Morphology and Template Matching

Israfil Ansari

, Yunju Jeong

††

, Yeunghak Lee

†††

, Jaechang Shim

††††

ABSTRACT

In this paper, we proposed a river water level detection and tracking of the river or dams based on image processing system. In past, most of the water level detection system used various water sensors.

Those water sensors works perfectly but have many drawbacks such as high cost and harsh weather.

Water level monitoring system helps in forecasting early river disasters and maintenance of the water body area. However, the early river disaster warning system introduces many conflicting requirements.

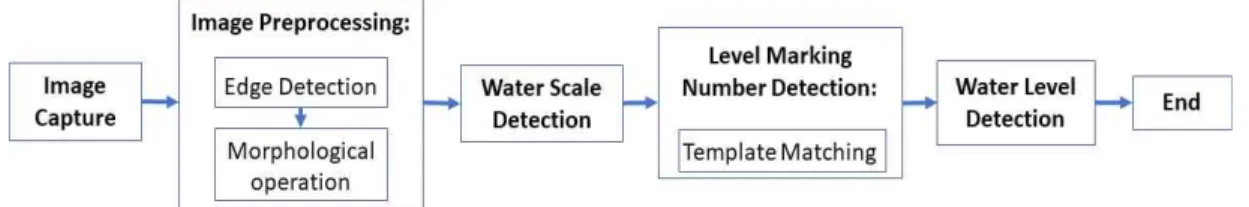
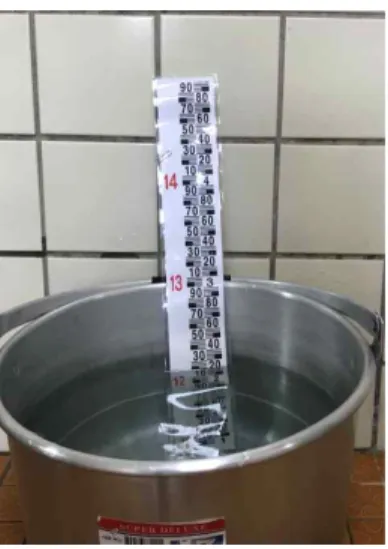
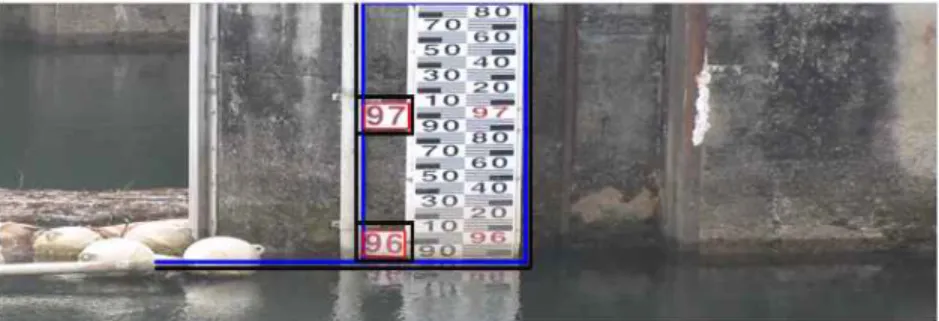
Surveillance camera based water level detection system depends on either the area of interest from the water body or on optical flow algorithm. This proposed system is focused on water scaling area of a river or dam to detect water level. After the detection of scale area from water body, the proposed algorithm will immediately focus on the digits available on that area. Using the numbers on the scale, water level of the river is predicted. This proposed system is successfully tested on different water bodies to detect the water level area and predicted the water level.

Key words: Water Scale Detection, Template Matching, Surveillance Camera

※ Corresponding Author : Jaechang Shim, Address:

(36729) 1375 Gyeongdong-ro, Andongsi, Gyenongsangbuk- do, Korea, TEL : +82-54-820-5645, FAX : +82-54-820- 6164, E-mail : [email protected]

Receipt date : Aug. 1, 2018, Revision date : Nov. 22, 2018 Approval date : Nov. 26, 2018

Department of Computer Eng., Andong National Uni- versity

(E-mail : [email protected])

††††

School of Computer Science and Eng., Kyungpook National University

(E-mail : [email protected])

††††

Department of Computer Eng., Andong National University (E-mail : [email protected])

††††

Department of Computer Eng., Andong National University

※ This research was supported by the research fund of

Andong National University in 2017.

(2)

Traditional water level monitoring sensors [3-5]

have been successful in detecting disasters but along some major advantages it faces many prob- lems while installation and in the maintenance of the sensors. Normally sensor installation and maintenance require lots of time and cost is very high. Sensors sometime fail to predict or destroyed due to flash flood or in complex water flow situations. The most popular and traditional way to detect water level is using pressure [6] and su- personic waves [7]. Pressure sensor checks the water pressure and predicts the level of water.

Although it is easy to use, it has limitation that it should be frequently checked due to damage by continuous water pressure. Supersonic sensors have less chances of damage as pressure sensor because it measures the time flow of supersonic waves pulse from emitter to receiver from the wa- ter surface. However supersonic wave sensors have problems in sending values during rapid fluc- tuation in water and temperature.

This study is focused on simple water level de- tection using camera. This system continuously monitors the water level scale and predicts the level. It has low installation cost as compared to other traditional methods. For detecting water level area, it uses different image preprocessing algo- rithm. It also uses pattern matching to detect water scale numbers.

2. PROPOSED SYSTEM

In this system video frames are received from surveillance camera which can be used to detect the water level area. The water level area is than

preprocessed to identify the water level digits.

Using these digits, the system will predict the level of water.

The system mainly contains five modules as shown in Fig. 1. Constantly all the video frames are capture and processed for water level scale detection.

2.1 Image capture

Sequences of image i.e. video frames are taken from the camera installed facing towards water level scale. Opencv3.1 is used to capture video frame.

2.2 Image preprocessing

Image processing is a method to perform some operations on an image, in order to get an enhanced image or to extract some useful information from it. Initially whole frame is taken to process on which the water level scale is located. Image proc- essing in this proposed system is divided into 3 steps. Initially edge detection is performed to detect the most edged area. Secondly morphology oper- ation is performed to group the edged area. Finally, filtration of edge is done using rectangular and square kernel function.

2.2.1 Edge detection

In this proposed system for edge detection algorithm. Canny Edge Detection [8] is a popular edge detection algorithm. It was developed by John F. Canny in 1986. This algorithm is a multi-stage algorithm which is divided into four parts. Initially, noise reduction is done on the frame using Gaus-

Fig. 1. Block diagram of proposed system.

(3)

sian filter. Secondly, the smoothened image is fil- tered with Sobel kernel on both horizontal and ver- tical to get derivative in both directions from which edge gradient is detected. Thirdly, after getting gradient magnitude and direction, a full scan of the image is done to remove any unwanted pixels which may not constitute the edge. In the fourth step, this algorithm decides the real edges. Edges with intensity gradient more than threshold max value is assumed to be edges and those have threshold min value are predicted to be non-edge is discarded.

2.2.2 Morphology operation

Morphology is an image processing operation that process images based on its shape. This oper- ation applies a structuring element to the input im- age and then it creates an output image of the same size. In morphological operation, the value of each pixel in the output image is based on the corre- sponding pixel from the input image along with its neighbor’s pixels. Morphological operators can also be applied to gray level images, e.g., to reduce noise or to brighten the image. The most basic morpho- logical operations are erosion and dilation. Dilation adds pixels to the boundaries of objects in an image. The number of pixels added from the ob- jects in an image depends on the size and shape of the structuring element used to process the image. The main rule of dilation is the value of the output pixel is the maximum value of all the pixels in the input pixel's neighborhood. In a binary im- age, if any of the pixels are set to the value 1, the output pixel is set to 1. The 3 × 3 square is probably the most common structuring element used in dila- tion operations.

Erosion removes pixels from the object boun- dary. Erosion operation sister of dilation its com- pute a local minimum over the area of the kernel.

The main rule of erosion is the value of the output pixel is the minimum value of all the pixels in the input pixel's neighborhood. In a binary image, if

any of the pixels is set to 0, the output pixel is set to 0. While performing erosion pixels beyond the image border are assigned the maximum value afforded by the data type. In the case of binary im- ages, these pixels are assumed to be set to 1. For gray scale images, the maximum value for uint8 images is 255. Erosion algorithm is similar to many other kinds of image filters like the Median filter and the Gaussian filter. Using erode the areas of dark regions grow in size and bright regions decreases. For example, the size of an object in dark shade or black shade increases, but on the other hand decreases in a white shade or bright shade.

2.2.3 Filtration of edge:

The filtration of the erode and dilate frame is done in two ways. Initially, the square and rec- tangle kernel is used to differentiate the water scale area from with other objects in the frame. If an image can be considered as a big matrix then we can consider the kernel as a tiny matrix. Using the kernel method, we can take either x-coordinates or y-coordinates of the original image and examine the neighborhood of image pixels located at the center of the image kernel. We can take this neigh- borhood of pixels, convolve them with the kernel, and we get a single output value. This output value is then stored in the output image at the same x- coordinates or y-coordinates as the center of the kernel. After kernel filtration contour detection is used for second level checking to detect the correct water level area. Contour is a curve that joins all the consecutive points which have same color or intensity. It stores the x and y coordinates of the boundary of a shape. Contour is a very useful algo- rithm for shape analysis and many more like object detection and recognition.

2.3 Level marking or number detection

Level marking detection in this proposed system

is dependent according to water level pattern. Level

(4)

marking is used to identify the quantity of water in the river and dam.

2.4 Marking water level

Water level area is detected and marked on the frame. This part is assumed as water level on the water scale area and compared with the water edge area. Water level is further check on the bottom area of detected water scale using edge detection.

If the water edge is successfully detected, then the water level mark is drawn on the frame.

2.5 Water level detection

After the water level area detection, scaling is performed to check the current water level accord- ing to the predefined scale of the water body.

3. EXPERIMENT RESULT

The developed algorithm has been tested in a video recorded from andong dam. The evaluated approach is divided into 3 main parts: (i) edge de- tection; (ii) morphological operation and (iii) tem- plate matching. After all this approach a virtual scale is drawn according to scale pattern. We built a simulation environment as shown in Fig. 2.

3.1 Result of edge detection

For edge detection canny edge detection algo- rithm is used with threshold values 50 to 150. Fig.

3(b) is the result after edge detection.

3.2 Result of erode and dilation

Initially erosion operation is used to remove the small pixels from the water scale boundary. Then dilation adds pixels to the boundaries in the water scale to make it an one single object.

As shown in the Fig. 4 the input image is pass Fig. 2. Simulation environment for Image processing.

(a) (b)

Fig. 3. Image processing on video frame. (a) Frame re- ceived from surveillance camera. (b) Edge de- tection or received frame.

(a) (b) (c)

Fig. 4. Dilation operation of input frame. (a) Frame received from surveillance camera. (b) The result after erosion

operation on received frame. (c) The result of dilation operation.

(5)

through erosion operation (b) to remove the un- wanted pixels and then dilation (c) to connect the remaining pixels.

3.3 Result of water level area detection After all the above image processing steps, as shown in Fig. 5 water level area is successfully detected of different place.

3.4 Result after number detection

In the following case template matching algo- rithm is used to detect the largest number from the water scale [9]. Template matching is a techni- que in digital image processing to find some partic- ular part from an image which matches the tem- plate image i.e. a reference image. The template image is also known as a patch image. It always checks for strong features in the image on which algorithm applied. Templates are most often used to identify printed characters, numbers, and other small, simple objects. The matching process moves the template image to all possible positions in source image and computes a numerical index that indicates how well the template matches the image in that position. Here, it loads input frame and patch image then performs a template matching

procedure us OpenCV function. After that, it local- izes the location with a higher matching area as shown in Fig. 6 which is marked in red.

3.5 Result after water level detection

Water level is always assumed to be on the bot- tom area of a water scale. Here we have checked edge area on the bottom of the water scale and as- sumed to be water level on the scale. As shown in the Fig. 7 water level is correctly marked on the scale.

3.6 Final water level detection

As shown in the Fig. 8 the proposed system wa- ter scale is defined in the following way, as shown in Fig. 8, ‘96’ and ‘97’ is water level. This value is then further divided into 10 parts i.e. 96.10, 96.20,

(a) (b) (c)

Fig. 5. Water level area detection, (a) water level area of andong dam, (b) water level area on nakdong river, (c) random area water scale.

Fig. 6. Template matching and localization.

(6)

96.30 to 96.90, after that it then defined as ‘97’.

According to the scale pattern, a virtual scale pre- pared which match the pattern of the scale of a water body. The virtual scale is started from mid- point of the top water level i.e. ‘97’ and goes to the water scale line and check the current water level area. It checks the level on every frame which it receives from the video frame. Scale is also com- pared with all the detected scale i.e initially the lowest detect scale number or the nearest scale number compared with the water scale line, as for example in Fig. 8 the water scale is first compared with ‘96’ and then it is compared with 97 to make final decision of current water level of the water body. This system checks every possible before displaying the final result. The scale pattern of wa- ter level area is studied before making the virtual scale.

Initially this system was tested on a video cap- tured from Andong Dam. As show in the figure

8, the proposed algorithm is working perfectly on the captured 10 minute video.

Furthermore, we have tested this algorithm to detect water level of large water tank installed in western power plant located in taean. For realtime testing we used RTSP (OnVIF) port of CCTV in- stalled near water body of the plant. Fig. 9 shows the output of water level detected on the scale in- Fig. 7. Marked water level area on water scale.

(a) (b)

Fig. 8. Water level detection. (a) Virtual scale drawn according to water scale format. (b) The scale check with the water level line and display the current level.

Fig. 9. Water level detection of western power plant

taean.

(7)

stalled in Taean. In this images, water scale pattern is different but using the same template matching algorithm, the numbers are detected and then fur- ther water level is identified.

4. DISCUSSION

Using image processing the water scale areas can successfully monitored, but the primary chal- lenge is to detect the leveling digits from the par- ticular scale. Scale pattern differs from place to place, so it is difficult to concentrate on a universal pattern. In this system, a particular scale focused on for further detection of the water level. In this scale there are two types of digits, one is main dig- it, and others are sub-divided digits of main digits.

Sub-divided digits are smaller as compared to main digit, so we focused on the larger i.e. main digit. After successful detection of larger digits, a virtual scale is made between the larger digits ac- cording to the same sub-divided pattern. This scale checks continuously with water level and displays the current water level.

5. CONCLUSION

In this paper, a camera based water level de- tection is proposed. This system shows excellent results when tested with different water bodies.

Therefore it is found that our proposed system can overcome various drawbacks of traditional sys- tems (water flow sensors) such as high cost, de- mage due to harsh weather, maintenance diffi- culties etc. Most importantly this system will be cost effective than sensor based system. Proposed system is combination of various image process- ing algorithm to get the water level area then used pattern matching for deciding the current water level. In Fig. 5 it is shown that the proposed system successfully detects water level area of different location. Water level tracking can be implemented on all of those areas with small changes according to their respective features. Scale pattern is essen-

tial to detect the water level in real time, so pro- posed algorithm focused on the particular pattern of the water body.

In future we want to focus on different climate situation where water level area visibility is an challenging task.

REFERENCES

[ 1 ] D. Hauser, K. Kahma, H.E. Krogstad, S.

Lehner, J.A.J. Monbaliu, and L.R. Wyatt, Measuring and Analysing the Directional Spectrum of Ocean Waves, European Cooper- ation in the Field of Scientific and Technical Research, 2005.

[ 2 ] B.Y. Lee and B.Y. Park, “The Development Sensor to Measure Underground Water Level Using a Buoy,” The Korean Society of Agri- culture and Forest Meteorology, Vol. 1, No.

1, pp. 1-5, 1999.

[ 3 ] K. Eunmi, S.H. Hwang, and C.S. Kim, “A Study on the Development of the Flood Risk Index for Roads Considering Real-Time Rainfall,” Journal of Korea Multimedia Society, Vol. 16, No. 5, pp. 610-618, 2013.

[ 4 ] E.A. Basha, S. Ravela, and D. Rus, “Model- Based Monitoring for Early Warning Flood Detection,” Proceedings of the 6th ACM Conference on Embedded Network Sensor Systems, pp. 295-308, 2008.

[ 5 ] B.N. Getu and H.A. Attia, “Automatic Water Level Sensor and Controller System,” Pro- ceeding of 5th International Conference on Electronic Devices, Systems and Applica- tions, pp. 1-4, 2016.

[ 6 ] J.H. Um, “Inquiry of Special Quality of Super- sonic Sensor for Water Level by Non- Contact,” The Bulletin of Korea Environment Engineers Association, Vol. 162, pp. 30-36, 2000.

[ 7 ] Y.C. Chang, H.C. Hsu, J.J. Lee, C.C. Chueh,

C.M. Chang, and L. Chen, “License Plate

(8)

Character Recognition Using Block-Binary Pixel Sum Features,” Proceeding of Interna- tional Conference on Computer, Networks and Communication Engineering. pp. 111- 113, 2013.

[ 8 ] J. Canny, “A Computational Approach to Edge Detection,” IEEE Transactions On Pattern Analysis And Machine Intelligence, Vol. 8, No. 6, pp. 679-698, 1986.

[ 9 ] A. Hajdu and I. Pitas, “Optimal Approach for Fast Object-Template Matching,” IEEE Tran- sactions on Image Processing, Vol. 16, No. 8, pp. 2048-2057, 2007.

Md Israfil Ansari

received the BCA degree in Com- puter Application from Punjab Technical University, Jalandhar, India in 2011 and the MCA de- gree in Computer Application from Visvesvaraya Technologi- cal University, Bangalore, India in 2015. His previous position was a Software Devel- oper as an Intern at Xcelvations Consultancy Pvt Ltd, Hyderabad, India. Currently studies for Ph.D. at De- partment of Computer Engineering, Andong National University, Korea. He has interests in the areas of computer vision, pattern recognition, Deep Learning.

Yeunghak Lee

received his Ph.D degree from Yeungnam University, Korea, in 2003. He had one year experi- ence at University of Cardiff as postdoc research fellow. He was a professor of department of avionic electronic engineering at Kyungwoon University. He is currently working as a senior researcher in the Department of Computer Science at Andong National University. He contributes as a management editor for the Journal of Multimedia and Information Systems. His research interests in- clude pattern recognition, embedded system and com- puter vision.

Yunju Jeong

received BS in Computational Statistics from Andong National University in 1991 and Master of Computer Engineering from Department of Computer Engin- eering, Andong National Uni- versity in 2000. Currently, she is a doctoral candidate at Department of Computer Engineering of Kyungpook National University and also an Education Instructor at Dept. of Computer Eng., Dept. of Electronic Eng., Andong National University, Korea. Her research interests include computer vision, Deep Learning, and VR.

Jaechang Shim

Shim received Ph.D. degree in

1993 from Kyungpook National

University, in Korea. From 1997

to 1999, he worked as a re-

searcher in IBM T. J. Watson

Research Center in USA. From

2005 to 2006, he was a visiting

Fellow Professor at Princeton University. Since 1994,

he has been a Professor of the Andong National

University, Korea. He received the best Industrial-

Related Paper Award form IAPR in 1998. His research

interests include computer vision, image processing,

pattern recognition, and AI.

수치

Fig. 1. Block diagram of proposed system.
Fig. 3. Image processing on video frame. (a) Frame re- re-ceived from surveillance camera
Fig. 5. Water level area detection, (a) water level area of andong dam, (b) water level area on nakdong river, (c)  random area water scale
Fig. 8. Water level detection. (a) Virtual scale drawn according to water scale format

참조

관련 문서

Protecting the aquatic ecosystem in the water body Recover water and resources from wastewater and. produce renewable energy using wastewater constituents.. • So, the goal

In Jangsu stream, blue-green algae were temporarily increased by 59% due to the eutrophication and reduction of water level in July, but no toxins

In nuclear power plants, the water level is maintained by controlling the water supply when the steam generator's water level deviation occurs. During

Wide continental shelf → large storm surge (e.g. southwest coast of Korea) Storm surge + high tide → severe flooding in coastal areas.. 5.10 Simplified Analysis

This Study was conducted on privatizing the Water Supply Industry in Korea. Water supply service has been operated by local autonomous and public entities. But in

The author, therefore, propose a fuzzy-PID controller which combines PID control and fuzzy technique to obtain the good performance of water level control

In this study, water flow system of Danghang Bay, which has the narrow and long topographical characteristics with the narrow bay mouth and its flow

This study recognized that wide area vessel traffic management system is necessary at the traffic congested area and/or environmentally sensitive water through