753
서 론우리나라주요어류양식어종인조피볼락
(Sebastes schlegeli)
은2010
년 생산량이20,918
톤(
국내 어류양식 총 생산량의20%)
으로국내어류양식에서두번째로생산량이많은어종이다
(FAO, 2012).
다른어종과마찬가지로조피볼락의생산성및양식경영비에서가장중요하게영향을미치는것은사료이 며
,
총양식경영비의50-60%
에이른다(Cho et al., 2006).
현재 까지조피볼락양식의효율적인관리와생산성향상을위해서 많은연구들이수행되었다.
배합사료개발을위해영양소요구량과사료원료이용성에관한연구들이수행되었고
(Lee et al.,
1993; Kim and Bae, 1999),
배합사료에의한생사료대체가능 성과같은(Lee and Jeon, 1996),
환경친화적인고효율배합사 료개발을위하여많은연구들이수행되고있다.
하지만조피볼 락을비롯한양식어류의성장은사료이외에망갈이,
선별,
수 온등의외부환경요인에의해서많은영향을받는다(Choi et al., 2009).
따라서,
양식어종에대한적합한사료가개발되더라 도외부환경에따른사료공급방법이제대로이루어지지않으 면성장및사료효율이달라지고,
수질오염발생등많은부작용 이일어날수있기때문에(Kim et al., 2005),
효율적인사료공급Article history;
Received 11 June 2013; Revised 5 November 2013; Accepted 6 November 2013
*Corresponding author: Tel: +82. 51. 629. 5916 Fax: +82. 51. 628. 6873 E-mail address: [email protected]
Kor J Fish Aquat Sci 46(6) 753-760, December 2013 http://dx.doi.org/10.5657/KFAS.2013.0753 pISSN:0374-8111, eISSN:2287-8815
ⓒ The Korean Society of Fishereis and Aquatic Science. All rights reserved
조피볼락(Sebastes schlegeli) 치어의 배합사료 적정 공급률과 공급횟수
이진혁·김강웅·이봉주·박건현
1·이준호
1·윤현호
1·배승철
1*국립수산과학원 사료연구센터,
1부경대학교 해양바이오신소재학과/사료영양연구소
Optimum Feeding Rate and Frequency in Juvenile Korean Rockfish Sebastes schlegeli Fed a Commercial Diet
Jin-Hyeok Lee, Kang-Woong Kim, Bong-Joo Lee, Gun-Hyun Park1, Jun-Ho Lee, Hyeon-Ho Yun1 and Sungchul C. Bai1*
Aquafeed Research Center, National Fisheries Research & Development Institute, Pohang 791-923, Korea
1Department of Marine Bio-Materials and Aquaculture / FFNRC, Pukyong National University, Busan 608-737, Korea
Two feeding trials were conducted to investigate the effects of feeding rate and frequency on growth performance and body com- position of juvenile Korean rockfish Sebastes schlegeli reared at 15.0±0.3°C. In the first trial, three replicate fish groups averaging 2.07±0.03 g were fed a commercial diet with one of seven different daily feeding rates: 1.00%, 2.00%, 2.50%, 2.75%, 3.00%, 3.25%, and satiation (3.34%) based on body weight (BW). After four weeks of feeding, fish fed the 3% diet showed significantly higher weight gain (WG) and feed efficiency (FE) than fish that received the other feeding rates. In the second trial, the optimum feeding frequency was evaluated with three replicate fish groups averaging 2.04±0.03 g. Fish were fed a commercial diet at 2.87%
BW with six different daily feeding frequencies: 2, 3, 4, 5, 7, or 9 meals. After four weeks of feeding, WG, specific growth rate, FE, and protein efficiency rate in fish fed 3 meals d
-1were significantly higher than those of fish fed 7 or 9 meals d
-1. In both feeding tri- als, proximate composition of the entire body changed depending on the feeding rate or frequency. A broken-line regression analysis based on weight gain suggested that the optimum daily feeding rate and frequency for juvenile Korean rockfish at 15°C was 2.9%
BW d
-1and 2–3 meals d
-1, respectively.
Key words: Korean rockfish, Feeding rate, Feeding frequency, Growth performance, Commercial diet
이진혁
ㆍ
김강웅ㆍ
이봉주ㆍ
박건현ㆍ
이준호ㆍ
윤현호ㆍ
배승철754
방법의확립은사료효율및어류성장에영향을미쳐양식어류 를보다효율적으로생산할수있을것이다
(Tsevis et al., 1992;
Azzaydi et al., 2000).
배합사료의적정공급률과공급횟수는대상어종마다다르며
,
어류의성장단계와사육환경에영향을받는다(Ng et al., 2000;
Mihelakakis et al., 2002).
하지만사육환경조건에따라어류 의사료섭취량에직접적으로영향을미칠수있기때문에(Brett and Higgs, 1970),
대상어종에대한배합사료공급체계가확립 되지않을경우배합사료가부족또는과잉으로공급되기쉽다(Lee et al., 2000a).
배합사료가과잉으로공급될경우사료유실 로인한경제적손실과수질오염이발생할수있으며,
사료가 부족하게공급될경우어체내필요한영양소요구량을만족시 키지못하게되어어류성장을저해할수있다.
따라서양식경영 비의높은비중을차지하는배합사료의공급체계확립은어류 의양식경영을효율적으로관리할수있게할것이며,
어류의성 장및사료효율증가로경제적인이익뿐만아니라사료과잉공 급시발생하는사료유실을최소화하여양식배출수로인한환 경오염을저감시킬수있을것이다.
조피볼락양식은대부분해상가두리에서이루어지며연근해 지역의수온변화에영향을받는다
.
현재까지조피볼락에대한 배합사료공급체계가확립되어있지않으며,
양식생산성극대 화와환경친화적인측면에서수온변화에따른적정사료공급 량및공급횟수에대한가이드라인이필요하다.
따라서,
본연 구는조피볼락치어에서배합사료의적정공급률과공급횟수가15℃
수온에서어체성장및체조성에미치는영향조사하기위해서수행되었으며
,
조피볼락배합사료공급방법에대한기초 가이드라인확립을위해서수행되었다.
재료 및 방법
실험어 및 사육관리
실험어는전북고창에서운반된조피볼락치어를부경대학교 영양대사학실험실내
400 L
수조에서실험환경에적응할수있 도록2
주간예비사육하였다.
예비사육후,
본실험에서는배 합사료적정공급률과공급횟수에대한2
개의사료공급실험을 수행하였다.
적정공급률실험(
실험1)
은평균무게2.09±0.03 g
인치어를36 L
사각수조에각실험구당20
마리씩3
반복으 로무작위배치하였다.
적정공급횟수(
실험2)
실험은평균무게2.04±0.03 g
인치어를36 L
사각수조에각실험구당20
마리씩3
반복으로무작위배치하였다.
실험1
과2
의사료공급실험환경 은동일하였으며,
각실험수조는반순환여과시스템에서유수량은
2 L/min
로조절하였다.
충분한산소공급을위해에어스톤을설치하였으며
,
전실험기간동안평균수온은15.0±0.4℃,
염분은33±1 psu,
용존산소는7.8±0.5 mL/L, pH
는7.4±0.5
으로유지하였다.
각실험1
과2
의사육실험은총4
주간진행하 였다.
실험사료 및 설계
실험
1
에사용된실험사료는조피볼락치어의상업용배합사 료(
수협,
침강2
호S)
이고일반성분조성은수분8.89%,
조단백 질47.21%,
조지방9.22%,
조회분14.45%
로나왔으며,
총에 너지4526,
사료크기2.4-2.6 mm
인사료를사용하였다.
일일 사료공급량은어체무게당1.00%, 2.25%, 2.5%, 2.75%, 3%, 3.25%
및만복공급(SA)
으로총7
개실험구를두었고, 1
일3
회(08:00, 14:00, 20:00h)
에나누어공급하였다.
실험2
에사용된 실험사료는실험1
과동일한사료로수행되었다.
사료공급량은실험
1
의적정공급률결과를바탕으로어체중의2.87%
를제한공급하였으며
,
공급횟수는1
일2
회(08:00, 20:00h), 3
회(08:00, 14:00, 20:00h), 4
회(08:00, 12:00, 16:00, 20:00h), 5
회(08:00, 11:00, 14:00, 17:00, 20:00h), 7
회(08:00, 10:00, 12:00, 14:00, 16:00, 18:00, 20:00h), 9
회(08:00, 9:30, 11:00, 12:30, 14:00, 15:30, 17:00, 18:30, 20:00h)
로총7
개의실험구를설정하여실 험어에게동일한양으로나누어공급하였다.
어체 측정
어체측정항목과방법은실험
1
과2
에서동일하였으며, 2
주 에한번중간측정하였다.
성장률을측정하기위하여24
시간절식시킨후
MS-222 (100 ppm)
로마취시켜전체무게를측정하였다
.
실험종료후증체율(Weight gain, WG),
사료효율(Feed efficiency, FE),
일간성장율(Specific growth rate, SGR),
단백 질전환효율(Protein efficiency ratio, PER),
생존율(Survival)
을 측정하였으며,
실험구당15
마리씩(5 fish×3 replicates)
무작 위선택하여비만도(Condition factor, CF),
간중량지수(Hepa- tosomatic index, HSI),
내장중량지수(Viscerosomatic index, VSI)
를측정하였다.
일반성분 분석
각수조에서
5
마리씩무작위로추출하여분쇄한전어체를사 용하였으며, AOAC (AOAC, 2000)
방법에따라수분은상압 가열건조법(135℃, 2
시간),
조단백질은Kjeldahl
질소정량법(N×6.25),
조회분은직접회화법으로분석하였다.
조지방은샘플은
12
시간동결건조한후, Soxhlet
추출법으로분석하였다(Soxtec system 1046, Tacator AB, Sweden).
통계처리
모든자료의 통계처리는
J.M.P program version 9.1.3 sta- tistical software (SAS Institute, 2004)
를이용하여One-way ANOVA test
를실시한후,
최소유의차검정(LSD: Least Sig- nificant Difference)
을 실시하여 평균간의 유의성(P<0.05)
을 평가하였다.
적정사료공급률과 공급횟수는Broken line re- gression analysis (Robbins et al., 1979)
와Second-order poly- nomial model (Zeitoun et al., 1976)
을이용하여분석하였다.
모든실험결과값은
mean±SD
로표기되었다.
결과 및 고찰
실험 1 (적정 사료공급률)
저수온기에조피볼락치어를대상으로
4
주간의적정사료공 급률실험결과전실험구에서100%
의생존율을보였다(Table 1).
적정공급률실험에대한성장결과는Table 1
에나타내었 다.
증체율과일간성장율은3.00%
와만복구그룹에서2.75%, 3.25%
실험구와 차이를 보이지 않았으나(P>0.05), 1.00%,
2.25%, 2.50%
실험구에비해유의적으로높은값을나타내었다
(P<0.05).
이는사료공급률과 어류의성장사이에상관성을보인이전연구와유사한결과였다
(XiaoJun and Ruyung,
1992; Adebayo et al., 2000; Ng et al., 2000; Mihelakakis et al., 2002).
즉,
어류가충분한사료를섭취하지못하게되면체내영양소요구량부족으로조직내축적된에너지를소모하게 되고
,
이렇게소모된에너지는어체의성장에큰영향을주며,
어류의체조성및생존율에도영향을미칠수있다(Weatherley and Gill, 1987).
사료효율과 단백질전환효율은
2.25%
실험구가2.50%, 2.75%
실험구는 유의한 차이가 없었지만(P>0.05), 1.00%,
3.00%, 3.25%
실험구와만복구에비해유의하게높게나타났다
(P<0.05).
본연구에서사료효율은공급률이높아질수록증가하다가
2.25%
이후공급률이증가할수록낮아지는경향을보였다
(Table 2).
이전의보고에서는사료공급률이높아질수록체내로에너지가과잉으로공급되어단백질효율이떨어진다고 보고되었으며
(Meyer-Burgdorff et al., 1989),
반대로사료공급 률이낮을수록어체내에서영양분흡수를최적화하기위하여 소화효율을향상시킨다고보고되었다(Zoccarato et al., 1994;
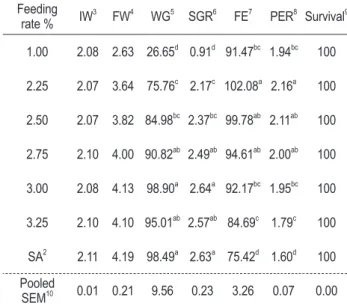
Table 1. Growth performance of juvenile Korean rockfish Se- bastes schlegeli fed a commercial diet for 4 weeks1 (Exp. 1)
Feeding
rate % IW3 FW4 WG5 SGR6 FE7 PER8 Survival9 1.00 2.08 2.63 26.65d 0.91d 91.47bc 1.94bc 100 2.25 2.07 3.64 75.76c 2.17c 102.08a 2.16a 100 2.50 2.07 3.82 84.98bc 2.37bc 99.78ab 2.11ab 100 2.75 2.10 4.00 90.82ab 2.49ab 94.61ab 2.00ab 100 3.00 2.08 4.13 98.90a 2.64a 92.17bc 1.95bc 100 3.25 2.10 4.10 95.01ab 2.57ab 84.69c 1.79c 100 SA2 2.11 4.19 98.49a 2.63a 75.42d 1.60d 100 Pooled
SEM10 0.01 0.21 9.56 0.23 3.26 0.07 0.00
1 Values are means form triplicate groups of fish where the values in each column the different superscripts are significantly different (P<0.05).
2SA: Satiation (3.46%)
3IW: Initial weight (g/fish)
4FW: Final weight (g/fish)
5WG: Weight gain (%) = (final weight - initial weight)×100 / initial weight
6SGR: Specific growth rate (%/day) = (loge final weight - loge ini- tial weight)×100 / days
7FE: Feed efficiency (%) = (wet weight gain / dry feed intake) × 100
8PER: Protein efficiency ratio = wet weight gain / protein intake
9Survival (%) =Number of fish at end of experiment / Number of fish stocked × 100
10Pooled SEM: Pooled standard error of mean: SD/
√
n .Table 2. Growth performance of juvenile Korean rockfish Se- bastes schlegeli fed a commercial diet for 4 weeks1 (Exp. 2)
Feeding frequency
(meals/day) IW2 FW3 WG4 SGR5 FE6 PER7 Survival8 2 2.04 3.56 74.61ab1.86ab74.14ab1.57ab 100
3 2.03 3.75 84.70a 2.04a 79.95a 1.69a 100
4 2.03 3.60 77.08ab1.90ab74.33ab1.57ab 100
5 2.03 3.53 73.64ab1.84ab71.66ab1.52ab 100
7 2.05 3.49 69.50b 1.76b 68.46b 1.46b 100
9 2.03 3.44 69.96b 1.77b 68.99b 1.46b 100 Pooled
SEM9 0.00 0.04 2.28 0.04 1.69 0.04 0.00
1 Values are means form triplicate groups of fish where the values in each column the different superscripts are significantly different (P<0.05).
2IW: Initial weight (g/fish)
3FW: Final weight (g/fish)
4WG: Weight gain (%) = (final weight - initial weight)×100 / initial weight
5SGR: Specific growth rate (%/day) = (loge final weight - loge ini- tial weight)×100 / days
6FE: Feed efficiency (%) = (wet weight gain / dry feed intake)×100
7PER: Protein efficiency ratio = wet weight gain / protein intake
8Survival (%) =Number of fish at end of experiment / Number of fish stocked×100
9Pooled SEM: Pooled standard error of mean: SD/
√
n .이진혁
ㆍ
김강웅ㆍ
이봉주ㆍ
박건현ㆍ
이준호ㆍ
윤현호ㆍ
배승철756
Van Ham et al., 2003).
이밖에줄무늬농어(Morone saxatilis)
및귀족도미(Sparus aurata)
와같은타어종의실험과유사한결 과를보였다(Hung et al., 1993; Mihelakakis et al., 2002).
전어체일반성분분석결과는
Table 3
에나타내었다.
수분함 량은1.00%
실험구가2.50%, 2.75%, 3.00%
에비해유의하게 높게나타났으며(P<0.05),
다른실험구와는유의한차이를보 이지않았다(P>0.05).
조단백질함량은전실험구에서유의한 차이를보이지않았다(P>0.05).
조지방함량은1.00%
실험구 가다른실험구에비해유의하게낮게나타났으며(P<0.05),
1.00%
실험구를제외한다른실험구간에는유의한차이를보이지않았다
(P>0.05).
조회분함량은1.00%
실험구가3.00%, 3.25%,
만복구에 비해 유의하게 높게 나타났으며(P<0.05),
2.25%, 2.50%, 2.75%
실험구와는유의한차이를보이지않았다
(P>0.05).
결과적으로사료공급률이증가할수록체내축적되는지방함량이증가하는경향을보였고
,
조회분은감소하는경향을보였지만
, 1%
공급구를제외한나머지실험구는유의차를보이질않았다
(Table 3). Lee and Hur (1993)
은조피볼 락을대상으로한10
주간의절식실험에서실험기간동안전어 체의일반성분변화를조사하였는데,
절식기간이길어질수록 수분함량은증가하고단백질및지질함량은감소하였다고보 고하였다.
또한사료공급률의증가로인해어체내지질함량이증가하면에너지소화율을감소시킬수있으며
(Smith, 1989),
영양소소화율은사료공급률에따라달라질수있다는연구 결과가보고되었다
(Hastings, 1969).
이와비슷한연구결과가 넙치치어를대상으로한Kim et al. (2007)
에의해보고되었 고,
연구결과사료공급률1.0%
일때2.2-2.8%
실험구에비하 여낮은전어체지질함량을보이고있지만, 2.2-2.8%
실험구의 지질함량은유의차를보이질않았다.
실험1
의비만도,
간중량 지수,
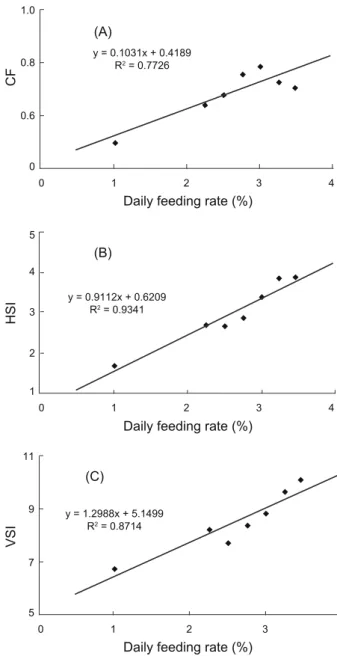
내장중량지수는사료공급률이증가할수록수치가증가 하는경향이나타났는데(Table 3, Fig. 3),
사료공급량이많은2.75% 3.00% 3.25%
실험구의비만도가1.00%
실험구에비해 유의적으로높은결과를보였다(P<0.05). 2.25% 2.50%
실험구 와만복구와는유의한차이가나타나지않았다(P>0.05).
간중 량지수는사료공급률이증가할수록높아지는경향을보였으나
,
만복구와3.25%
실험구간에는유의한차이를보이지않았다
(P>0.05).
내장중량지수역시사료공급률이증가할수록높아지는경향을보였으며
,
만복구와3.25%
실험구는실험구간에유의한차이를보이지않았다
(P>0.05).
이것은사료공급률이높아질수록체내에너지의축적이높아지기때문인것으로 확인되며
, Shimeno et al. (1997)
에따르면어류의체내대사작 용중pentose phosphate cycle
이사료공급률에민감하게반응 한다고보고하였다.
즉,
사료공급량이증가할수록여분의에 Table 3. Whole body proximate composition and biological indi-ces of juvenile Korean rockfish Sebastes schlegeli fed a commer- cial diet for 4 weeks1 (Exp. 1)
Feeding
rate% Moisture Crude proteinCrude
lipid Ash CF3 HSI4 VSI5 1.00 75.76a 62.29 12.52b19.50a 0.50d 1.68d 6.74d 2.25 75.27ab 60.81 18.77a18.49ab 0.64c 2.68c 8.23cd 2.50 74.33b 61.98 18.94a17.90ab0.68bc 2.65c 7.73c 2.75 74.36b 61.04 18.60a18.12ab0.76ab 2.85c 8.39c 3.00 74.25b 60.83 19.82a17.08b 0.79a 3.37b 8.84bc 3.25 74.92ab 62.57 17.99a17.22b 0.73ab 3.84a 9.67ab SA2 74.62ab 59.91 19.27a17.25b 0.71bc 3.87a 10.10a Pooled
SEM6 0.21 0.38 0.94 0.33 0.04 0.29 0.43
1Values are means form triplicate groups of fish where the values in each column the different superscripts are significantly different (P<0.05).
2SA: Satiation (3.46%)
3CF: Condition factor = 100 × Body weight / Total body length3
4HSI: Hepatosomatic index = Liver weight / Body weight × 100
5VSI: Viscerosomatic index = Visceral weight / Body weight × 100
6Pooled SEM: Pooled standard error of mean: SD/
√
n .Table 4. Whole-Body proximate composition and biological indi- ces of juvenile Korean rockfish Sebastes schlegeli fed a commer- cial diet for 4 weeks1 (Exp. 2)
Feeding frequency
(meals/day)Moisture Crude proteinCrude
lipid Ash CF2 HSI3 VSI4 2 74.82 61.33 18.52 18.74 0.64a 3.68abc12.33ab 3 74.96 60.98 18.11 18.85 0.65a 3.51bc12.17ab 4 74.34 61.26 17.17 18.72 0.65a 4.23a 13.28a 5 73.95 59.57 16.83 19.04 0.62ab 3.32c 11.80ab 7 75.2 60.47 16.00 19.83 0.57b 3.19c 11.75b 9 73.91 61.00 16.47 18.88 0.57b 2.91c 11.47b Pooled
SEM5 0.22 0.27 0.39 0.17 0.01 0.19 0.26
1Values are means form triplicate groups of fish where the values in each column the different superscripts are significantly different (P<0.05).
2CF: Condition factor = 100 × Body weight / Total Body Length3
3HSI: Hepatosomatic index = Liver weight / body weight × 100
4VSI: Viscerosomatic index = Visceral weight / body weight × 100
5Pooled SEM: Pooled standard error of mean: SD/
√
n .조피볼락 배합사료 적정 공급률과 횟수
757
너지가
pentose phosphate cycle
로생성된NADPH
를통해지 방산으로환원되면서판토테닉산으로전환된다.
판토테닉산은 글리세롤과반응하여중성지방이되는데이것이체내조직에 축적되며,
넙치(Kim et al., 2010; kim et al., 2011)
와조피볼락(Lee et al., 1996)
의실험결과유사한결과를보였고,
본실험결과와유사한결과를보였다
(Fig 3).
조피볼락증체율결과를바탕으로한배합사료의적정공급률은
broken line regression analysis
로분석한결과어체중의2.87%
로분석되었다. 실험 2(적정 사료공급 횟수)
조피볼락치어를대상으로
4
주간의사료공급횟수실험기간 동안모든실험구에서100%
의생존율을보였다(Table 2).
사료 공급횟수실험에대한성장결과는Table 2
에나타내었다.
모든 성장관련결과에서유사한경향을나타내었다.
증체율,
일간성 장율,
사료효율과단백질전환효율에서3
회실험구가2
회, 4
회,
5
회와는유의한차이를보이지않았으며(P>0.05), 7
회, 9
회실 험구에비해유의하게높은결과를나타내었다(P<0.05). 4
주간 의실험기간동안증체율과사료효율은공급횟수가늘어날수록 증가하다가적정공급횟수이상일경우감소하는경향을보였 다.
이러한경향은어류의장내소화또는흡수와밀접한관계가 있는것을보이며(kim et al., 2005), Henken et al. (1985)
는사 료공급횟수의증가가소화율을감소시킨다고보고하였다.
이 와같은경향은치어기넙치(Lee et al., 1999)
와조피볼락(Lee
Fig. 1. Broken line analysis of weight gain (WG, %) for optimumfeeding rate of juvenile Korean rockfish Sebastes schlegeli fed a commercial diet for 4 weeks in Exp 1.
Fig. 2. Broken line analysis of weight gain for optimum feeding frequency of juvenile Korean rockfish Sebastes schlegeli fed a commercial diet for 4 weeks in Exp 2.
Fig. 3. Correlation between feeding rate and biological indices;
condition factor (A), hepatosomatic index (B) and viscerosomatic index (C) of juvenile Korean rockfish Sebastes schlegeli fed a commercial diet for 4 weeks.
Daily feeding rate (%)
Daily feeding frequency (meals/day)
Daily feeding frequency (meals/day)
Daily feeding frequency (meals/day)
Daily feeding frequency (meals/day) Daily feeding rate (%)
Daily feeding rate (%)
Daily feeding rate (%)
Weight gain (%)Weight gain (%)CFHSIVSICFHSIVSI
120
100 80 60 40 20 0 80
40
00
0
0 0.6 0.8 1.0
0 1 2 3 4
1 2 3 4 5 6 7 8 9 10
1 2 3 4
2.87 % y = 37.583x - 10.311
R2 = 0.9963
y = -2.2662x + 87.665 R2 = 0.7639
y = 0.1031x + 0.4189 R2 = 0.7726
(A)
y = 10.09x + 54.43 R2 = 1
2.7 times
4 3 2 1 5
0 1 2 3 4
0.65 0.60 0.55 0.50 0.70
0 2 4 6 8 10
9
7
5 11
0 1 2 3 4
13
12
11 14
0 2 4 6 8 10
y = 0.9112x + 0.6209 R2 = 0.9341
y = 1.2988x + 5.1499 R2 = 0.8714
y = -0.0132x + 0.6828 R2 = 0.8349
(B)
(C)
(A)
4.0 3.5 3.0 2.5 4.5
0 2 4 6 8 10
y = -0.1256x + 4.1013 R2 = 0.5168
y = -0.1538x + 12.902 R2 = 0.3919
(B)
(C) Daily feeding rate (%)
Daily feeding frequency (meals/day)
Daily feeding frequency (meals/day)
Daily feeding frequency (meals/day)
Daily feeding frequency (meals/day) Daily feeding rate (%)
Daily feeding rate (%)
Daily feeding rate (%)
Weight gain (%)Weight gain (%)CFHSIVSICFHSIVSI
120
100 80 60 40 20 0 80
40
00
0
0 0.6 0.8 1.0
0 1 2 3 4
1 2 3 4 5 6 7 8 9 10
1 2 3 4
2.87 % y = 37.583x - 10.311
R2 = 0.9963
y = -2.2662x + 87.665 R2 = 0.7639
y = 0.1031x + 0.4189 R2 = 0.7726
(A)
y = 10.09x + 54.43 R2 = 1
2.7 times
4 3 2 1 5
0 1 2 3 4
0.65 0.60 0.55 0.50 0.70
0 2 4 6 8 10
9
7
5 11
0 1 2 3 4
13
12
11 14
0 2 4 6 8 10
y = 0.9112x + 0.6209 R2 = 0.9341
y = 1.2988x + 5.1499 R2 = 0.8714
y = -0.0132x + 0.6828 R2 = 0.8349
(B)
(C)
(A)
4.0 3.5 3.0 2.5 4.5
0 2 4 6 8 10
y = -0.1256x + 4.1013 R2 = 0.5168
y = -0.1538x + 12.902 R2 = 0.3919
(B)
(C)
Daily feeding rate (%)
Daily feeding frequency (meals/day)
Daily feeding frequency (meals/day)
Daily feeding frequency (meals/day)
Daily feeding frequency (meals/day) Daily feeding rate (%)
Daily feeding rate (%)
Daily feeding rate (%)
Weight gain (%)Weight gain (%)CFHSIVSICFHSIVSI
100 80 60 40 20 0 80
40
00
0
0 0.6 0.8 1.0
0 1 2 3 4
1 2 3 4 5 6 7 8 9 10
1 2 3 4
2.87 % y = 37.583x - 10.311
R2 = 0.9963
y = -2.2662x + 87.665 R2 = 0.7639
y = 0.1031x + 0.4189 R2 = 0.7726
(A)
y = 10.09x + 54.43 R2 = 1
2.7 times
4 3
2 1 5
0 1 2 3 4
0.65 0.60 0.55 0.50 0.70
0 2 4 6 8 10
9
7
5 11
0 1 2 3 4
13
12
11 14
0 2 4 6 8 10
y = 0.9112x + 0.6209 R2 = 0.9341
y = 1.2988x + 5.1499 R2 = 0.8714
y = -0.0132x + 0.6828 R2 = 0.8349
(B)
(C)
(A)
4.0 3.5 3.0 2.5 4.5
0 2 4 6 8 10
y = -0.1256x + 4.1013 R2 = 0.5168
y = -0.1538x + 12.902 R2 = 0.3919
(B)
(C)