Contents lists available at ScienceDirect
Redox Biology
journal homepage: www.elsevier.com/locate/redox
Research Paper
Isocitrate dehydrogenase 2 de ficiency aggravates prolonged high-fat diet intake-induced hypertension
Mi Ra Noh
a, Min Jung Kong
a, Sang Jun Han
a, Jee In Kim
b, Kwon Moo Park
a,∗aDepartment of Anatomy, Cardiovascular Research Center and BK21 Plus, School of Medicine, Kyungpook National University, 680 Gukchaebosang-ro, Junggu, Daegu, 41944, Republic of Korea
bDepartment of Molecular Medicine, Keimyung University School of Medicine, 1095 Dalgubeol-daero, Dalseogu, Daegu, 42601, Republic of Korea
A R T I C L E I N F O
Keywords:
Isocitrate dehydrogenase 2 Hypertension
Mitochondria Reactive oxygen species Renin-angiotensin system
A B S T R A C T
The development of hypertension is associated with mitochondrial redox balance disruptions. NADP
+-depen- dent isocitrate dehydrogenase 2 (IDH2) plays an important role in the maintenance of mitochondrial redox balance by producing mitochondrial NADPH, which is an essential cofactor in the reduction of glutathione (from GSSG to GSH) to reduced form of glutathione (GSH). We investigated the association of IDH2 between the development of prolonged high-fat diet (HFD)-induced hypertension. Idh2 gene-deleted (Idh2
−/−) male mice and wild-type (Idh2
+/+) littermates were fed either HFD or low-fat diet (LFD). Some mice were administrated with Mito-TEMPO, a mitochondria-speci fic antioxidant. HFD feeding increased blood pressure (BP) in both Idh2
−/−mice and Idh2
+/+mice. HFD-induced BP increase was greater in Idh2
−/−than Idh2
+/+mice. HFD intake decreased IDH2 activity, NADPH levels, and the GSH/(GSH + GSSG) ratio in the renal mitochondria.
However, HFD intake increased mitochondrial ROS levels, along with the accompanying oxidative stress and damage. HFD intake increased angiotensin II receptor 1 type 1 mRNA levels in the kidneys and plasma renin and angiotensin II concentrations. These HFD-induced changes were more prominent in Idh2
−/−mice than Idh2
+/+mice. Mito-TEMPO mitigated the HFD-induced changes in both Idh2
−/−and Idh2
+/+mice, with greater e ffects in Idh2
−/−mice than Idh2
+/+mice. These results indicate that prolonged HFD intake disrupts the IDH2- NADPH-GSH-associated antioxidant system and activates the renin-angiotensin system in the kidney, leading to increased BP, suggesting that IDH2 is a critical enzyme in the development of hypertension and that the IDH2- associated antioxidant system could serve as a potential hypertension treatment target.
1. Introduction
Hypertension, a multifactorial disease characterized by increased blood pressure (BP), is a risk factor for cardiovascular diseases [1].
Increased reactive oxygen species (ROS) production and elevated oxi- dative stress are believed to contribute to the development of hy- pertension [2]. Recently, many studies have emphasized the im- portance of mitochondria in the context of oxidative stress-associated hypertension [2 –6 ]. Hence, the regulation of mitochondrial ROS and their scavenging system to reduce oxidative stress has been perceived as a promising approach to controlling hypertension and hypertension- associated diseases [7 –9 ]. However, related mechanisms and e ffective therapeutic approaches based on ROS and oxidative stress remain to be defined.
Mitochondria are the major producers of ROS; however, they are
also vulnerable to the ROS they produce [10]. Therefore, to cope with oxidative stress, mitochondria have their own speci fic antioxidant system. In normal conditions, the superoxide anion (O
2-) generated during the process of mitochondrial energy production is converted to hydrogen peroxide (H
2O
2) by manganese superoxide dismutase (MnSOD) and then reduced to H
2O by glutathione peroxidase (GPx) coupled to glutathione and glutathione reductase (GR), peroxiredoxin (Prx) coupled to thioredoxin (Trx) and thioredoxin reductase (TrR) [11,12]. In pathological conditions, including obesity, the mitochon- drial ROS production exceeds ROS scavenging capacity, which can se- verely damage the ROS scavenging system, exposing the mitochondria to oxidative stress [12 –15 ]. Recent researches have demonstrated that mitochondrial redox imbalances are associated with the development of hypertension and that mitochondrial antioxidant reagents effectively diminish hypertension [3,9,16].
https://doi.org/10.1016/j.redox.2020.101548
Received 24 March 2020; Received in revised form 16 April 2020; Accepted 20 April 2020
∗
Corresponding author. Department of Anatomy, Cardiovascular Research Institute and BK21 Plus, School of Medicine, Kyungpook National University, 680 Gukchaebosang-ro, Junggu, Daegu, 41944, Republic of Korea.
E-mail address:
kmpark@knu.ac.kr(K.M. Park).
Available online 25 April 2020
2213-2317/ © 2020 The Authors. Published by Elsevier B.V. This is an open access article under the CC BY-NC-ND license (http://creativecommons.org/licenses/by-nc-nd/4.0/).
T
Mitochondrial NADPH is essential for the reduction of glutathione from GSSG to GSH in that it supplies the reducing equivalent [17,18].
GSH is required in the GPx- and thiol-based mitochondrial anti-oxidant system [12]. NADPH does not shuttle between the cytosol and mi- tochondria. Therefore, mitochondria have their own NADPH producing enzymes such as nicotinamide nucleotide transhydrogenase (NNT) and isocitrate dehydrogenase 2 (IDH2) [19,20]. IDH2, which was the focus of this study, consumes NADP
+during the catalysis of isocitrate to α- ketoglutarate in the tricarboxylic acid cycle and produces NADPH [21].
Three mammalian isocitrate dehydrogenases (IDHs), have been re- ported: IDH1, IDH2, and IDH3 [21,22]. IDH1 and IDH2 are NADP
+- dependent, and they are found in the cytosol and mitochondria, re- spectively [22]. IDH3 is NAD
+-dependent, and it is found in the mi- tochondria [22]. Therefore, IDH1 and IDH2 have been proposed as important NADPH producers in the cytoplasm and mitochondria, re- spectively, and also as major antioxidant enzymes. In fact, recently, other investigators and we found that IDH2 defect, exacerbates mi- tochondrial oxidative stress, whereas increased IDH2 activation pro- vides mitochondrial resistance against oxidative stress [23–28].
Obesity is a well-known risk factor for hypertension and approxi- mately 65 –70% of the risk for hypertension is associated with obesity- related diseases [29,30]. Obesity is associated with excessive ROS production during ATP generation in multiple organs, overwhelming their antioxidant capacity [15]. Studies have shown that obesity con- tributes to the development of hypertension and that increased ROS level and oxidative stress are associated with obesity-induced hy- pertension [29,31]. Recent studies including ours have shown that IDH2 plays an important role in the development of obesity [32,33].
These data suggest that IDH2 may be involved in the development of hypertension. However, the role of IDH2 in hypertension and its un- derlying mechanisms are yet to be de fined. Therefore, in this present study, we investigated the role of IDH2 in the context of obesity-in- duced hypertension and found that prolonged high-fat diet (HFD) in- take impairs the functioning of IDH2 and its related antioxidant system.
We also found that IDH2 gene deletion exacerbates obesity-induced hypertension, whereas mitochondrial antioxidants supplied by HFD feeding attenuated blood pressure increases in mice. These results suggest that IDH2 is associated with obesity-induced hypertension and may be a useful therapeutic target protein for the development of hy- pertension treatment.
2. Materials and Methods 2.1. Animal preparation
Eight-week-old Idh2 knockout (Idh2
−/−) male mice and wild-type (Idh2
+/+) littermates weighing 20 –25 g were used in these experi- ments. The Idh2
−/−and Idh2
+/+mice were generated and char- acterized as previously described [34]. This study was conducted in accordance with the guidelines of the Institutional Animal Care and Use Committee of Kyungpook National University, Republic of Korea. Be- fore the starting experiments, the mice were provided free access to water and standard chow. Mice were randomly assigned and fed with either an HFD containing 60% kcal from fat (TD.06414, Harlan La- boratories, Inc., Madison, WI, USA) or a low-fat diet (LFD) containing
10% kcal from fat (TD.94048, Harlan Laboratories). Some mice were injected intraperitoneally with (2-(2,2,6,6-Tetramethylpiperidin-1- oxyl-4-ylamino)-2-oxoethyl) triphenylphosphonium chloride (Mito- TEMPO, 0.7 mg/kg body weight; Sigma, St. Louis, MO, USA), a mi- tochondrial antioxidant reagent, once daily. Body weight and food in- take were measured once a week after HFD or LFD feeding. The kidneys were either snap-frozen in liquid nitrogen or perfusion-fixed in PLP (4%
paraformaldehyde, 75 mM
L-lysine, and 10 mM sodium periodate;
Sigma). More than 10 mice were used for the measurements of blood pressure and more than 6 mice were used for biochemical studies.
2.2. Measurement of blood pressure
Blood pressures (BPs) were measured using a CODA High Throughput Noninvasive BP system (CODA, Kent Scienti fic, Torrington, CT, USA) according to the manufacturer ’s instruction. Briefly, conscious mice were preheated on a hot plate at 35 °C for 10 min and then placed in a restrainer. A cuff with a pneumatic pulse sensor was attached to the tail. BP values were recorded with heating, and the mean of ten con- secutive readings was obtained from each mouse.
2.3. Analysis of mouse blood
Blood was withdrawn from the mice using a heparinized syringe.
Plasma cholesterol, triglyceride (TG), and high-density lipoprotein (HDL) levels were determined using a VITROS 250 Chemistry Analyzer (Johnson & Johnson, Rochester, NY, USA) according to the manufac- turer's instructions.
2.4. Preparation of cytosolic and mitochondrial fractions from tissue
Cytosolic and mitochondrial fractions were prepared as described previously [35]. Brie fly, frozen kidney tissue was homogenized in su- crose buffer (0.2 M sucrose, 1 mM EGTA, 10 mM HEPES, pH 7.4;
Sigma) on ice, three times using a Teflon Homogenizer (Daihan Sci- enti fic, Seoul, Korea) at 1,600 rpm. The homogenate was centrifuged at 600×g for 10 min, and then the supernatant was centrifuged at 7,000×g for 10 min. The supernatant comprised the cytosolic fraction, and it was centrifuged again at 7,000×g for 10 min, to purify the cy- tosolic fraction. The mitochondrial pellet was washed twice with su- crose buffer and was centrifuged again at 7,000×g for 10 min. The pellet was suspended in phosphate-buffered saline, containing 0.1%
Triton X-100, disrupted twice with a sonicator (4710 series; Cole- Palmer, Chicago, IL, USA) at 40% of the maximum setting for 10 s, and centrifuged at 15,000×g for 30 min. The supernatant comprised the mitochondrial fraction, and it was used to measure enzymatic activity.
Equal amounts of fractionated proteins were separated by SDS-PAGE and transferred to a PVDF membrane. Effective isolation of those fractions was con firmed by Western blot analysis, using antibodies against IDH2 or COX-IV protein for the mitochondrial fraction.
2.5. Western blot analysis
Protein samples were prepared as described previously [36]. Protein samples were electrophoresed and subjected to immunoblotting with Abbreviations and acronyms
IDH2 Isocitrate dehydrogenase 2 HFD High-fat diet
LFD Low-fat diet GSH Glutathione GSSG Reduced glutathione GPx Glutathione peroxidase
GR Glutathione reductase Trx Thioredoxin
Prx Peroxiredoxin TrR Thioredoxin reductase Ang II Angiotensin II AGT Angiotensinogen
ACE Angiotensin-converting enzyme
AT1R Angiotensin II type 1 receptor
antibodies against IDH2 [37], peroxiredoxin-SO
3(PrxSO
3; Abcam, Cambridge, MA, USA), COX-IV (Abcam), and GAPDH (Novus, Littleton, CO, USA), and the blot densities were quanti fied using Image J software (National Institutes of Health, Bethesda, MD, USA).
2.6. Measurement of IDH2 activity in the renal mitochondrial fraction
IDH2 activity was measured in the kidney tissue mitochondrial fraction, as described previously [24]. Briefly, mitochondrial fraction (50 μg protein) was combined with a reaction mixture containing 40 mM Tris (pH 7.4), 2 mM NADP
+, 2 mM MgCl
2and 50 mM threo-DS- isocitrate (Sigma), and NADPH production was measured. IDH2 activity was defined by the changes in absorbance at 340 nm per 1 mg of protein at 37 °C for 1 min. Mitochondrial fractionation was con firmed by Western blot analysis using COX-IV antibody.
2.7. Measurement of NADPH concentration in the renal mitochondrial fraction
NADPH concentration was determined using an EnzyChrom™
NADP/NADPH Assay Kit (BioAssay Systems, Hayward, CA, USA) ac- cording to the manufacturer ’s instruction. In brief, freshly isolated mitochondrial tissue fractions were suspended in 100 μl NADPH ex- traction buffer for NADP determination or 100 μl NADPH extraction bu ffer for NADPH determination. Those mixtures were heated at 60 °C for 5 min and then 20 μl assay buffer and 100 μl of the opposite ex- traction buffer were added to neutralize the extracts. After centrifuga- tion at 14,000 rpm for 5 min, the supernatant was used for measure- ment. In a 96-well plate, 40 μl samples were transferred and added 80 μl working reagent (60 μl assay buffer, 1 μl enzyme mix, 10 μl glucose, and 14 μl MTT). The plate was read at 565 nm at time zero and at 30 min. The concentration of NADP(H) was calculated using the change of optical density at 565 nm for 30 min. The sample NADP(H) con- centration was determined using the standard curve.
2.8. Measurement of oxidized glutathione (GSSG) and total glutathione levels in the renal mitochondrial fraction
The ratio of oxidized glutathione (GSSG) to total glutathione (GSH + GSSG) was measured using an enzymatic recycling method, as previously described [35]. The amount of total glutathione was de- termined by analyzing the formation of 5-thio-2-nitrobenzoic acid (TBA) from 5,5-dithiobis (2-nitrobenzoic acid) (DTNB). GSSG was measured by adding 2-vinylpyridine, which inhibits TBA formation when DTNB and glutathione react. Total GSH and GSSG levels were de fined by the changes in optical density at 412 nm for 1 min at 37 °C.
2.9. Measurement of H
2O
2levels in the renal mitochondrial fraction
H
2O
2levels in the mitochondrial fraction the kidney tissue were measured using xylenol orange (Sigma, St. Louis, MO, USA), a dye sensitive to ferric ions, as described previously [35].
2.10. Immunohistochemical staining
Immunohistochemical staining was performed using anti-8-hy- droxy-2′-deoxyguanosine (8-OHdG; Abcam, Cambridge, MA, USA) an- tibody, as previously described [38]. The 8-OHdG-antibody binds to DNA damaged by oxidation in mitochondria and nuclei [39]. Sections were viewed under a Leica microscope (DM2500, Wetzlar, Germany).
Photomicrographs were obtained randomly from the cortical region.
The intensity of 8-OHdG stains were measured under 400X magni fica- tion using an image analysis program (i-solution, IMT, Korea).
2.11. Transmission electron microscopy (TEM)
Kidney TEM samples were prepared as described previously [35].
Briefly, kidneys were perfusion-fixed with 2.5% glutaraldehyde via the abdominal aorta, then stored overnight in the fixative at 4 °C. Samples were cut into 1 mm
3pieces, washed in 0.1 M phosphate bu ffer, and then post-fixed in aqueous 2% osmium tetroxide for 90 min. After three washes with 0.1 M phosphate buffer, the samples were dehydrated through a graded series of 50% to 100% ethanol, 100% propylene oxide, and then in filtrated in 1:1, 1:2, and 1:3 mixtures of propylene oxide: Epon Resin 828 (Polysciences Inc., Warrington, PA, USA) for 1 h.
After the samples had been incubated in 100% Epon Resin 828 over 8 h, they were then embedded in molds and cured at 35 °C and 45 °C for 12 h, followed by additional hardening at 60 °C for 2 days. Ultrathin (60 nm) sections were double-stained with 2% uranyl acetate and 1%
lead citrate. Sections were visualized using a transmission electron microscope (H-7000; Hitachi, Yokohama, Japan) at 75 kV. Electron micrographs of the mitochondria were captured from proximal tubule cells in the outer stripe of the outer medulla. The mitochondrial aspect ratio (major axis/minor axis) was computed using 30 mitochondria per cell.
2.12. Measurements of angiotensin II (AngII) and renin in plasma
Plasma was prepared from heparin-treated blood samples.
Concentrations of plasma Ang II was measured using an Ang II ELISA kit (Phoenix Pharmaceuticals, INC., Burlingame, CA, USA) and renin was measured using a renin assay kit (BPS Bioscience, San Diego, CA, USA), according to the manufacturers ’ instructions.
2.13. Quantitative real-time PCR analysis
RNA was extracted using Tri-RNA reagent (Favorgen, Pingtung, Taiwan) from homogenized kidneys. Next, 1 μg of RNA was used for cDNA synthesis using the DiaStar RT Kit (SolGent, Daejeon, Korea).
Quantitative real-time PCR (qRT-PCR) was performed using SYBR Green I Master mix (Enzo Life Science, Farmingdale, NY, USA) and the Agilent Real-time PCR System (Agilent Technology, Santa Clara, CA, USA). Murine qRT –PCR primer sequences were 5′-CTCGAACTCAAAG CAGGAGAG-3′ and 5′-GTAGATGGCGAACAGGAAGG-3′ for angiotensi- nogen (AGT); 5 ′-GAACGAATCCCGCTCAAGA A-3′ and 5′-AGGAAGGC CTCTTTGTGAATAC-3 ′ for renin; 5′-GACAGGTTCGTGGAAGAGTATG-3′
and 5′-TTGCTGCCCTCTATGGTAATG-3′ for angiotensin converting en- zyme (ACE); 5′-TGCCCATAACCATCTGCATA G-3′ and 5′-TTCAGGAGC TGGGGAAATAC-3 ′; for Ang II receptor type 1 (AT1R); and 5′-GTAAC CCGTTGAACCCCATT-3′ and 5′-CCATCCAATCGGTAGTAGCG-3′ for 18S rRNA, sense and antisense, respectively.
2.14. Statistical analyses
All data were analyzed using GraphPad Prism 7 software (San Diego, CA, USA). Results are expressed as mean ± standard deviation (SD). Comparisons among groups were performed using ANOVA or unpaired Student's t‐test. Multiple groups at different time points were determined using two-way ANOVA. Blood pressures with Mito-TEMPO treatment were analyzed by three-way ANOVA with times, genotypes, and Mito-TEMPO treatment as factors. Differences were regarded as statistically signi ficant when they had p values < 0.05.
3. Results
3.1. Idh2 gene deletion augments HFD-induced BP increases
First, we measured blood pressure in normal chow-fed 8-week-old
Idh2
+/+and Idh2
−/−mice, before controlled diet (HFD or LFD)
feedings (Fig. 1 and Supp. Tables 1 and 2). Systolic blood pressures
(SBPs) were 105 ± 4.91 mmHg and 103 ± 4.80 mmHg for Idh2
−/−mice and Idh2
+/+mice respectively, showing no signi ficant difference between groups (Fig. 1). After HFD feeding, SBPs began increasing 4 weeks later, and they continuously increased at a statistically sig- ni ficant rate for 8 weeks (148.2 ± 10.87 mmHg in Idh2
−/−; 135.9 ± 11.41 mmHg in Idh2
+/+mice) and reached means of 164.5 ± 13.66 mmHg and 140.7 ± 8.25 mmHg in Idh2
−/−and Idh2
+/+mice 12 weeks, respectively (Fig. 1). This increase was sig- nificantly greater in Idh2
−/−mice relative to Idh2
+/+mice at 12 weeks (p < 0.001) (Fig. 1). After 12 weeks, LFD, SBPs of the LFD-fed both Idh2
+/+and Idh2
−/−mice were slightly increased relative to the baseline measurements, but the changes were not statistically sig- nificant (Fig. 1). These data indicate that HFD feeding induce BP in- creases in both Idh2
−/−and Idh2
+/+mice and that Idh2 de ficiency exacerbates the BP increase.
Before LFD and HFD feeding, body weights (BWs) did not sig- nificantly differ between Idh2
+/+and Idh2
−/−mice (21.55 ± 0.43 g and 22.35 ± 0.50 g, respectively). BW of the Idh2
−/−mice was lower than that of the Idh2
+/+mice, but this difference was not statistically significant (Table 1). Twelve weeks after LFD feeding, there was no signi ficant differences in BW and WAT weight between Idh2
+/+and Idh2
−/−mice (Table 1). Twelve weeks after the base line measure- ments, the plasma concentrations of cholesterol, high-density lipopro- tein (HDL), and triglyceride (TG), as well as the visceral fat weights of both Idh2
+/+and Idh2
−/−mice were greater in HFD-fed than those in LFD-fed mice (Table 1). These HDL and cholesterol levels were higher in Idh2
−/−mice than Idh2
+/+mice (Table 1). However, there were no
significant differences in serum HDL, TG, and cholesterol levels be- tween Idh2
−/−mice and Idh2
+/+mice 12 weeks of LFD feeding (Table 1).
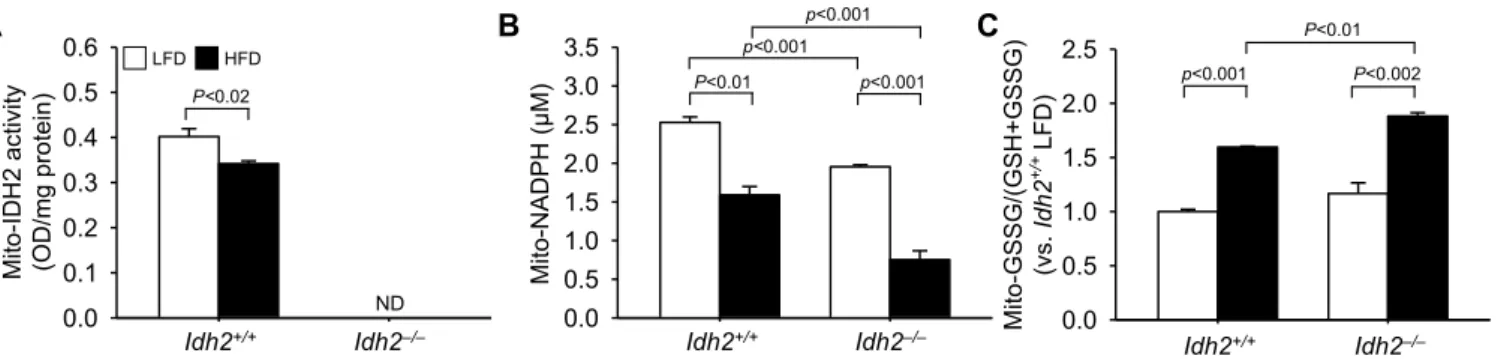
3.2. HFD-feeding reduces IDH2 activity and NADPH levels in the kidney mitochondria
To test whether HFD feeding affects IDH2 function, we determined IDH2 activity in the mitochondrial fraction of Idh2
+/+and Idh2
−/−mouse kidneys. IDH2 activity levels in HFD-fed Idh2
+/+mice were significantly lower than those in LFD-fed mice (Fig. 2A). IDH2 activity in Idh2
−/−mouse kidney tissue was undetectable (Fig. 2A). IDH2 re- duces the NADP
+to NADPH during the decarboxylation of isocitrate to α-ketoglutarate, and given this role, this is recognized as a key gen- erator of NADPH in the mitochondria [22,23]. After 12 weeks of con- suming di fferent diets, we examined whether Idh2 gene deletion and HFD-feeding affect the NADPH production in the mitochondrial frac- tion from kidneys. The level of NADPH was also significantly lower in both HFD-fed Idh2
+/+and HFD-fed Idh2
−/−mice than in LFD-fed control mice (Fig. 2B). After 12 weeks of HFD-feeding, NADPH levels of LFD-fed Idh2
−/−mice and LFD-fed Idh2
+/+mice were lowered to 61.54% and 37.11% relative to the levels of found in LFD-fed mice, respectively (Fig. 2B). NADPH level in the LFD-fed Idh2
−/−mouse kidneys was slightly lower than that in the LFD-fed Idh2
+/+mouse kidneys (Fig. 2B). Since NADPH plays a critical factor in the reduction of glutathione (GSH) from oxidized glutathione (GSSG) [17,18], we determined the ratio of GSSG to total glutathione (tGSH, GSSG + GSH) in the kidney mitochondria. After 12 weeks of HFD-feeding, the ratio of GSSG to tGSH in the mitochondria increased in both Idh2
−/−mice and Idh2
+/+mice, but with a greater increase in Idh2
−/−mice (Fig. 3A).
The ratio of GSSG to tGSH in LFD-fed Idh2
−/−mice was higher than that in the LFD-fed Idh2
+/+mice, but this di fference was not statisti- cally signi ficant ( Fig. 2C). These data indicate that HFD-feeding induces an attenuation of IDH2 activity, leading to decreased NADPH levels and subsequent increases of GSSG/(GSH + GSSG) ratio.
3.3. HFD-feeding increases H
2O
2levels, oxidative stress, and damage in the kidney mitochondria
To investigate whether the reduced IDH2-NADPH-GSH-coupled mitochondrial antioxidant system affects mitochondrial redox balance, we determined the levels of H
2O
2, and the expression of oxidized Prx (PrxSO
3, a form of oxidized Prx) and 8-OHdG, an indicator of DNA oxidation, in the kidneys. HFD feeding for 12 weeks increased H
2O
2levels in the mitochondrial fractions of both Idh2
−/−and Idh2
+/+mouse kidneys and the increase of H
2O
2level was higher in Idh2
−/−mice than Idh2
+/+mice (Fig. 3A). PrxSO
3expression also increased in the kidneys of both Idh2
+/+and Idh2
−/−mice after 12 weeks of HFD feeding and this increase was greater in Idh2
−/−mice than in Idh2
+/+mice (Fig. 3B and C). When DNA oxidation was determined by im- munostaining with 8-OHdG antibody, 8-OHdG-positive signals were observed in both the cytosol and nuclei of tubular cells of both Idh2
−/−Fig. 1. Effect of IDH2 on systolic blood pressure (SBP) after high-fat diet feeding. Eight-week-old Idh2
+/+and Idh2
−/−male mice were fed a low-fat diet (LFD) or high-fat diet (HFD) for 12 weeks. SBP was measured using the tail- cuff method at indicated times. SBP values were obtained from ten consecutive readings at each mouse. Results are expressed as the mean ± standard de- viation (n = 10 –18). Statistical analysis was performed by two-way ANOVA with repeated measures followed by post hoc Bonferroni’s multiple comparisons test. LFD, low-fat diet; HFD, high-fat diet; NS, non-signi ficance.
Table 1
The e ffects of high-fat diet feeding on body weight, kidney weight, visceral adipose tissue weight, cholesterol, triglyceride, and high-density lipoprotein levels. Eight- week-old Idh2
+/+and Idh2
−/−male mice were fed low-fat diet (LFD) or high-fat diet (HFD) for 12 weeks. Kidney and visceral white adipose tissue weight were measured after harvesting. Results are expressed as the mean ± standard deviation (n = 10–18). LFD, low-fat diet; HFD, high-fat diet. *, p < 0.05 vs. respective LFD; †, p < 0.05 vs. Idh2
+/+HFD.
Idh2+/+ LFD Idh2+/+ HFD Idh2−/− LFD Idh2−/− HFD
Body weight (g) 33.63 ± 1.76 47.01 ± 1.20* 32.53 ± 0.92 45.65 ± 1.23*
Kidney weight (g) 0.150 ± 0.007 0.169 ± 0.008 0.142 ± 0.009 0.184 ± 0.011*
Visceral WAT (g) 1.206 ± 0.157 1.570 ± 0.168 1.162 ± 0.101 1.550 ± 0.067*
Cholesterol (mg/dl) 136.75 ± 26.22 182.50 ± 20.85* 155.33 ± 9.88 287.25 ± 16.67*†
HDL (mg/dl) 95.00 ± 34.65 119.67 ± 13.00 107.33 ± 13.61 156.33 ± 2.25*†
Triglyceride (mf/dl) 100.25 ± 8.69 113.00 ± 14.74 77.33 ± 6.33 121.50 ± 18.08*
and Idh2
+/+mice 12 weeks after HFD-feeding, indicating that mi- tochondrial and nuclear DNAs are damaged oxidatively. The positive signal of 8-OHdG antibody was also greater in Idh2
−/−mice than Idh2
+/+mice (Fig. 3D and E). After LFD-feeding, the levels of H
2O
2, DNA oxidation, and PrxSO
3expression were slightly higher in Idh2
−/−mice than Idh2
+/+mice (Fig. 3A). These data indicate that HFD intake increases mitochondrial ROS production and oxidative stress and that IDH2 deficiency exacerbates these increases.
To evaluate whether impairment of the mitochondrial IDH2- NADPH-GSH anti-oxidative system is associated with functional and structural damage to mitochondria, we determined the mitochondrial dynamics and morphology and IDH2 activity in kidney proximal tubule cells 6 weeks after the initiation of HFD-feeding, when SBP started to increase. Six weeks after the initiation of HFD feeding, transmission electron microscopy (TEM) data revealed swelling of mitochondria with cristae loss and mitochondrial membrane disruption in both Idh2
−/−Fig. 2. IDH2 activity, NADPH level and GSSG/(GSH + GSSG) ratio in the renal mitochondria after high-fat diet feeding. Eight-week-old Idh2
+/+and Idh2
−/−male mice were fed a low-fat diet (LFD) or high-fat diet (HFD) for 12 weeks and then the mice kidneys were harvested. The fractionations of mitochondria from kidney tissues were performed as described in the Materials and Methods section. Mitochondrial fractionations were con firmed by Western blot analysis using an anti-COX-IV antibody. (A) IDH2 activities and (B) NADPH concentrations were measured in the mitochondrial fractions of kidneys (C) The ratio of oxidized glutathione (GSSG) to total glutathione (GSH + GSSG) were determined in the mitochondrial fractions. Results are expressed as the mean ± standard deviation (n = 6). LFD, low-fat diet; HFD, high-fat diet; ND, non-detection.
Fig. 3. Mitochondrial H
2O
2and oxidative stress levels, and mitochondrial damage in the kidneys of Idh2
+/+and Idh2
−/−mice after high-fat diet feeding.
Eight-week-old Idh2
+/+and Idh2
−/−male mice were fed a low-fat diet (LFD) or high-fat diet (HFD) for 12 weeks. And then the mouse kidneys were frozen in a
liquid nitrogen or fixed in PLP solution for biochemical and histological studies, respectively. (A) H
2O
2levels were determined in the mitochondrial fractions of
kidney tissues. Mitochondrial fractionations were confirmed by Western blot analysis using an anti-COX-IV antibody. (B) PrxSO
3expressions were determined in the
kidney mitochondrial fractions by Western blot analysis using an anti-PrxSO
3antibody. COX-IV was used as a loading control for the mitochondrial fraction. (D)
Fixed kidney tissues were cut 3 μm thickness using a microtome and then kidney sections were subjected to immunohistochemical staining using an anti-8-OHdG
antibody. Images were taken from the cortical lesions. Brown colors are 8-OHdG-positive signals. Inserts are at high magnifications. (E) Intensities of 8-OHdG stains
were measured under 400X magni fication using an image analysis program (i-solution). (F) Six weeks after the initiation of HFD, mitochondrial structures were
evaluated under transmission electron microscopy (TEM). Red arrowheads indicate damaged mitochondrial structures. (G) The aspect ratio (major axis/minor axis)
of mitochondria in the TEM pictures was measured. Results are expressed as the mean ± standard deviation (n = 6). LFD, low-fat diet; HFD, high-fat diet.
and Idh2
+/+mouse kidneys (Fig. 3F), representing decreases of the mitochondrial aspect ratio (the ratio between the major and minor axis of the ellipse equivalent to the mitochondrion) (Fig. 3F and G). These mitochondrial structural changes and the decrease in aspect ratio were greater in HFD-fed Idh2
−/−mice than Idh2
+/+mice (Fig. 3F). There was no signi ficant difference in mitochondrial aspect ratio between Idh2
+/+and Idh2
−/−kidneys 6 weeks after LFD-feeding (Fig. 3G).
These results indicate that HFD feeding induces mitochondrial damage, suggesting that HFD-induced mitochondrial damage is a risk factor for HFD-induced hypertension.
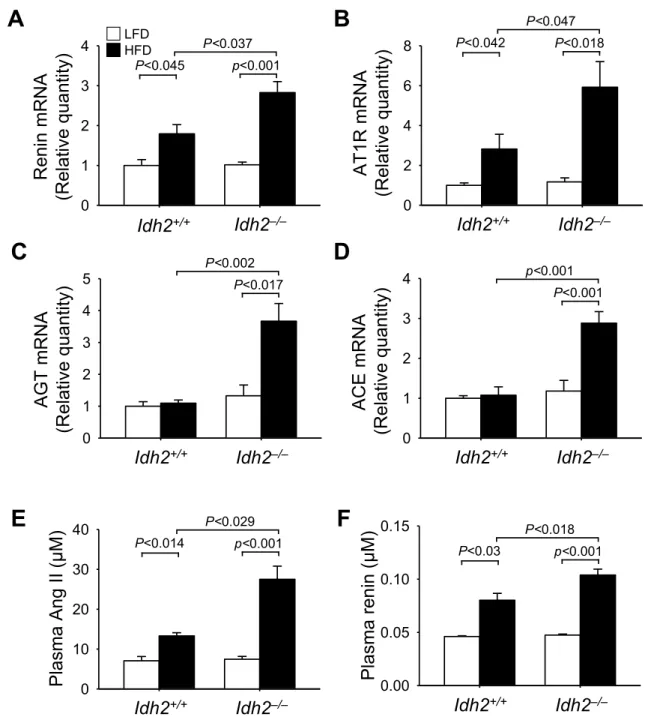
3.4. Idh2 deletion exacerbates HFD-induced renin-angiotensin system (RAS) activation in the kidney
ROS and oxidative stress affect the RAS both locally and systemi- cally, and this strongly influences the development of hypertension [40 –43 ]. Therefore, we determined whether Idh2 gene deletion and HFD-feeding affect kidney RAS components, including angiotensinogen (AGT), renin, angiotensin-converting enzyme (ACE), and angiotensin II type I receptor (AT1R) and discovered the following. After 12 weeks of HFD-feeding renin and AT1R mRNA levels increased in both Idh2
−/−and Idh2
+/+mouse kidneys (Fig. 4A and B), with a greater increase in Idh2
−/−mice (Fig. 4A and B). AGT and ACE mRNA levels signi ficantly increased in the Idh2
−/−mouse kidneys after 12 weeks of HFD-feeding
Fig. 4. Renin-angiotensin system component mRNA expression in the kidney and angiotensin II and renin concentrations in the blood of Idh2
+/+and
Idh2
−/−mice after high-fat diet feeding. Eight-week-old Idh2
+/+and Idh2
−/−male mice were fed a low-fat diet (LFD) or high-fat diet (HFD) for 12 weeks and
then harvested. mRNAs were extracted from kidney tissues using RNA extraction solution as described in the Materials and Methods. The mRNA levels of renin (A),
angiotensin II type 1 receptor (AT1R) (B), angiotensinogen (AGT, C), and angiotensin-converting enzyme (ACE, D) were measured in the kidneys. mRNA levels were
normalized by 18S rRNA levels. Plasma concentrations of angiotensin II (Ang II, E) and renin (F) were determined 12 weeks after initiating HFD feeding. Results are
expressed as the mean ± standard deviation (n = 6). LFD, low-fat diet; HFD, high-fat diet.
(Fig. 4C and D); however, they were not significantly increased in Idh2
+/+mouse kidneys (Fig. 4C and D). Plasma angiotensin II (Ang II) and renin concentrations increased in both Idh2
+/+and Idh2
−/−mice after 12 weeks of HFD-feeding (Fig. 4E and F) and these increases were much greater in the Idh2
−/−mice than in the Idh2
+/+mice (Fig. 4E and F). In contrast, there were no signi ficant differences in AGT, AT1R, ACE, and renin mRNA levels and plasma Ang II and renin concentra- tions in between LFD-fed Idh2
−/−and Idh2
+/+mice (Fig. 4E and F).
These results indicate that HFD feeding activates the RAS, and Idh2 gene deletion accentuates this activation.
3.5. Mito-TEMPO treatment inhibits HFD-induced increases of BP, H
2O
2, and RAS components in both Idh2
−/−and Idh2
+/+mice, with greater attenuation in Idh2
−/−mice
To determine whether the greater BP increases in Idh2
−/−mice after HFD feeding were due to greater increases of mitochondrial ROS level and RAS activation, we investigated whether Mito-TEMPO, a mitochondria-speci fic O
2−scavenger, could prevent BP increases after HFD feeding as well as the effects of Idh2 gene deletion. Either Mito- TEMPO (0.7 mg/kg/day) or vehicle (saline) was administered to the mice daily, for 10 days, 8 weeks after the initiation of HFD feeding.
First, we determined SBP in those mice. Mito-TEMPO treatment sig- nificantly lowered the SBPs in both Idh2
+/+and Idh2
−/−mice after HFD-feeding when compared with vehicle treatment, and the reduction in Idh2
−/−mice was much greater than that in Idh2
+/+mice (Fig. 5 and Supp. Tables 3 and 4). Ten days after Mito-TEMPO, SBPs in the Idh2
−/−mice were similar with those in the Idh2
+/+mice (Fig. 5).
Next, we determined the H
2O
2level in the mitochondrial fraction of the Mito-TEMPO-administered mice kidney tissues. After 12 weeks of HFD feeding H
2O
2levels increased in the mitochondrial fractions of both Idh2
−/−and Idh2
+/+mouse kidneys and the increase of H
2O
2level was higher in Idh2
−/−mice than Idh2
+/+mice (Fig. 6). Mito- TEMPO treatment completely prevented HFD-induced increases of H
2O
2in both Idh2
+/+and Idh2
−/−mice, with a greater e ffect in the Idh2
−/−mice (Fig. 6). Mito-TEMPO treatment also reduced the kidney H
2O
2levels in both Idh2
+/+and Idh2
−/−mice fed with LFD (Fig. 6).
These data indicate that the mitochondrial-targeted O
2−scavenger Mito-TEMPO attenuates HFD-induced BP increases, also Idh2 gene-de- letion induced BP increases, suggesting that the increases of mi- tochondrial ROS and oxidative stress are mediated the HFD- and Idh2 gene deletion-induced hypertension.
Finally, we examined the effect of Mito-TEMPO on HFD-induced RAS activation. HFD-feeding for 12 weeks increased renin and AT1R mRNA levels in both Idh2
−/−and Idh2
+/+mouse kidneys (Fig. 7A and B), with a greater increase in Idh2
−/−mice (Fig. 7A and B). AGT and ACE mRNA levels significantly increased in the Idh2
−/−mouse kidneys after 12 weeks of HFD-feeding (Fig. 7C and D), whereas there were no significant differences between LFD- and HFD-feeding in Idh2
+/+mouse kidneys (Fig. 7C and D). Mito-TEMPO treatment inhibited HFD- induced increases renin and AT1R mRNA levels in the kidneys of both Idh2
+/+and Idh2
−/−mice (Fig. 7A to D). These inhibitory e ffects were greater in Idh2
−/−mice than Idh2
+/+mice (Fig. 7A to D). Also, Mito- TEMPO treatment inhibited HFD-induced increases of plasma Ang II and renin concentration in both Idh2
+/+and Idh2
−/−mice, with greater inhibition in Idh2
−/−mice (Fig. 7E and F). These results in- dicate that HFD-induced BP increases are associated with mitochondrial oxidative stress and IDH2 may play a preventive role against HFD-in- duced mitochondrial oxidative stress.
4. Discussion
We demonstrated, for the first time, that 1) prolonged HFD intake impairs IDH2 function and the IDH2-associated mitochondrial anti- oxidant system in the kidney, resulting in increases of mitochondrial ROS levels and oxidative stress; 2) Idh2 gene deletion exacerbates HFD-
induced BP elevation along with augmented mitochondrial oxidative stress, local kidney RAS production, and plasma Ang II and renin con- centrations; and 3) mitochondrial antioxidant treatment mitigates prolonged HFD-induced BP elevation, with a greater mitigation in Idh2 gene-deleted mice relative to wild-type littermates. These findings in- dicate that IDH2 and its related antioxidant system are involved in the development and progression of hypertension, suggesting that IDH2 could be a useful target for the development of effective preventives and therapeutic agents for hypertension.
Under conditions associated with metabolic imbalances, including obesity, mitochondrial ROS levels greatly increase due to excessive mitochondrial ROS formation [15]. As ROS formation overwhelms the ROS eliminating capacity, mitochondrial components including anti- oxidant enzymes are impaired, leading to high levels of ROS production and ROS-induced oxidative stress in mitochondrial components. IDH2 is an essential enzyme for the formation of mitochondrial GSH, as it supplies the NADPH necessary to the process of reducing GSSG to GSH [28,44]. GSH is essential for GPx and the non-enzymatic ROS scaven- ging system in the mitochondria [12]. Furthermore, NADPH produced by IDH2 also plays an important role in the antioxidant function of Trx through the reduction of oxidized thioredoxin [26,28,44,45]. In fact, it has been shown that IDH2 dysfunction and de ficiency increase mi- tochondrial vulnerability to oxidative stress [27,28,32,45]. Several studies have demonstrated that NADPH-linked substrates mitigate oxidative stress in mitochondria [19,46]. In adipose tissue we found that Idh2 gene deletion exacerbates HFD-induced ROS production and oxidative stress along with the decline in NADPH [47]. In the present study, HFD intake led to the diminution of IDH2 function and NADPH levels in the kidney mitochondria of kidney. Although, in the mi- tochondria, NADPH is produced by other sources, such as NNT [19]. In the present study, HFD intake was associated with a significant decline in NADPH in the kidney mitochondria of both Idh2 gene-deleted mice and wild-type mice, with a greater decline in the Idh2 gene deleted mice. Additionally, Idh2 gene deletion without HFD feeding also di- minished NADPH levels in the mitochondria. These results indicate that HFD-induced inhibition of IDH2 function might not be compensated for by other mitochondrial sources, such as NNT and that Idh2 gene dele- tion-induced diminution of NADPH level also could not be compensated
Fig. 5. Effect of Mito-TEMPO treatment on blood pressure after the onset of hypertension in Idh2
+/+and Idh2
−/−mice. Eight-week-old Idh2
+/+and Idh2
−/−male mice were fed low-fat diet (LFD) or high-fat diet (HFD) for 10 weeks. The mice received either Mito-TEMPO (0.7 mg/kg/day) or vehicle (saline) for 10 days from 8 weeks after the initiation of HFD feeding, daily.
Systolic blood pressures were measured as described in the Materials and Methods at the indicated time points. Statistical analysis was performed by three-way ANOVA with repeated measures. Results are expressed as the mean ± standard deviation (n = 10 –15). LFD, low-fat diet; HFD, high-fat diet.
*, p < 0.05 vs. respective HFD vehicle; †, p < 0.05 vs. Idh2
+/+HFD vehicle.
for by the NADPH produced by other enzymes. Furthermore, cytosolic NADPH does not shuttle between the mitochondria and the cytosol [19,20]. Therefore, the HFD-induced decline in mitochondrial NADPH may be directly associated with IDH2 function, suggesting that IDH2 is a critical enzyme for the maintenance of mitochondrial NADPH levels and redox balance during periods of prolonged HFD consumption.
Supporting this, Ogura et al. recently reported that high glucose levels in cultured proximal tubular cells inhibit IDH2 activity, leading to de- creased NADPH levels and increased GSSG to GSH ratios in mi- tochondria [48]. In contrast, Someya et al. reported that, in ear cells, caloric restriction lessens oxidative stress through increases of IDH2 activity, leading to increased NADPH levels and an increased ratio of GSH to GSSG [49]. Recently, Wang et al. reported that the renal mi- tochondria of rats with diabetes mellitus, contained high levels of acetylated IDH2 relative to the mitochondria of rat without diabetes mellitus, and this increase in acetylated IDH2 decreased IDH2 function in the kidney mitochondria [50]. Additionally, the normalization of acetylated IDH2 ameliorated oxidative stress on the kidneys and obe- sity-induced kidney damage [50]. In the brown adipose tissue, we also found that Idh2 gene deletion exacerbates HFD-induced lysine acet- ylation, and that this acetylation is inhibited by antioxidant treatment [47]. In the present study, although we do not exactly elucidate how prolonged consumption of an HFD impairs IDH2 function, our data clearly indicate that high-fat intake induces an IDH2 functional defect.
Additionally, IDH2 is required to cope with ROS overproduction. These results suggest that prolonged high-fat intake disrupts mitochondrial IDH2 function, and this diminished IDH2 function is implicated in the development of hypertension via the increase of mitochondrial oxida- tive stress.
HFD-induced BP elevations are associated with the disruption of redox balance [6]. There is evidence that antioxidant supplements, such as Cu/Zn-SOD protein, or inhibitors of ROS-producing enzymes, such as NADPH oxidase and xanthine oxidase, lower BP, whereas pro-oxidant supplements raise BP [7,51–53]. In the present study, we observed that HFD feeding impaired IDH2 function and increased mitochondrial ROS levels and oxidative stress, resulting in disrupted mitochondrial
dynamics and mitochondrial damage in kidney proximal tubule cells.
Moreover, Idh2 gene deletion exacerbated this HFD-induced mi- tochondrial damage. These results indicate that IDH2 is a critical en- zyme for the maintenance of mitochondrial homeostasis via redox balance regulation and that HFD feeding induced BP elevation is, at least partly, mediated by diminished IDH2 function and the subsequent loss of mitochondrial homeostasis. Supporting this, supplementation with the mitochondrial antioxidant, Mito-TEMPO, significantly in- hibited HFD-induced BP elevations and mitochondrial oxidative stress in both Idh2
−/−and Idh2
+/+mice, with greater inhibition in the Idh2
−/−mice. Studies have demonstrated that HFD consumption in- duces mitochondrial fission [ 54]. Conversely, nutrient depletion acti- vates mitochondria fusion [55]. In the present study, HFD feeding in- creased mitochondrial fission, and this fission was greater in Idh2
−/−mice than Idh2
+/+mice, suggesting that IDH2 protects mitochondria against HFD-induced mitochondrial fission.
The local and circulating RAS components have been well re- cognized as the most important vasoactive hormonal factors for BP regulation and hypertension onset. Additionally, RAS activation has been widely accepted as an important contributor to mitochondrial ROS formation and oxidative stress [56–58]. Recent studies have demon- strated that increased ROS production and mitochondrial oxidative stress caused by excessive weight gain activate the RAS [57,58]. Hsieh et al. reported that H
2O
2stimulates AGT mRNA expression in kidney proximal tubule cells, whereas treatment with MnSOD mimetic inhibits AGT mRNA expression [40]. Abdo et al. reported that catalase over- expression reduces AGT expression in kidney tubule cells [59]. In line with those findings, in the present study, we found that HFD-feeding increased renin and Ang II concentrations in the blood and renin and AT1R mRNA levels in the kidneys, and that these increases were larger in Idh2
−/−mice than in Idh2
+/+mice. These results show that Idh2 de ficiency enhances systemic and renal RAS system activation after HFD. We also found that mitochondrial antioxidant treatment inhibited the HFD-induced changes in both Idh2
−/−and Idh2
+/+mice, with a greater inhibitory e ffect in the Idh2
−/−mice. These data indicate that mitochondria-generated ROS and oxidative stress activates the renal RAS and that this activation may elevate BP.
Recently we observed that IDH2 de ficiency decreased nitric oxide concentration in endothelial cells and impaired endothelium-dependent vaso-relaxation through increased mitochondrial oxidative stress; we also observed that changes were prevented by Mito-TEMPO [25]. Ad- ditionally, we found that IDH2 de ficiency in mice caused cardiac hy- pertrophy through increased mitochondrial oxidative stress [27]. These results suggest that HFD feeding-induced hypertension could be asso- ciated with vascular dysfunction and cardiac hypertrophy. Taken to- gether, our data clearly show that IDH2 is a critical enzyme for the maintenance of mitochondrial redox balance in obesity, and that pro- longed high-fat intake impairs the IDH2-NADPH-GSH antioxidant system, resulting in mitochondrial oxidative damage, while the pre- vention of mitochondrial oxidative damage attenuated obesity-induced BP elevation. These data indicate that IDH2 may be a useful target protein for the development of e ffective therapeutics for hypertension.
However, further studies are required to determine how prolonged high-fat intake impairs the IDH2-NADPH-GSH antioxidant system. To our knowledge, this is the first report demonstrating how prolonged high-fat intake impairs IDH2 function and subsequently leads to mi- tochondrial dysfunction.
Source of funding
This research was supported by the Korea Health Technology R&D Project through the Korea Health Industry Development Institute (KHIDI) funded by the Ministry of Health & Welfare (grant number:
HI15C0001), and National Research Foundation of Korea (NRF) Grant (NRF-2017R1A2A2A05069707) funded by the Korean government (MIST).
Fig. 6. E ffect of Mito-TEMPO treatment on hydrogen peroxide level in the kidney after high-fat diet feeding. Eight-week-old Idh2
+/+and Idh2
−/−male mice were fed low-fat diet (LFD) or high-fat diet (HFD) for 10 weeks. The
mice received either Mito-TEMPO (0.7 mg/kg/day) or vehicle (saline) for 10
days from 8 weeks after the initiation of HFD feeding, daily. H
2O
2levels were
measured in the mitochondrial fractions from kidney tissues of Idh2
+/+and
Idh2
−/−LFD or HFD-fed mice. Mitochondrial fractionations were con firmed by
Western blot analysis using an anti-COX-IV antibody. Results are expressed as
the mean ± standard deviation (n = 6). LFD, low-fat diet; HFD, high-fat diet.
Declaration of competing interest
The authors declare that they have no known competing financial interests or personal relationships that could have appeared to influ- ence the work reported in this paper.
Appendix A. Supplementary data
Supplementary data to this article can be found online at https://
doi.org/10.1016/j.redox.2020.101548.
References
[1] J.R. Petrie, T.J. Guzik, R.M. Touyz, Diabetes, hypertension, and cardiovascular disease: clinical insights and vascular mechanisms, Can. J. Cardiol. 34 (5) (2018) 575–584.
[2] A. Baradaran, H. Nasri, M. Rafieian-Kopaei, Oxidative stress and hypertension:
possibility of hypertension therapy with antioxidants, J. Res. Med. Sci. 19 (4) (2014) 358–367.
[3] S.I. Dikalov, Z. Ungvari, Role of mitochondrial oxidative stress in hypertension, Am.
J. Physiol. Heart Circ. Physiol. 305 (10) (2013) H1417–H1427.
[4] R.M. Touyz, Reactive oxygen species, vascular oxidative stress, and redox signaling in hypertension: what is the clinical significance? Hypertension 44 (3) (2004) 248–252.
[5] R. Rodrigo, J. Gonzalez, F. Paoletto, The role of oxidative stress in the
Fig. 7. E ffect of Mito-TEMPO treatment on RAS component mRNA expression after high-fat diet feeding. Eight-week-old Idh2
+/+and Idh2
−/−male mice
were fed low-fat diet (LFD) or high-fat diet (HFD) for 10 weeks. The mice received either Mito-TEMPO (0.7 mg/kg/day) or vehicle (saline) for 10 days from 8 weeks
after the initiation of HFD feeding, daily. mRNAs were extracted from kidney tissues using RNA extraction solution as described in the Materials and Methods. The
mRNA levels of renin (A), angiotensin II type 1 receptor (AT1R) (B), angiotensinogen (AGT, C) and angiotensin converting enzyme (ACE, D) were measured in the
kidneys. mRNA levels were normalized by 18S rRNA levels. Plasma concentrations of angiotensin II (Ang II, E) and renin (F) were determined. Results are expressed
as the mean ± standard deviation (n = 6). LFD, low-fat diet; HFD, high-fat diet.
pathophysiology of hypertension, Hypertens. Res. 34 (4) (2011) 431–440.
[6] V. Lahera, N. de Las Heras, A. Lopez-Farre, W. Manucha, L. Ferder, Role of mi- tochondrial dysfunction in hypertension and obesity, Curr. Hypertens. Rep. 19 (2) (2017) 11.
[7] A.E. Dikalova, A.T. Bikineyeva, K. Budzyn, R.R. Nazarewicz, L. McCann, W. Lewis, D.G. Harrison, S.I. Dikalov, Therapeutic targeting of mitochondrial superoxide in hypertension, Circ. Res. 107 (1) (2010) 106–116.
[8] A.C. Montezano, R.M. Touyz, Reactive oxygen species, vascular Noxs, and hy- pertension: focus on translational and clinical research, Antioxidants Redox Signal.
20 (1) (2014) 164–182.
[9] S.I. Dikalov, A.E. Dikalova, Contribution of mitochondrial oxidative stress to hy- pertension, Curr. Opin. Nephrol. Hypertens. 25 (2) (2016) 73–80.
[10] L.J. Stallons, J.A. Funk, R.G. Schnellmann, Mitochondrial homeostasis in acute organ failure, Curr Pathobiol Rep 1 (3) (2013).
[11] E. Birben, U.M. Sahiner, C. Sackesen, S. Erzurum, O. Kalayci, Oxidative stress and antioxidant defense, World Allergy Organ J 5 (1) (2012) 9–19.
[12] M. Mari, A. Morales, A. Colell, C. Garcia-Ruiz, J.C. Fernandez-Checa, Mitochondrial glutathione, a key survival antioxidant, Antioxidants Redox Signal. 11 (11) (2009) 2685–2700.
[13] L.C. Tabara, J. Poveda, C. Martin-Cleary, R. Selgas, A. Ortiz, M.D. Sanchez-Nino, Mitochondria-targeted therapies for acute kidney injury, Expet Rev. Mol. Med. 16 (2014) e13.
[14] Y. Yang, H. Liu, F. Liu, Z. Dong, Mitochondrial dysregulation and protection in cisplatin nephrotoxicity, Arch. Toxicol. 88 (6) (2014) 1249–1256.
[15] S. Furukawa, T. Fujita, M. Shimabukuro, M. Iwaki, Y. Yamada, Y. Nakajima, O. Nakayama, M. Makishima, M. Matsuda, I. Shimomura, Increased oxidative stress in obesity and its impact on metabolic syndrome, J. Clin. Invest. 114 (12) (2004) 1752–1761.
[16] I. Leskov, A. Neville, X. Shen, S. Pardue, C.G. Kevil, D.N. Granger, D.M. Krzywanski, Nicotinamide nucleotide transhydrogenase activity impacts mitochondrial redox balance and the development of hypertension in mice, J Am Soc Hypertens 11 (2) (2017) 110–121.
[17] R. Leonardi, C. Subramanian, S. Jackowski, C.O. Rock, Cancer-associated isocitrate dehydrogenase mutations inactivate NADPH-dependent reductive carboxylation, J.
Biol. Chem. 287 (18) (2012) 14615–14620.
[18] S.Y. Park, S.M. Lee, S.W. Shin, J.W. Park, Inactivation of mitochondrial NADP +-dependent isocitrate dehydrogenase by hypochlorous acid, Free Radic. Res. 42 (5) (2008) 467–473.
[19] J. Rydstrom, Mitochondrial NADPH, transhydrogenase and disease, Biochim.
Biophys. Acta 1757 (5–6) (2006) 721–726.
[20] P. Korge, G. Calmettes, J.N. Weiss, Increased reactive oxygen species production during reductive stress: the roles of mitochondrial glutathione and thioredoxin re- ductases, Biochim. Biophys. Acta 1847 (6–7) (2015) 514–525.
[21] K. Smolkova, P. Jezek, The role of mitochondrial NADPH-dependent isocitrate dehydrogenase in cancer cells, Int J Cell Biol 2012 (2012) 273947.
[22] Z.J. Reitman, H. Yan, Isocitrate dehydrogenase 1 and 2 mutations in cancer: al- terations at a crossroads of cellular metabolism, J. Natl. Cancer Inst. 102 (13) (2010) 932–941.
[23] S.H. Jo, M.K. Son, H.J. Koh, S.M. Lee, I.H. Song, Y.O. Kim, Y.S. Lee, K.S. Jeong, W.B. Kim, J.W. Park, B.J. Song, T.L. Huh, Control of mitochondrial redox balance and cellular defense against oxidative damage by mitochondrial NADP+-depen- dent isocitrate dehydrogenase, J. Biol. Chem. 276 (19) (2001) 16168–16176.
[24] J. Kim, J.I. Kim, H.S. Jang, J.W. Park, K.M. Park, Protective role of cytosolic NADP (+)-dependent isocitrate dehydrogenase, IDH1, in ischemic pre-conditioned kidney in mice, Free Radic. Res. 45 (7) (2011) 759–766.
[25] J.B. Park, H. Nagar, S. Choi, S.B. Jung, H.W. Kim, S.K. Kang, J.W. Lee, J.H. Lee, J.W. Park, K. Irani, B.H. Jeon, H.J. Song, C.S. Kim, IDH2 deficiency impairs mi- tochondrial function in endothelial cells and endothelium-dependent vasomotor function, Free Radic. Biol. Med. 94 (2016) 36–46.
[26] J.H. Park, H.J. Ku, J.H. Lee, J.W. Park, Idh2 deficiency exacerbates acrolein-in- duced lung injury through mitochondrial redox environment deterioration, Oxid Med Cell Longev 2017 (2017) 1595103.
[27] H.J. Ku, Y. Ahn, J.H. Lee, K.M. Park, J.W. Park, IDH2 deficiency promotes mi- tochondrial dysfunction and cardiac hypertrophy in mice, Free Radic. Biol. Med. 80 (2015) 84–92.
[28] S.J. Han, H.S. Jang, M.R. Noh, J. Kim, M.J. Kong, J.I. Kim, J.W. Park, K.M. Park, Mitochondrial NADP(+)-Dependent isocitrate dehydrogenase deficiency exacer- bates mitochondrial and cell damage after kidney ischemia-reperfusion injury, J.
Am. Soc. Nephrol. 28 (4) (2017) 1200–1215.
[29] T.A. Kotchen, Obesity-related hypertension: epidemiology, pathophysiology, and clinical management, Am. J. Hypertens. 23 (11) (2010) 1170–1178.
[30] J.E. Hall, E.D. Crook, D.W. Jones, M.R. Wofford, P.M. Dubbert, Mechanisms of obesity-associated cardiovascular and renal disease, Am. J. Med. Sci. 324 (3) (2002) 127–137.
[31] A.D. Dobrian, M.J. Davies, S.D. Schriver, T.J. Lauterio, R.L. Prewitt, Oxidative stress in a rat model of obesity-induced hypertension, Hypertension 37 (2 Pt 2) (2001) 554–560.
[32] S.J. Lee, S.H. Kim, K.M. Park, J.H. Lee, J.W. Park, Increased obesity resistance and insulin sensitivity in mice lacking the isocitrate dehydrogenase 2 gene, Free Radic.
Biol. Med. 99 (2016) 179–188.
[33] W.S. Nam, K.M. Park, J.W. Park, RNA interference targeting cytosolic NADP (+)-dependent isocitrate dehydrogenase exerts anti-obesity effect in vitro and in vivo, Biochim. Biophys. Acta 1822 (8) (2012) 1181–1188.
[34] S. Kim, S.Y. Kim, H.J. Ku, Y.H. Jeon, H.W. Lee, J. Lee, T.K. Kwon, K.M. Park, J.W. Park, Suppression of tumorigenesis in mitochondrial NADP(+)-dependent isocitrate dehydrogenase knock-out mice, Biochim. Biophys. Acta 1842 (2) (2014) 135–143.
[35] M.R. Noh, K.Y. Kim, S.J. Han, J.I. Kim, H.Y. Kim, K.M. Park, Methionine sulfoxide reductase A deficiency exacerbates cisplatin-induced nephrotoxicity via increased mitochondrial damage and renal cell death, Antioxidants Redox Signal. 27 (11) (2017) 727–741.
[36] M.R. Noh, J.I. Kim, S.J. Han, T.J. Lee, K.M. Park, C/EBP homologous protein (CHOP) gene deficiency attenuates renal ischemia/reperfusion injury in mice, Biochim. Biophys. Acta 1852 (9) (2015) 1895–1901.
[37] S.M. Lee, H.J. Koh, D.C. Park, B.J. Song, T.L. Huh, J.W. Park, Cytosolic NADP (+)-dependent isocitrate dehydrogenase status modulates oxidative damage to cells, Free Radic. Biol. Med. 32 (11) (2002) 1185–1196.
[38] J. Kim, Y.M. Seok, K.J. Jung, K.M. Park, Reactive oxygen species/oxidative stress contributes to progression of kidneyfibrosis following transient ischemic injury in mice, Am. J. Physiol. Ren. Physiol. 297 (2) (2009) F461–F470.
[39] K.C. Cheng, D.S. Cahill, H. Kasai, S. Nishimura, L.A. Loeb, 8-Hydroxyguanine, an abundant form of oxidative DNA damage, causes G——T and A——C substitutions, J. Biol. Chem. 267 (1) (1992) 166–172.
[40] T.J. Hsieh, S.L. Zhang, J.G. Filep, S.S. Tang, J.R. Ingelfinger, J.S. Chan, High glucose stimulates angiotensinogen gene expression via reactive oxygen species generation in rat kidney proximal tubular cells, Endocrinology 143 (8) (2002) 2975–2985.
[41] J.F. Giani, K.E. Bernstein, T. Janjulia, J. Han, J.E. Toblli, X.Z. Shen, B. Rodriguez- Iturbe, A.A. McDonough, R.A. Gonzalez-Villalobos, Salt sensitivity in response to renal injury requires renal angiotensin-converting enzyme, Hypertension 66 (3) (2015) 534–542.
[42] H. Kobori, L.M. Harrison-Bernard, L.G. Navar, Urinary excretion of angiotensinogen reflects intrarenal angiotensinogen production, Kidney Int. 61 (2) (2002) 579–585.
[43] F. Alhenc-Gelas, T. Baussant, C. Hubert, F. Soubrier, P. Corvol, The angiotensin converting enzyme in the kidney, J. Hypertens. Suppl. 7 (7) (1989) S9-13;discus- sion S4.
[44] T. Nakamura, H. Nakamura, T. Hoshino, S. Ueda, H. Wada, J. Yodoi, Redox reg- ulation of lung inflammation by thioredoxin, Antioxidants Redox Signal. 7 (1–2) (2005) 60–71.
[45] H. Kim, J.H. Lee, J.W. Park, IDH2 deficiency exacerbates acetaminophen hepato- toxicity in mice via mitochondrial dysfunction-induced apoptosis, Biochim.
Biophys. Acta (BBA) - Mol. Basis Dis. 1865 (9) (2019) 2333–2341.
[46] G. Bellomo, A. Martino, P. Richelmi, G.A. Moore, S.A. Jewell, S. Orrenius, Pyridine- nucleotide oxidation, Ca2+ cycling and membrane damage during tert-butyl hy- droperoxide metabolism by rat-liver mitochondria, Eur. J. Biochem. 140 (1) (1984) 1–6.
[47] J.H. Lee, Y. Go, D.Y. Kim, S.H. Lee, O.H. Kim, Y.H. Jeon, T.K. Kwon, J.H. Bae, D.K. Song, I.J. Rhyu, I.K. Lee, M. Shong, B.C. Oh, C. Petucci, J.W. Park, T.F. Osborne, S.S. Im, Isocitrate dehydrogenase 2 protects mice from high-fat diet- induced metabolic stress by limiting oxidative damage to the mitochondria from brown adipose tissue, Exp. Mol. Med. 52 (2020) 238–252.
[48] Y. Ogura, M. Kitada, I. Monno, K. Kanasaki, A. Watanabe, D. Koya, Renal mi- tochondrial oxidative stress is enhanced by the reduction of Sirt3 activity, in Zucker diabetic fatty rats, Redox Rep. 23 (1) (2018) 153–159.
[49] S. Someya, W. Yu, W.C. Hallows, J. Xu, J.M. Vann, C. Leeuwenburgh, M. Tanokura, J.M. Denu, T.A. Prolla, Sirt3 mediates reduction of oxidative damage and preven- tion of age-related hearing loss under caloric restriction, Cell 143 (5) (2010) 802–812.
[50] X.X. Wang, M.H. Edelstein, U. Gafter, L. Qiu, Y. Luo, E. Dobrinskikh, S. Lucia, L. Adorini, V.D. D'Agati, J. Levi, A. Rosenberg, J.B. Kopp, D.R. Gius, M.A. Saleem, M. Levi, G, Protein-coupled bile acid receptor TGR5 activation inhibits kidney disease in obesity and diabetes, J. Am. Soc. Nephrol. 27 (5) (2016) 1362–1378.
[51] S.I. Dikalov, R.R. Nazarewicz, A. Bikineyeva, L. Hilenski, B. Lassegue, K.K. Griendling, D.G. Harrison, A.E. Dikalova, Nox2-induced production of mi- tochondrial superoxide in angiotensin II-mediated endothelial oxidative stress and hypertension, Antioxidants Redox Signal. 20 (2) (2014) 281–294.
[52] B. Rodriguez-Iturbe, L. Sepassi, Y. Quiroz, Z. Ni, D.C. Wallace, N.D. Vaziri, Association of mitochondrial SOD deficiency with salt-sensitive hypertension and accelerated renal senescence, J. Appl. Physiol. 102 (1) (2007) 255–260.
[53] D.F. Dai, S.C. Johnson, J.J. Villarin, M.T. Chin, M. Nieves-Cintron, T. Chen, D.J. Marcinek, G.W. Dorn 2nd, Y.J. Kang, T.A. Prolla, L.F. Santana,
P.S. Rabinovitch, Mitochondrial oxidative stress mediates angiotensin II-induced cardiac hypertrophy and Galphaq overexpression-induced heart failure, Circ. Res.
108 (7) (2011) 837–846.
[54] X.X. Wang, D. Wang, Y. Luo, K. Myakala, E. Dobrinskikh, A.Z. Rosenberg, J. Levi, J.B. Kopp, A. Field, A. Hill, S. Lucia, L. Qiu, T. Jiang, Y. Peng, D. Orlicky, G. Garcia, M. Herman-Edelstein, V. D'Agati, K. Henriksen, L. Adorini, M. Pruzanski, C. Xie, K.W. Krausz, F.J. Gonzalez, S. Ranjit, A. Dvornikov, E. Gratton, M. Levi, FXR/TGR5 dual agonist prevents progression of nephropathy in diabetes and obesity, J. Am.
Soc. Nephrol. 29 (1) (2018) 118–137.
[55] M. Liesa, O.S. Shirihai, Mitochondrial dynamics in the regulation of nutrient utili- zation and energy expenditure, Cell Metabol. 17 (4) (2013) 491–506.
[56] S.I. Dikalov, R.R. Nazarewicz, Angiotensin II-induced production of mitochondrial reactive oxygen species: potential mechanisms and relevance for cardiovascular disease, Antioxidants Redox Signal. 19 (10) (2013) 1085–1094.
[57] M. Araujo, C.S. Wilcox, Oxidative stress in hypertension: role of the kidney, Antioxidants Redox Signal. 20 (1) (2014) 74–101.
[58] H. Kobori, A. Nishiyama, Effects of tempol on renal angiotensinogen production in Dahl salt-sensitive rats, Biochem. Biophys. Res. Commun. 315 (3) (2004) 746–750.
[59] S. Abdo, Y. Shi, A. Otoukesh, A. Ghosh, C.S. Lo, I. Chenier, J.G. Filep, J.R. Ingelfinger, S.L. Zhang, J.S. Chan, Catalase overexpression prevents nuclear factor erythroid 2-related factor 2 stimulation of renal angiotensinogen gene ex- pression, hypertension, and kidney injury in diabetic mice, Diabetes 63 (10) (2014) 3483–3496.