• 검색 결과가 없습니다.

Genetic Parameters for Growth-Related Traits in Korean Native Chicken

N/A
N/A
Protected

Academic year: 2021

Share "Genetic Parameters for Growth-Related Traits in Korean Native Chicken"

Copied!
5
0
0

로드 중.... (전체 텍스트 보기)

전체 글

(1)

Genetic Parameters for Growth-Related Traits in Korean Native Chicken

Muhammad Cahyadi

, Hee-Bok Park

, Dong-Won Seo

2

, Shil Jin

2

, Nuri Choi

2

, Kang-Nyeong Heo

3

, Bo-Seok Kang

3

, Cheorun Jo

4

and Jun-Heon Lee

2†

1

Dept. of Animal Science, Faculty of Agriculture, Sebelas Maret University, Surakarta 57126, Indonesia

2

Division of Animal and Dairy Science, Chungnam National University, Daejeon 305-764, Korea

3

Poultry Science Division, National Institute of Animal Science, RDA, Cheonan 331-801, Korea

4

Dept. of Agricultural Biotechnology and Research Institute of Agriculture and Life Science, Seoul National University, Seoul 151-921, Korea

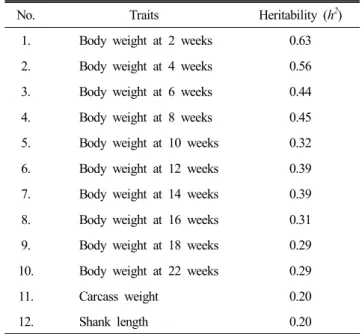
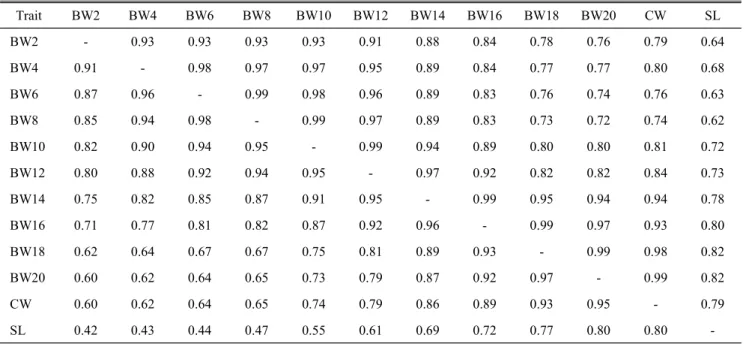
ABSTRACT Body and carcass weights are always being main focus in poultry industry. The aim of current study was to estimate the heritability, genetic and phenotypic correlations of growth-related traits in Korean native chicken. A total of 596 chickens representing five lines of Korean native chicken (Black, Gray-Brown, Red-Brown, White, and Yellow-Brown) were reared under the standard breeding procedures in the National Institute of Animal Science (NIAS), Korea. Their body weights were observed every two weeks from hatched to 20 weeks of age. In addition, shank length and carcass weight were also measured before and after slaughter, respectively. The ASReml-R program was used to compute genetic parameters. The body weight traits were moderate to high heritability values (ranged 0.29 ∼0.63). The heritablilites of carcass weight (h

2

=0.20) and shank length (h

2

=0.20) were categorized as moderate. Moreover, both genetic and phenotypic correlations were ranged form 0.62 to 0.99 and ranged from 0.42 to 0.98, respectively. These findings can be useful information for quantitative genetic studies and breeding plan of Korean native chicken.

(Key words: genetic parameters, growth-related trait, Korean native chicken)

§

These authors equally contributed to this work. Hence, they should be regarded as co-first authors.

To whom correspondence should be addressed : [email protected]

INTRODUCTION

Due to the recent development of both broiler and layer industries are going rapidly, the many breeds of indigenous chicken are endangered or extinct. In Korea, there are some indigenous chicken breeds which are known as Korean native chicken (KNC). As a genetic resource, KNC has been started to be conserved in 1992 by collecting the native chickens from rural areas. In 1994, Korean Society of Poultry Science formally established the conservation project of these animals entitled “Restoration of Korean native chicken”. Since then, National Institute of Animal Science (NIAS) intensively took over the breeding system by selecting the birds based on eco- nomically important quantitative traits such as growth-related traits. Nowadays, five lines of KNC are established and widely known in Korea. They are separated into five lines on the basis of plumage colors, representing black, gray, red, yellow, and white lines. One of commercial KNC which is launched

to the consumer is Woorimatdag chicken. In spite of slow growth rate, this chicken is preferred by the consumers due to its unique taste and meat quality than commercial broiler even though its price is more expensive (Lee et al., 2011).

However, the lack of uniformity in phenotypic performances of growth-related traits and canibalism among them, are important issues in development of native chicken breed over the world. Therefore, appropriate breeding strategy is absolu- tely required to improve the performances of native chicken.

The first step for developing meat-type native chicken breed

is the selection of growth performance traits, for example body

weight, carcass weight, shank length etc. These traits can be

used to estimate genetic and phenotypic correlations, and also

heritability. Reliable estimations of the genetic paprameters

are critical to choose the optimal breeding program among

various breeding plans and to predict breeding values of can-

didates for selection (Gjerde and Schaeffer, 1989). In addition,

Le Bihan-Duval et al. (1998) reported that high heritabilities

(2)

of body weight and body composition traits have been ob- served in chicken, and the selection pressure of these traits has largely contributed in improving production traits of meat- type chicken. However, the estimation of genetic parameters for growth related traits has not been done extensively (Sang et al., 2006). The present study was conducted to estimate genetic parameters of growth relaed-traits in KNC.

MATERIALS AND METHODS

1. Animal and Phenotype

A within line crossing designe was applied in this study.

Particularly, a total of 88 parents (P) which is consisting 15 sires and 73 dams of five Korean native chicken lines was intercrossed to generate 596 offsprings (F

1

). Then, these off- spring were divided into five lines based on plum age colors consisting of black (90), gray-brown (110), red-brown (135), white (126), and yellow-brown (135) lines. And the F

1

offspring represented 68 full-sib families. We divided the experimental population into two batches. These birds in each batches were maintained under the standard breeding procedures for 22 weeks in the NIAS, Korea. All samples used in this experi- ment were reared under the same environment condition and feeding system. The body weight traits were measured every two weeks started from hatch until slaughter age at 22 weeks of age, and carcass weight was also weighed. Then, these data were used to describe the current status of both body and carcass weight traits in Korean native chicken, to figure out growth curves and other further analyses.

2. Statistical Analysis

Initially, the descriptive statistics were obtained from a general linear model (GLM) using Minitab version 14.0 (Mi- nitab ZInc., USA) whether these data can be used for further analysis. The outlier data were detected and removed to im- prove the quality of the data, and the test for the normality of the distribution of observed traits was also carried out by the Ryan-Joiner method implemented in Minitab version 14.0 (Minitab Inc., USA). Heritability values of each trait were esti- mated with the following mixed-effects model using ASReml- R program (Gilmour et al., 1995):

y = Xb + Zu + e

where, y is a vector of the phenotypic values for body weight traits and carcass weight; b is a vector of fixed effects including sex, batch, line; u is a vector of additive polygenic effects; e is a vector of residual environmental effects; X, Z are incidence matrices for b and u respectively. The mean and variance for the residual environmental effect of indivi- duals were assumed to be: e~N(0, Iσ

e2

), where I is the identity matrix and σ

e2

is the residual variance. The mean and vari- ance for additive polygenic effects can be defined as: u~N(0,

a2

), where A is the additive genetic relationship matrix computed from the F

1

pedigree in this study and σ

a2

is the additive polygenic variance.

Additionally, correlations (r

xy

) were estimated by:



    

  

where, r

xy

is the estimate of the genetic and phenotypic correlation; Cov(x, y) is the genetic and phenotypic covari- ance between a pair of traits x and y, and var(x) and var(y) are estimated genetic or phenotypic variances of traits x and y, respectively, using Minitab (Minitab, USA) for phenotypic correlation and ASReml-R for genetic correlation.

RESULTS AND DISCUSSION

1. Descriptive Analysis

An analyses of descriptive statistics for body and carcass weight traits tested in this study was presented in Table 1.

The evaluation of normality was also performed to check

weather the data can be used for further analyses. The method

assesses normality by calculating the correlation between the

observed data and expected data computed from the data with

a normality assumption. Normality was accepted if the corre-

lation coefficient is close to 1 (Shapiro and Wilk, 1965). The

results showed that all traits observed followed normal distri-

bution. The coefficient of correlation was ranged from 0.98

to 0.99 in all traits, and this value was higher when the test

of normality distinguished by sex. These normality evaluation

(3)

Table 1. Descriptive statistics of growth-related traits in Korean native chicken

Trait Mean SD Minimum Maximum

BW2 (g) 143.89 24.71 78.00 208.00

BW4 (g) 265.92 70.47 100.00 455.00

BW6 (g) 426.84 130.96 155.00 715.00

BW8 (g) 607.66 195.47 150.00 1,030.00

BW10 (g) 768.27 222.64 250.00 1,305.00

BW12 (g) 992.90 278.1 365.00 1,670.00

BW14 (g) 1,181.00 297.6 450.00 1,920.00 BW16 (g) 1,383.10 337.2 470.00 2,155.00 BW18 (g) 1,587.70 347.1 555.00 2,430.00 BW20 (g) 1,780.90 372.1 625.00 2,675.00

CW (g) 999.32 240.06 340.00 1,688.00

SL (mm) 77.81 9.19 52.09 101.92

Abbreviation: BW2 is body weight at 2 weeks; BW4 is body weight at 4 weeks; BW6 is body weight at 6 weeks; BW8 is body weight at 8 weeks; BW10 is body weight at 10 weeks; BW12 is body weight at 12 weeks; BW14 is body weight at 14 weeks;

BW16 is body weight at 16 weeks; BW18 is body weight at 18 weeks; BW20 is body weight at 20 weeks; SW is sughter weight;

CW is carcass weight; and SL is shank length.

emphasized that the data collected in present study was fairly representative of the Korean native chicken population and can be utilized for the breeding and genetic experiments.

2. Estimation of Genetic Parameters for Growth- related Traits

Heritability is the proportion of variance in a particular trait, in a particular population, that is due to genetic factors, as opposed to environmental influences (Falconer and Mackay, 1996). The heritability estimates for body weights, carcass weight, and shank length in Korean native chicken are pre- sented in Table 2. Preston and Willis (1974) reported that heritability was regarded as small (low) if the value of heri- tability was varied from 0 to 0.2; moderate heritability was 0.2 to 0.4; and if the value was more than 0.4 classified as high heritability. The heritabilities of body weight traits were estimated as moderate to high in Korean native chicken. The heritability estimates (h

2

) for body weight traits were ranged

Table 2. Heritability of growth-related traits

No. Traits Heritability (h

2

)

1. Body weight at 2 weeks 0.63 2. Body weight at 4 weeks 0.56 3. Body weight at 6 weeks 0.44 4. Body weight at 8 weeks 0.45 5. Body weight at 10 weeks 0.32 6. Body weight at 12 weeks 0.39 7. Body weight at 14 weeks 0.39 8. Body weight at 16 weeks 0.31 9. Body weight at 18 weeks 0.29 10. Body weight at 22 weeks 0.29

11. Carcass weight 0.20

12. Shank length 0.20

from 0.29 to 0.63. The h

2

for carcass weight was 0.20 (mode- rate), and the h

2

for shank length was also 0.20 (moderate).

The high heritability values of body weight traits, and mo- derate heritability values of carcass weight and shank length have been found in five lines of Korean native chicken population. These findings were quit similar with some other native chicken breeds that reported the heritability values of body weights ranged from 0.24 to 0.47 in Mazandaran native chicken, varied form 0.23 to 0.55 in Iranian native fowls, ranged from 0.15 to 0.40 in Horro chicken of Ethiopia, and around 0.3 to 0.5 in slow-growing lines chicken in France (Chabault et al., 2012; Dana et al., 2011; Ghazikhani Shad et al., 2007; Niknafs et al., 2012).

In term case of carcass weight, the heritability of carcass weight in KNC was categorized as low to moderate (h

2

=0.20).

This result indicated that carcass weight of Korean native chicken was more affected by environment factors even though genetic factor accounted for took part as 20%. Regarding the heritability of shank length of KNC, moderate heritability (h

2

=0.20) was found. Previous study reported that heritability of shank length in random mating Broiler population was 0.35 (Gonzalez-Ceron et al., 2015). This different result may be due to different breed using in each experiment.

The genetic and phenotypic correlations between observed

traits were ranged from 0.62 to 0.99 and 0.42 to 0.98, res-

(4)

Table 3. Genetic and phenotypic correlations between growth-related traits

Trait BW2 BW4 BW6 BW8 BW10 BW12 BW14 BW16 BW18 BW20 CW SL

BW2 - 0.93 0.93 0.93 0.93 0.91 0.88 0.84 0.78 0.76 0.79 0.64

BW4 0.91 - 0.98 0.97 0.97 0.95 0.89 0.84 0.77 0.77 0.80 0.68

BW6 0.87 0.96 - 0.99 0.98 0.96 0.89 0.83 0.76 0.74 0.76 0.63

BW8 0.85 0.94 0.98 - 0.99 0.97 0.89 0.83 0.73 0.72 0.74 0.62

BW10 0.82 0.90 0.94 0.95 - 0.99 0.94 0.89 0.80 0.80 0.81 0.72

BW12 0.80 0.88 0.92 0.94 0.95 - 0.97 0.92 0.82 0.82 0.84 0.73

BW14 0.75 0.82 0.85 0.87 0.91 0.95 - 0.99 0.95 0.94 0.94 0.78

BW16 0.71 0.77 0.81 0.82 0.87 0.92 0.96 - 0.99 0.97 0.93 0.80

BW18 0.62 0.64 0.67 0.67 0.75 0.81 0.89 0.93 - 0.99 0.98 0.82

BW20 0.60 0.62 0.64 0.65 0.73 0.79 0.87 0.92 0.97 - 0.99 0.82

CW 0.60 0.62 0.64 0.65 0.74 0.79 0.86 0.89 0.93 0.95 - 0.79

SL 0.42 0.43 0.44 0.47 0.55 0.61 0.69 0.72 0.77 0.80 0.80 -

Genetic correlations are above the diagonal and phenotypic correlations are below the diagonal.

pectively. The phenotypic and genetic correlations were gra- dually decreased between body weight traits whereas pheno- typic and genetic correlations between carcass weight and body weight traits were gradually increased. Genetic and pheno- typic correlations between shank length and body weight traits were varied from 0.62 to 0.82 and ranged from 0.42 to 0.77, respectively (Table 3). Previous findings reported that genetic correlation between shank length and body weight traits was varied from 0.40 to 0.64 while and phenotypic correlation between shank length and body weight traits was varied from 0.43 to 0.77 in broiler and layer populations (Gonzalez-Ceron et al., 2015; Tierce and Nordskog, 1985).

Since moderate to high heritability and genetic parameters were estimated, selection pressure for growth-related traits will be effective to improve KNC performances, especially for body weight, carcass weight and shank length. From this KNC population, expected genetic gains (ΔG) for body weight at 20 weeks, which is related with market age of KNC (Table 1, 2), were estimated given individual selection scheme (Table 4). Changing selection intensity is one of the major methods to manipulate the ΔG given a certain selection scheme like individual selection. Increased selection intensity can be achie- ved by reduced proportion of animals for breeding. Given a

Table 4. Expected genetic gain for BW20 estimated based on individual selection scheme

Selection rate

Selection intensity (i)

Phenotype SD (σ

p

)

Heritablity (h

2

)

Expected genetic gain

(ΔG)

0.50 0.798 272.1 0.29 86.1

0.10 1.755 372.1 0.29 189.4

0.05 2.063 372.1 0.29 222.6

0.01 2.665 372.1 0.29 287.6

ΔG = iσ

p

h

2

.

period of time, changes in the selection intensities from 0.798 to 2.665 resulted in obvious ΔG changes (i.e., 86.1 ∼287.6).

However, application of strong selection intensity likely results in increase of inbreeding levels in the population. Therefore, selection intensity level should be chosen after full examina- tions of impact on both genetic gain and inbreeding.

In conclusion, heritability estimates of body weight traits,

carcass weight, and shank length were moderate to high. Ge-

netic and phenotypic correlations were also high between

observed traits. These results can be useful as a consideration

for selective breeding strategy to improve of growth-realated

(5)

traits in Korean native chicken.

ACKNOWLEDGEMENTS

This study was supported by grants from the Golden Seed Project (No. PJ009925032015), Korea Institute of Planning &

Evaluation for Technology in Food, Agriculture Forestry &

Fisheries), Republic of Korea.

REFERENCES

Chabault M, Baeza E, Gigaud V, Chartrin P, Chapuis H, Boulay M, Arnould C, D'Abbadie F, Berri C, Le Bihan- Duval E 2012 Analysis of a slow-growing line reveals wide genetic variability of carcass and meat quality-related traits. BMC Genet 13:90-100.

Dana N, Vander Waaij EH, van Arendonk JA 2011 Genetic and phenotypic parameter estimates for body weights and egg production in Horro chicken of Ethiopia. Trop Anim Health and Prod 43:21-28.

Falconer DS, Mackay TFC 1996 Introduction to Quantitative Genetics. 4th ed. Longman Group Ltd. Essex. UK.

Ghazikhani SA, Nejati JA, Mehrabani YH 2007 Animal mo- del estimation of genetic parameters for most important economic traits in Iranian native fowls. Pakistan J Biol Sci 10:2787-2789.

Gilmour AR, Thompson R, Cullis BR 1995 Average informa- tion REML: An efficient algorithm for variance parameter estimation in linear mixed models. Biometrics 51:1440-1450.

Gjerde B, Schaeffer LR 1989 Body traits in rainbow trout II Estimates of heritabilities and of phenotypic and genetic

correlations. Aquaculture 80:25-44.

González-Cerón F, Rekaya R, Aggrey SE 2015 Genetic analy- sis of bone quality traits and growth in a random mating broiler population. Poult Sci 94:883-889.

Le Bihan-Duval E, Mignon-Grasteau S, Millet N, Beaumont C 1998 Genetic analysis of a selection experiment on in- creased body weight and breast muscle weight as well as on limited abdominal fat weight. Br Poult Sci 39:346-353.

Lee KH, Jung Y, Jung S, Lee JH, Heo KN, Jo C 2011 Phy- siochemical characteristics of the meat from Korean native chicken and broiler reared and slaughtered as the same conditions. Korean J Poult Sci 38:225-230.

Niknafs S, Nejati-Javaremi A, Mehrabani-Yeganeh H, Fatemi SA 2012 Estimation of genetic parameters for body weight and egg production traits in Mazandaran native chicken.

Trop Anim Health Prod 44:1437-1443.

Preston TR, Willis MB 1974 Intensive Beef Production. 2nd ed. Pergamon Press, Oxford. UK.

Sang BD, Kong HS, Kim HK, Choi CH, Kim SD, Cho YM, Sang BC, Lee JH, Jeon GJ, Lee HK 2006 Estimation of genetic parameters for economic traits in Korean native chickens. Asian-Aust J of Anim Sci 19:319-323.

Shapiro SS, Wilk MB 1965 An Analysis of variance test for normality (complete samples). Biometrika 52:591-611.

Tierce JF, Nordskog AW 1985 Performance of layer-type chi- ckens as related to body conformation and composition. 1.

A static analysis of shank length and body weight at 20 weeks of age. Poult Sci 64:605-609.

Received Aug. 31, 2015, Revised Oct. 20, 2015, Accepted

Nov. 20, 2015

수치

Table  1.  Descriptive  statistics  of  growth-related  traits  in  Korean  native  chicken
Table  4.  Expected  genetic  gain  for  BW20  estimated  based  on  individual  selection  scheme

참조

관련 문서

1 John Owen, Justification by Faith Alone, in The Works of John Owen, ed. John Bolt, trans. Scott Clark, "Do This and Live: Christ's Active Obedience as the

Days to emergence and heading, duration of growth, leaf traits and stem diameter of sweet sorghum as affected by soils. Soil type Days

In the change in body composition, body weight did not show a statistically significant change in all items in the exercise group and the control group,

Fourth, for the sub-factors of personality traits according to weight lifters’ education, while there was a high difference in neuroticism and agreeableness

: A structural steel bulk weight factor of 47% of total topsides weight (i.e. equipment + bulks + structural) has been used for integrated deck areas, and : 50% of total

Where FPSO substructure costs have been estimated, these have been based on the lightship weight determined and using the same cost basis as the FSO hull. Costs for swivel,

- Definition : Finding the conditions that give max. values of a function - Target : Selecting which criterion is to be optimized ex) size, weight, cost - Components

Analysis of body characteristics on olive flounder ( Paralichthys oilvaceus ) fed on the extruded and moist pellets (body weight, body length, body height and body width) · ·