I. Introduction
Public and professionals concern over patient safety, adverse healthcare events, and medical errors have been increasing since before the beginning of the new millennium. Lucian Leape, Don Berwick, and others had pioneered research on this field since the 1990s [1] and claimed that if medical er- rors can be prevented or reduced, enormous life and cost savings could be obtained. There are many ways to improve patient safety using information technology [2], and one of the primary ways for improving safety is improving the error and adverse event detection and reporting systems. Non-pu- nitive adverse event reporting system must be implemented in order to enhance the safety initiatives, the awareness and proactive participation from the members of the community, and the overall quality of healthcare. Although some adverse
Status and Problems of Adverse Event Reporting Systems in Korean Hospitals
Jeongeun Kim, RN, PhD1,2, Sukwha Kim, MD, PhD3, Yoenyi Jung, RN, PhD4, Eun-Kyung Kim, RN, PhD5
1College of Nursing, Seoul National University; 2Research Institute of Nursing Science, Seoul National University; 3College of Medicine, Seoul National Uni- versity; 4Department of Customer Satisfaction, Samsung Medical Center, Seoul; 5Department of Nursing, Mokpo National University, Muan, Korea
Objectives: This study identifies the current status and problems of adverse event reporting system in Korean hospitals. The data obtained from this study will be used to raise international awareness and enable collaborative researches on patient safety. Methods: We distributed the questionnaire developed by the Agency for Healthcare Research and Quality (AHRQ), USA to the 265 risk managers of hospitals by e-mail. Seventy-two percent of the risk managers responded to the inquiry.
Results: Eighty-five percent of the hospitals responded that they collect information regarding the event where harm has occurred or might have occurred to a patient. Seventy-five percent of the hospitals did not allow individuals to report occur- rences without identifying themselves. Only 54% of the hospitals had an organized patient safety program that manages or coordinates all of the hospital’s patient safety activities. The most frequent reason why errors were not reported was the fear of individuals being involved in the investigation and potential disadvantage resulting from it. Eighty-five percent of the hos- pitals produced reports of their adverse event data, but 68% of the hospitals did not distribute occurrence reports within the hospital. Conclusions: Lack of standardized reporting system, available information, procedures for protecting the reporting individuals, and mindlessness/indifference of the hospital employees are identified as the major problems. Therefore, it is crucial to address these problems to develop appropriate solutions, enable proactive involvement from the healthcare com- munity, and change the overall patient safety culture, specifically protecting privacy, to increase the quality of service in the healthcare industry.
Keywords: Patient Safety, Adverse Event, Reporting System
Healthc Inform Res. 2010 September;16(3):166-176.
doi: 10.4258/hir.2010.16.3.166 pISSN 2093-3681 • eISSN 2093-369X
Received for review: August 3, 2010
Accepted for publication: September 15, 2010 Corresponding Author
Jeongeun Kim, RN, PhD
College of Nursing, Seoul National University, 28 Yeongeon-dong, Jongno-gu, Seoul 110-799, Korea. Tel: +82-2-740-8483, Fax: +82- 2-765-4103, E-mail: [email protected]
This is an Open Access article distributed under the terms of the Creative Com- mons Attribution Non-Commercial License (http://creativecommons.org/licenses/by- nc/3.0/) which permits unrestricted non-commercial use, distribution, and reproduc- tion in any medium, provided the original work is properly cited.
ⓒ 2010 The Korean Society of Medical Informatics
event reporting system approaches in healthcare industry are automatically enabled, self-reporting is useful as there are some events that can only be identified by an individual who are directly involved in them. However, many problems and barriers exist that make use of such reporting systems insufficient [3]. Wu et al. [3] reported that about 95% of hos- pitals (valid sample size 327) have implemented an adverse event reporting system in Taiwan; but only 6% of them have a computerized system. Although very large hospitals have implemented a system for self-reporting by healthcare pro- fessionals, there still are large gaps between the number of self-reported events and the actual number of these events.
Qualitative studies have identified a number of barriers hindering the development of adverse event reporting cul- ture. Principle among these is the idea of a "blame culture,"
where the staffs are concerned that they will be personally held responsible for errors, and will receive undue disciplin- ary measures. Other barriers include: fear of reactions from co-workers; the specific characteristics of these events; and lack of feedback [4]. The culture of healthcare itself has also been highlighted as a significant barrier, with its shared be- liefs about collegiality, self-regulation and the inevitability of errors, resulting in ubiquitous discouragement to staff- reporting.
In general, Korea is considered to be at the leading edge of adopting healthcare information systems. One national university hospital had built a complete paperless hospital system by May 2003 and they have operated this system without any difficulties [5]. In addition, many tertiary hospi- tals have built systems utilizing mobile technology through ubiquitous hospital information systems. Primary care phy- sicians are using computerized clinic management systems and all citizens of Korea receive the medicare system. Thus, all of the medical bills of the hospitals are handled through electronic data interchange.
In contrast, efforts to improve patient's safety through HIS in hospitals are still at an early stage. There was no detailed information on the current state of adverse event reporting systems in Korea, which made it difficult to develop an ap- propriate solution. Therefore, as a first step toward building patient safety culture, we performed a large-scale survey to assess the current status of adverse event reporting systems.
The result will serve as a valuable source for making fair comparison with the international standards and enable col- laborative researches on patient safety.
II. Methods
We used the Adverse Event Reporting System (AERS) ques-
tionnaire developed by the Agency for Healthcare Research and Quality (AHRQ, Rockville, MD, USA) [6]. The AERS questionnaire includes topics such as whether a hospital collects information on adverse events, what information is collected, who reports occurrences, how their privacy is protected and uses of the data collected. The questionnaire shares the objectives of our research such that it provides a relatively complete picture of the adverse event-reporting systems in hospitals, focuses on the main reporting vehicle for the hospital, describes reporting procedure for the ma- jority of adverse events, and gives a picture of the types of events that are not reported to their systems. Therefore, the AERS survey questionnaire for risk managers was translated into Korean and was used with minor modifications made to improve clarity and data, such as editing to clarify termi- nology or wording, adding response options to obtain more complete data, and adding open-ended response options.
Back translation was done to confirm the correctness of the Korean version. The content validity was checked through the expert group discussion and consensus.
The online version of the questionnaire was distributed by e-mail to all of the hospital risk managers in the country, with the cooperation of the Korean Quality Improvement Nurse Society (KQINS). The e-mails solicited the risk man- agers’ active participation by providing them small incen- tives and stimulating their motivation of improving the current system. And also the KQINS distributed the official letter and recommended to respond through the Board of Directors network. Data were collected from 14th May until 30th June, 2008. Seventy-two percent responded, and almost all hospitals with the individual Qquality Iimprovement de- partments responded. Statistical analysis was conducted us- ing SPSS ver. 12.0 (SPSS Inc., Chicago, IL, USA). Descriptive statistics were used to summarize the characteristics of the subjects and the reporting system in each respective hospital.
III. Results
1. General Characteristics of Respondents
General characteristics are summarized in Table 1. The aver- age age of the subjects was 42.63 (± 6.57) with the respon- dent group in their forties being the most prevalent group.
Almost two-thirds (72%, n = 52) are working for teaching hospitals. The duration of their experience in the institution ranged from 16 months to 407 months, and the duration of experience in the department ranged from 1 month to 407 months. Seventy-nine percent (n = 57) of the respondents had nursing or other clinical degree, but most of them (99%, n = 71) did not have any degree related to the law and other
Table 1. General characteristics of the respondents (n = 72)
Categories No. (%) Mean ± SD Min-Max
Age 20-29 1 (1) 42.63 ± 6.57 26-58
30-39 22 (30)
40-49 40 (56)
Over 50 7 (10)
Missing 2 (3)
Type of the institution Teaching hospital 52 (72)
Non-teaching hospital 20 (28)
Experience in this institution (mo) 196.46 ± 7.096 16-407
Experience in this department (mo) 51.47 ± 5.47 1-407
Types of education Nursing 57 (79)
Others 15 (21)
BS in Nursing, Public Health, Public Administration, Social Welfare, Business Administration
MS in Nursing Management, Nursing Education, Public Health, Social Welfare, Pharmaceutics, Medical Business Administration
PhD in Business Administration
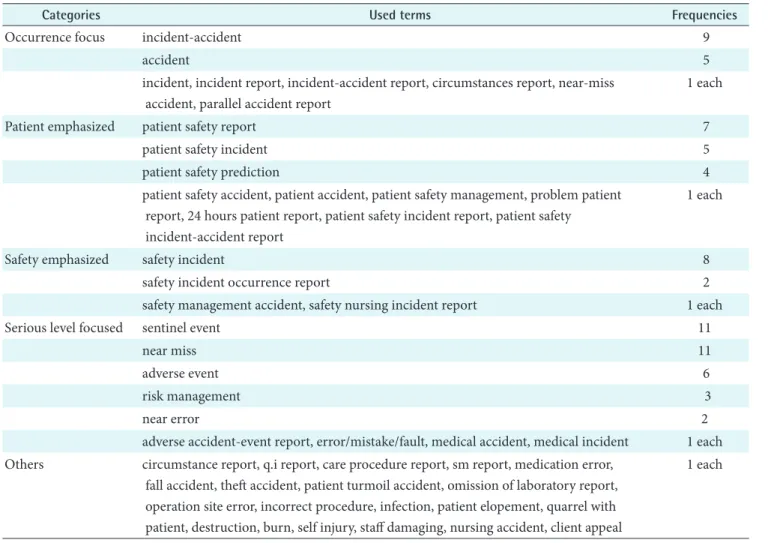
Table 2. Terms used to name the occurrences by categories
Categories Used terms Frequencies
Occurrence focus incident-accident 9
accident 5
incident, incident report, incident-accident report, circumstances report, near-miss accident, parallel accident report
1 each
Patient emphasized patient safety report 7
patient safety incident 5
patient safety prediction 4
patient safety accident, patient accident, patient safety management, problem patient report, 24 hours patient report, patient safety incident report, patient safety
incident-accident report
1 each
Safety emphasized safety incident 8
safety incident occurrence report 2
safety management accident, safety nursing incident report 1 each
Serious level focused sentinel event 11
near miss 11
adverse event 6
risk management 3
near error 2
adverse accident-event report, error/mistake/fault, medical accident, medical incident 1 each Others circumstance report, q.i report, care procedure report, sm report, medication error,
fall accident, theft accident, patient turmoil accident, omission of laboratory report, operation site error, incorrect procedure, infection, patient elopement, quarrel with patient, destruction, burn, self injury, staff damaging, nursing accident, client appeal
1 each
credentials of risk management (96%, n = 69). 2. System of the Reporting Process
Eighty-five percent (n = 61) of the hospitals collected ad- verse event information where harm has occurred or might
Table 3. The sources of information about the occurrences (n = 72)
Yes No Missing
From hospital staff filling out an occurrence form 64 (89) 6 (8) 2 (3)
By attending a committee meeting 48 (67) 17 (24) 7 (10)
From hospital staff calling you directly 44 (61) 21 (29) 7 (10)
By a patient notifying the hospital 44 (61) 16 (22) 12 (17)
By conducting rounds or walk around 24 (33) 34 (47) 14 (19)
Through a hotline 20 (28) 41 (57) 11 (15)
By a governmental agency contacting the hospital 11 (15) 44 (61) 17 (24)
Values are presented as number (%).
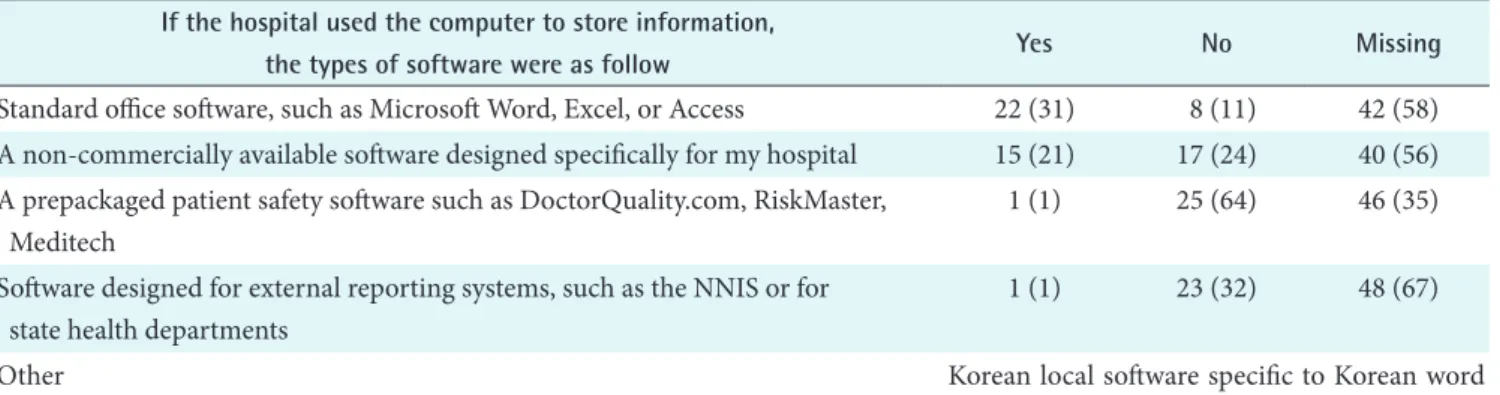
Table 4. The types of software used to store information (n = 72) If the hospital used the computer to store information,
the types of software were as follow Yes No Missing
Standard office software, such as Microsoft Word, Excel, or Access 22 (31) 8 (11) 42 (58) A non-commercially available software designed specifically for my hospital 15 (21) 17 (24) 40 (56) A prepackaged patient safety software such as DoctorQuality.com, RiskMaster,
Meditech
1 (1) 25 (64) 46 (35)
Software designed for external reporting systems, such as the NNIS or for state health departments
1 (1) 23 (32) 48 (67)
Other Korean local software specific to Korean word
processing Values are presented as number (%).
Table 5. The types of information collected by reporting system (n = 72)
Types of information Yes No Missing
Time of occurrence 71 (99) 1 (1) 0 (0)
Place of occurrence 70 (97) 2 (3) 0 (0)
Patient’s age, sex, or other demographic information 70 (97) 2 (3) 0 (0)
Type of occurrence 68 (94) 4 (6) 0 (0)
Condition before and/or after occurrence 68 (94) 4 (6) 0 (0)
If any action was taken 68 (94) 4 (6) 0 (0)
Patient’s relevant medical history 64 (89) 8 (11) 0 (0)
If administrative follow-up action was taken 61 (85) 8 (11) 3 (4)
Contributing factors 56 (78) 13 (18) 3 (4)
Personnel involved 48 (67) 21 (29) 3 (4)
Anything else Emotional responses and correspondence of the family such as legal
confrontation, organizational outcomes, opinions of the person in charge of the department, and narrative interview of the guardians Values are presented as number (%).
have occurred to a patient during the course of patient care. Terminology used to describe such occurrences in the hospitals are listed below in Table 2. It was revealed that there are subtle variations of terms used to name the occur- rences, as there exists no standardized or consensus terms.
Furthermore, 79% (n = 57) of the hospitals were using the same terms throughout the hospital, whereas 6% (n = 4) of them were using different terms in different departments, which reveal the lack of standardization of terminology, even within individual institution. The sources of informa- tion from which the respondents learned about these occur- rences are summarized in Table 3. The most frequent source of information was the “occurrence form” (89%, n = 64), and followed by committee meeting (67%, n = 48), direct calling (61%, n = 44) and patient’s notification (61%, n = 44). Eighty-one percent (81%, n = 58) of the hospitals stored the information on occurrences in a central dedicated da- tabase. Those without central database (18%, n = 13) stored the information in various ways such as with the concerned party, nursing department, and administrative department.
However, there were cases where the location of database is unknown or secrete. Only 48% of the case stored the infor-
mation on paper, 44% used both paper and computer, and 8% used only computer. The types of software used to store information are shown in Table 4. The most frequently used software is standard office software, whereas adoption rate of prepackaged patient safety software (3%, n = 1) and software designed for external reporting systems (3%, n = 1) were ex- tremely low.
Eighty-nine percent of the hospitals allowed descriptive ac- counts to report the occurrences. Most hospitals collected information regarding the time of occurrence (99%, n = 71), place of occurrence (97%, n = 70), patient’s age/sex/demo- graphic information (97%, n = 70), whereas collection rate of information about the personnel involved (67%, n = 48) and contributing factors (78%, n = 56) were comparatively low (Table 5).
About half of the hospitals (46%, n = 33) collected the se- verity of harm which occurred to the patient, however not all of them mentioned the levels of severity. Only 28 (39%) hospitals described the levels of severity and the number of hospitals using 2 levels were 24%, 3 levels 21%, 4 levels 15%, 3 levels 9% and other using 1, 6, 7, 8, 9 levels were one hos- pital each. Regarding the question whether the information Table 6. The committee in charge of the occurrences
Name of the committees Yes No Don’t have Missing
If yes, the information dis- cussed is protected from
legal discovery
Yes No
Patient Safety Committee 53 (74) 11 (15) 7 (10) 1 (1) 27 (38) 22 (31)
Quality Management Committee 33 (46) 31 (43) 1 (1) 7 (10) 15 (21) 14 (19)
Medical Executive Committee 32 (44) 30 (42) 2 (3) 8 (11) 12 (17) 14 (19)
Senior Management Administrative Committee 31 (43) 26 (36) 3 (4) 12 (17) 13 (18) 14 (19)
Risk Management Committee 21 (29) 27 (38) 11 (15) 13 (18) 8 (11) 9 (13)
Morbidity and Mortality Conference 13 (18) 27 (38) 20 (28) 12 (17) 9 (13) 3 (4)
Hospital Peer Review Committee 9 (13) 25 (35) 25 (35) 13 (18) 4 (6) 3 (4)
The Board or Committee of the Board 8 (11) 37 (51) 13 (18) 14 (19) 4 (6) 3 (4)
Departmental Peer Review Committee 7 (10) 26 (36) 28 (39) 11 (15) 3 (4) 2 (3)
Performance Improvement Committee 2 (3) 30 (42) 27 (38) 13 (18) 1 (1) 1 (1)
Any other committee 5 (7) 8 (11) 0 (0) 59 (82) 3 (4) 2 (3)
Accident countermeasure committee (provisional) Medical strife countermeasure committee Managerial committee of the nursing department Optimal healthcare committee
Medical accident committee Policy meeting
Values are presented as number (%).
in the hospital’s current reporting system is protected from legal discovery, 49% (n = 35) answered yes and another 49%
(n = 35) hospitals said no. The concerned committees where the occurrences are discussed are summarized in Table 6.
Majority of the committee was the Patient Safety Committee (74%, n = 53) and Quality Management Committee (46%, n
= 33), Medical Executive Committee (44%, n = 32), Senior Management Administrative Committee (43%, n = 31) fol- lowed.
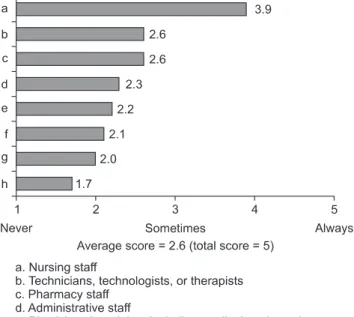
The origin of staff group that reports adverse events varied.
The nursing staff was the group with highest report number, followed by the technicians, pharmacy staff, administrative staff and physician group (Figure 1). Only 6% (n = 4) of the hospitals answered that physicians who were not employed but working in the hospital reported occurrences to the reporting system, 22% (n = 16) of them answered the unem- ployed physicians did not report occurrences, and 21% (n
= 15) answered they didn’t know. Over half of the hospitals (51%, n = 37) employed all physicians, where they had no physicians working in the hospital without explicit employ- ment position. Only 20% (n = 14) of the hospitals answered that other individuals who were not employed but working in the hospital reported occurrences to the reporting system, 26% (n = 19) of them answered the unemployed individu- als did not report occurrences, and 21% (n = 15) answered they didn’t know. In other case, 33% (n = 24) of the hospitals didn’t have such type of employees. Seventy-five percent (n
= 54) of the hospitals did not allow individuals to report occurrences without identifying themselves, but on the con- trary, 14% (n = 10) of them allowed in all cases, 11% (n = 8) in some cases. In the case of which reporter identified him or herself, 50% (n = 36) of the hospitals protected the person’s identity, 30% (n = 22) did not, and 17% (n = 12) of them only protected in some cases (3%, 2 cases were missing).
The cases when the reporter’s identity was not protected are listed in Table 7.
Most of the hospitals (82%, n = 60) didn’t keep the report of occurrences in an employee’s personnel file, whereas 5%
(n = 4) of the hospitals kept all the cases, and 11% (n = 8) of them kept in some cases. The types of report kept in an em-
Figure 1. Reporting status by different staff group.
Table 7. The example of when a reporter’s identity is not pro- tected
· When the occurrence is an explicit medical accident
· When the occurrence is an explicit malpractice
· When the same person is involved repeatedly
· When the case is dealt with by the medico-ethical committee
· When it was reported by the family member or guardian
· It is mandatory to name the person during the committee meetings
· It is mandatory to fill in the name in the report form
· It could be checked automatically who submit the report by the computer system
· Anonymous reports usually dealt with low priority
Figure 2. The frequency of report by the severity level of occurrences.
ployee file were as follows; involved in cases where the pa- tient was harmed such as by transfusion error or medication error; involved in the similar cases repeatedly; resulted in the organizational loss; resulted in the open case; and resulted in the official reprimand.
Only 54% (n = 39) of the hospitals had an organized patent safety program that managed or coordinated all of the hospi- tal’s patent safety activities, and 46% (n = 33) of them didn’t have. For the current reporting system, only one hospital
started with patient safety program first and then moved to the reporting system, and 33% (n = 24) of the hospitals started with reporting system first. Other 18% (n = 13) of the hospitals started with both patient safety program and reporting system concurrently, and one hospital had no re- porting system at all.
3. Trend of the Reporting
It was found that the trend of the reporting frequency was
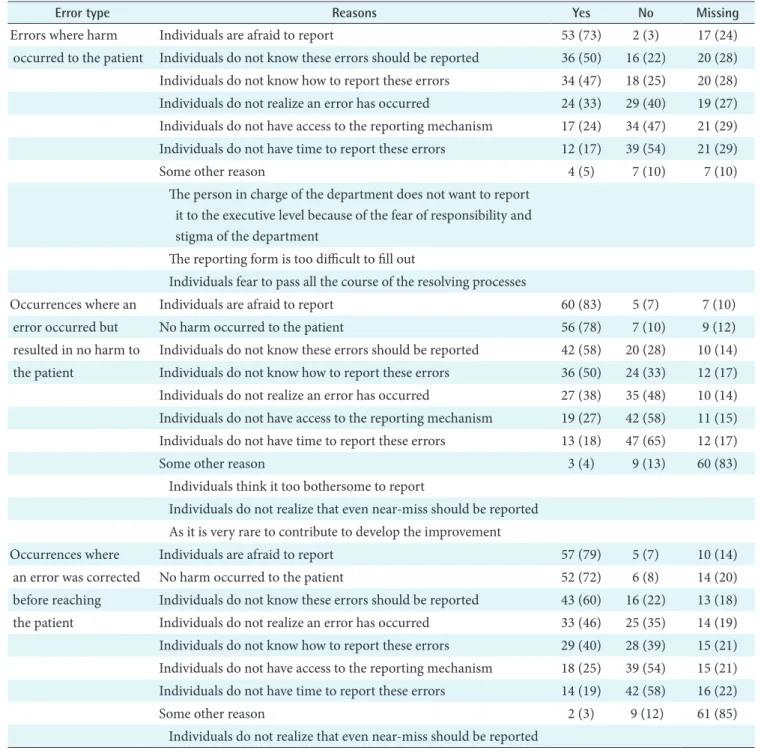
Table 8. The reasons of why errors are not reported (n = 72)
Error type Reasons Yes No Missing
Errors where harm Individuals are afraid to report 53 (73) 2 (3) 17 (24)
occurred to the patient Individuals do not know these errors should be reported 36 (50) 16 (22) 20 (28) Individuals do not know how to report these errors 34 (47) 18 (25) 20 (28) Individuals do not realize an error has occurred 24 (33) 29 (40) 19 (27) Individuals do not have access to the reporting mechanism 17 (24) 34 (47) 21 (29) Individuals do not have time to report these errors 12 (17) 39 (54) 21 (29)
Some other reason 4 (5) 7 (10) 7 (10)
The person in charge of the department does not want to report it to the executive level because of the fear of responsibility and stigma of the department
The reporting form is too difficult to fill out
Individuals fear to pass all the course of the resolving processes
Occurrences where an Individuals are afraid to report 60 (83) 5 (7) 7 (10)
error occurred but No harm occurred to the patient 56 (78) 7 (10) 9 (12)
resulted in no harm to Individuals do not know these errors should be reported 42 (58) 20 (28) 10 (14) the patient Individuals do not know how to report these errors 36 (50) 24 (33) 12 (17) Individuals do not realize an error has occurred 27 (38) 35 (48) 10 (14) Individuals do not have access to the reporting mechanism 19 (27) 42 (58) 11 (15) Individuals do not have time to report these errors 13 (18) 47 (65) 12 (17)
Some other reason 3 (4) 9 (13) 60 (83)
Individuals think it too bothersome to report
Individuals do not realize that even near-miss should be reported As it is very rare to contribute to develop the improvement
Occurrences where Individuals are afraid to report 57 (79) 5 (7) 10 (14)
an error was corrected No harm occurred to the patient 52 (72) 6 (8) 14 (20)
before reaching Individuals do not know these errors should be reported 43 (60) 16 (22) 13 (18) the patient Individuals do not realize an error has occurred 33 (46) 25 (35) 14 (19) Individuals do not know how to report these errors 29 (40) 28 (39) 15 (21) Individuals do not have access to the reporting mechanism 18 (25) 39 (54) 15 (21) Individuals do not have time to report these errors 14 (19) 42 (58) 16 (22)
Some other reason 2 (3) 9 (12) 61 (85)
Individuals do not realize that even near-miss should be reported Values are presented as number (%).
somewhat different according to the severity of the occur- rences. When the result of the occurrence was explicit, it was reported more. However, if the occurrence was resulted in no harm or corrected before reaching the patient, it was re- ported less (Figure 2). The most frequent reason why errors were not reported was the fear of individuals being involved (Table 8). It was 50% (n = 36) that individuals did not know these errors should be reported, and about half (47%, n = 34) of the individuals did not even know the methods of re- porting. About one third of the individuals (33%, n = 24) did not even realize an error had occurred, and about one fourth of the individuals (24%, n = 17) did not have access to the reporting mechanism.
Fifty-five percent (n = 40) of the hospitals reported noso- comial infections to the reporting system, and 42% (n = 30) did not report nosocomial infection. Thirty-eight percent (n = 28) of the hospitals reported all the occurrences to the hospitals’ reporting system, and 57% (n = 41) hospitals did
not. The occurrences which were not reported are listed in Table 9. Thirty-seven hospitals (n = 51%) estimated that 0-30% of the occurrences in the reporting system resulted in patient harm, 3 hospitals (n = 4%) estimated 31-60%, 6 hos- pitals (8%) estimated 61-100% and other 36% (n = 26) of the hospitals didn’t answer the questions.
Most hospitals (74%, n = 54) allowed department of risk management to receive reports of occurrences from all areas or departments, but in some hospitals (23%, n = 17) they
Table 9. The occurrences which are not reported
Near miss. Occurrences where an error occurred but resulted in no harm to the patient
Facility-related accidents
Theft: Managed by the administrative office Elopement: Managed by the accounting office
Nosocomial infection: Managed by the infection control office. Managed by monitoring not by the self reporting Physician involved occurrences such as wrong diagnosis, or wrong surgery
When it was not known to others
When the department does not want to open the case
Table 10. The frequency of report received from different departments
Department Always Often Sometimes Rarely Never
Nursing 6 (8) 4 (5) 0 (0) 0 (0) 0 (0)
Quality Management or Performance Improvement 6 (8) 2 (3) 1 (1) 0(0) 0 (0)
Infection Control 6 (8) 1 (1) 1 (1) 0(0) 1 (1)
Medical Leadership 3 (4) 2 (3) 1 (1) 1 (1) 2 (3)
Pharmacy 3 (4) 2 (3) 1 (1) 1 (1) 1 (1)
Central Hospital Administration 3 (4) 2 (3) 1 (1) 1 (1) 2 (3)
Laboratory Medicine 2 (3) 2 (3) 1 (1) 1 (1) 2 (3)
Transfusion Medicine 2 (3) 2 (3) 0 (0) 1 (1) 2 (3)
Any other department: training session for the whole employee or the meeting of clinical directors
1 (1) 0 (0) 0 (0) 0 (0) 0 (0)
Values are presented as number (%).
Figure 3. The use of occurrence information.
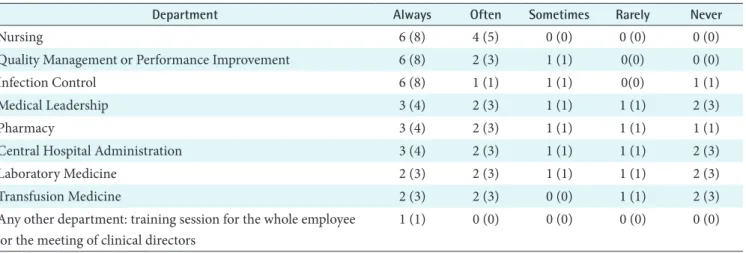
didn’t because there was no such department. The areas or departments where the department of risk management couldn’t receive the reports of occurrences were pharmacy and me di cal department. The only department that ran the risk management and reporting systematically was nursing department. The frequency of report received from different departments is summarized in Table 10.
4. Utilization of the Reporting Data
The most frequent use of data was to produce trends of oc- currences, to conduct root cause analysis and to educate or train the staff. The least use of data was to compare against other hospitals, to fill a governmental agency’s requirement or to report sentinel events to the evaluating organization of hospitals as there was no such organization that run on a regular basis in Korea (Figure 3). The results after the occur- rences are summarized in Figure 4. The most frequent con- tributing factor that led to the immediate action or to launch a quality/performance improvement was the occurrence re- ports followed by telephone calls and/or attending meetings.
The least contributing factor was making rounds.
Most of the hospitals (85%, n = 61) produced reports of their occurrence data, and in this case, 5% (n = 4) produced weekly, 26% (n = 19) monthly, 30% (n = 22) quarterly, 12%
(n = 9) yearly and other 8% (n = 6) of the hospitals produced twice a year or if re quired. Most of the hospitals (68%, n = 49) did not distribute any occurrence reports within the hos- pital, but on the other hand some hospitals did (14%, n= 10).
In the case of which the hospital distributed reports to the relevant department, 8% (n = 6) of the hospitals needed less than one week to distribute, and 5% (n = 4) of them needed over 2 weeks to distribute the report.
IV. Discussion
Based on the result of this research, several major topics are raised with regards to the patient safety problems and the solutions.
First problem is that there is no standardized report proto- col. It was found that there are no standard terms used for describing the patient safety related matters even within a single institution. This point is argued in the Chang’s study, where they stress the importance of the common language for the improvement of the situation [7]. Lack of such com- mon language will cause communication error that will result in the low efficiency of the resolution for the problems and system improvement. It will be mandatory to develop the standardized communication system for the patient safe- ty issue to lower the occurrences. This similar situation ap- plies to anonymous reports. It varies from the sentinel event to near miss, and equipment error etc, which means that there is no consensus, common understanding and criteria to report, communicate, or measure the current situation of patient safety problems in hospitals.
Second problem is the paucity of information. There is not enough information in quantity and quality, and the types
Figure 4. The result of the occurrence.
of information collected the least frequently by reporting system are; contributing factors, administrative follow- up action and any action taken after the occurrences. This implies that there are no in-depth information to follow-up the cause and effect of the occurrence, and the information necessary to resolve the root-cause to improve the system of the hospitals is not available. This goes directly against the point raised by Rex et al. [8] regarding the importance of the wealth of information to conduct the root cause analysis.
Third problem is that there is no established protection procedure. Currently, there is no protection or anonymity safeguard for the reporters or individuals involved in the oc- currence. Seventy five percent (n = 54) of the hospitals do not allow individuals to report occurrences without identify- ing themselves. In the case of which reporter identifies him- self or herself, only about 50% of the hospitals protect the person’s identity. Considering that the most frequent reason why errors are not reported is the fear of individuals being involved, this is very discouraging. Besides, the percent- age of information discussed in committee protected from legal discovery was very low. This means that it is very hard to open the information to solve the problem proactively, and there exists fear and anxiety among the individuals in- volved in the occurrences that prohibit improving the situ- ation. Considering only the specialty-based, voluntary, and anonymous reporting by health care professionals identified a broad range of medical errors [9], it needs more proactive solution to protect the anonymity of the reporter.
The fourth but not the least of the problems is mindless- ness and indifference of the people working in the hospital.
It is almost over 50% that individuals do not know these errors should be reported, and about half of the individuals do not even know reporting protocol. About one third of the individuals do not even realize an error has occurred, and about a quarter of the individuals do not have access to the reporting mechanism. This means that there is no systematic approach for improving the current problematic status.
It was revealed that the nursing staff is the group with high- est reporting number for adverse occurrences, whereas phy sician group is far behind in the list. Also, the only department that runs the risk management and systematic reporting is nursing department. This can be the main reason that the re- porting system does not operate in as efficiently as possible, because physicians and surgeons who may be the center of problems are not actively reporting adverse occurrences. As was noted in one research, requiring physician board certi- fication, physician hospital privileges, or office accreditation is not likely to reduce office adverse events. For example, restrictions on dilute local anesthesia for liposuction would
not reduce adverse events and could increase adverse events if patients are shifted to riskier approaches [10]. State and/
or national legislation establishing adverse event reporting systems and the change of the institutional cultures should be supported.
It is absolutely imperative to consider the situation, develop appropriate solutions, encourage proactive involvement from healthcare community and change the culture for pro- tecting the privacy of reporters and individuals involved in adverse occurrences. In USA, UK, Canada and Australia, several measures for ensuring patient safety such as national institutions, national reporting systems and legislations for the patient safety exist. To cite one example in Taiwan, their implementation of adverse event reporting systems has oc- curred in two stages. In the first stage, the Taiwan Joint Com- mission on Hospital Accreditation under the Department of Health launched a project to develop and promote a web- based reporting system for hospitals to gather information about adverse events or errors occurring inside the hospital by self-reporting. In the second stage, another project was launched to establish a national information infrastructure to integrate individual reporting systems into a national adverse event reporting system in 2004 [3]. Hospitals and government all around the globe which had not set in place of the adverse event reporting systems and which has no sys- tematic or national approaches could benchmark the cases to resolve the patient safety problems for the time being. As medical industry is considering the global medical tourism, it is mandatory for them to prove that they provide very safe medical system and high quality as well.
The limitation of this study was that it could only give the statistical summary of the current status. To provide the so- lutions for the problems, it needs to be studied using qualita- tive methodologies by interviewing the front line practitio- ners in person and to analyze the phenomena in detail. The authors propose that variable methods should be sought and the methodological triangulation should be adopted to get profound understanding about the patient safety reporting system related phenomena.
It was repeatedly pointed out that national legislation estab- lishing adverse event reporting systems should be supported and mandated to report all the patient safety related occur- rences of not only sentinel events but also near misses. There are certain critical elements necessary for reporting systems’
success [11]. These critical elements include making the sys- tem legally required, with protection from discovery; devel- oping the system collaboratively, including all stakeholders in the system’s design and implementation; clear and objec- tive definitions of reporting criteria as a basis for collecting
accurate and consistent data; ongoing training and educa- tional support for system users; and having a stakeholder advisory group for ongoing assessment and recommenda- tions, ensuring the system’s relevance and viability. Other elements vital to the success include having a secure Web- based system and ensuring that adequate resources and sup- ports are dedicated to operating and maintaining the system.
Ultimately, the success of the system also requires that users receive feedback regarding their own performance. It must be possible to analyze data at both the facility and nation- wide levels, incorporating dissemination of lessons learned.
And also, no standard classification for patient safety was existed previously, Korean version of ICPS can be used and adopted as a standards for the successful implementation of the system [12]. We hope that this kind of efforts and initia- tives serve as the global standard for improving the quality of healthcare.
Conflict of Interest
No potential conflict of interest relevant to this article was reported.
Acknowledgements
This work was supported by the Korea Research Founda- tion Grant funded by the Korean Government (MOEHRD) (KRF-2007-313-E00456).
References
1. Hannah KL, Schade CP, Lomely DR, Ruddick P, Bel- lamy GR. Hospital administrative staff vs. nursing staff responses to the AHRQ hospital survey on patient safety culture. [cited on 2010 Sept 10]. Available from: http://
www.ahrq.gov/downloads/pub/advances2/vol2/Advanc- es-Hannah_23.pdf.
2. Bates DW, Gawande AA. Improving safety with infor- mation technology. N Engl J Med 2003; 348: 2526-2534.
3. Wu JH, Shen WS, Lin LM, Greenes RA, Bates DW. Test- ing the technology acceptance model for evaluating healthcare professionals' intention to use an adverse
event reporting system. Int J Qual Health Care 2008; 20:
123-129.
4. Vincent C, Stanhope N, Crowley-Murphy M. Reasons for not reporting adverse incidents: an empirical study. J Eval Clin Pract 1999; 5: 13-21.
5. Ha KY. Status report of Seoul National University Bun- dang Hospital's EMR and privacy/confiendiality issue:
declaration of the ethics charter of Health Information Sympsium 2004: 47-72.
6. AHRQ. Hospital Survey on Patient Safety Culture. Rock- ville, MD: AHQR; [cited on 2010 Sept 10]. Available from: http://www.ahrq.gov/qual/patientsafetyculture/
hospsurvindex.htm.
7. Chang A, Schyve PM, Croteau RJ, O'Leary DS, Loeb JM.
The JCAHO patient safety event taxonomy: a standard- ized terminology and classification schema for near misses and adverse events. Int J Qual Health Care 2005;
17: 95-105.
8. Rex JH, Turnbull JE, Allen SJ, Vande Voorde K, Luther K. Systematic root cause analysis of adverse drug events in a tertiary referral hospital. Jt Comm J Qual Improv 2000; 26: 563-575.
9. Suresh G, Horbar JD, Plsek P, Gray J, Edwards WH, Shiono PH, Ursprung R, Nickerson J, Lucey JF, Goldma- nn D. Voluntary anonymous reporting of medical errors for neonatal intensive care. Pediatrics 2004; 113: 1609- 1618.
10. Coldiron B, Fisher AH, Adelman E, Yelverton CB, Balkrishnan R, Feldman MA, Feldman SR. Adverse event reporting: lessons learned from 4 years of Florida office data. Dermatol Surg 2005; 31: 1079-1092.
11. Flink E, Chevalier CL, Ruperto A, Dameron P, Heigel FJ, Leslie R. Lessons learned from the evolution of manda- tory adverse event reporting systems. In: Henriksen K, Battles JB, Marks ES, Lewin DI, eds. Advances in patient safety: from research to implementation. Vol. 3: Imple- mentation issues. Rockville (MD): Agency for Health- care Research and Quality; 2005. p135-151.
12. Kim J, Lee J, Lee S. A Korean Version of the WHO In- ternational Classification for Patient Safety: a Validity Study. J Korean Soc Med Inform 2009; 15: 381-392.