• 검색 결과가 없습니다.

The Association of Serum Ferritin and Metabolic Syndrome and Metabolic Syndrome Score in Korean Adults

N/A
N/A
Protected

Academic year: 2021

Share "The Association of Serum Ferritin and Metabolic Syndrome and Metabolic Syndrome Score in Korean Adults"

Copied!
9
0
0

로드 중.... (전체 텍스트 보기)

전체 글

(1)

pISSN 1738-3544 eISSN 2288-1662

The Association of Serum Ferritin and Metabolic Syndrome and Metabolic Syndrome Score in Korean Adults

Hyun Yoon 1 , Jae Seong Go 2 , Kang Uk Kim 2 , Keon Woo Lee 2

1

Department of Biomedical Laboratory Science, Hanlyo University, Gwangyang 57764, Korea

2

Department of Radiological Science, Gwangyang Health College, Gwangyang 57764, Korea

대한민국 성인에서 대사증후군 및 대사증후군 구성요소의 증가와 혈청 Ferritin의 관련성

윤 현 1 , 고재성 2 , 김광욱 2 , 이건우 2

1

한려대학교 임상병리학과,

2

광양보건대학교 방사선과

This study was conducted to assess the relationship amongst serum ferritin, and metabolic syndrome (MetS) and metabolic syndrome score (MSS) in Korean adults. The data of 16,096 adults (6,840 men as well as 4,916 premenopausal and 4,340 postmenopausal women) aged ≥ 20 years in the Korean National Health and Nutrition Examination Survey (KNHANES) between 2010 and 2012 were analyzed. The prevalence rate of MetS was 3,978 (24.7%) (men, 24.6%; premenopausal women, 11.1%; postmenopausal women, 40.3%). The key study results were as follows: First, after the adjustment for relevant variables, the serum ferritin level (M±SE) was significantly higher ( p

<0.001) in the MetS group (men, 132.25±1.98 ng/mL; premenopausal women, 39.89±1.49 ng/mL; postmenopausal women, 73.45±1.14 ng/mL) than in the non-MetS group (men, 111.08±1.01 ng/mL; premenopausal women, 32.26±0.50 ng/mL; postmenopausal women, 63.26±0.98 ng/mL). Second, the serum ferritin levels increased as MSS increased in all groups (men, premenopausal women, and postmenopausal women) ( p <0.001). In conclusion, MetS and MSS increases were positively associated with higher serum ferritin levels.

Key words: Metabolic syndrome, Metabolic syndrome score, Serum ferritin

Corresponding author: Hyun Yoon

Department of Biomedical Laboratory Science, Hanlyo University, 94-13 Hallyeodae-gil, Gwangyang-eup, Gwangyang 57764, Korea Tel: 82-61-760-1150

Fax: 82-61-761-6709 E-mail: yh9074@yahoo.co.kr

This is an Open Access article distributed under the terms of the Creative Commons Attribution Non-Commercial License (http://creativecommons.org/licenses/by-nc/4.0) which permits unrestricted non-commercial use, distribution, and reproduction in any medium, provided the original work is properly cited.

Copyright © 2016 The Korean Society for Clinical Laboratory Science. All rights reserved.

Received: October 14, 2016 Revised 1

st

: November 4, 2016 Revised 2

nd

: November 6, 2016 Revised 3

rd

: November 12, 2016 Accepted: November 14, 2016

Introduction

Iron is a ubiquitous metal of vital importance to the normal physiologic processes of many organisms [1], and it is essential for many metabolic processes such as oxygen transport, DNA synthesis, and electron transport [2]. As a ferrous iron and ferric iron were active forms of iron, they was can catalyze generation of highly reactive oxygen species,

such as hydroxyl, alkoxyl, and peroxyl radicals via Fenton and

Haber–Weiss reactions [3]. The serum ferritin concentration

reflects iron stores in the body because ferrous iron combines

with apoferritin and is stored by ferritin in many organisms

[4]. As an excessive accumulation of ferritin can increase the

concentration of catalytically active free iron, and serum

ferritin concentration has been considered a possible risk

factor of various chronic diseases including cancer, car-

(2)

diovascular disease, diabetes, and essential hypertension, in which oxidative stress is closely involved in pathogenesis [5-9].

A characteristic of metabolic syndrome (MetS) is insulin resistance, which the National Cholesterol Education Program Adult Treatment Panel III (NCEP-ATPIII) defined as exhibiting more than three out of the five risk factors for coronary artery disease, elevated blood pressure, elevated blood sugar, abdominal obesity, elevated triglycerides, and reduced high density lipoprotein cholesterol [10]. The five risk factors are directly related to an increased prevalence of cardio-cere- brovascular disease [11-13].

Recently, research on serum ferritin concentration and MetS has been conducted all over the world. However, the association of MetS and serum ferritin concentration is still being debated, as the findings vary across studies. That is, some report that MetS or its components are associated with serum ferritin concentration [14-17], others that they are not [18,19]. Some report that association of the MetS or serum ferritin levels differ according to sex [20,21]. The Republic of Korea is experiencing an increasing prevalence of diseases such as MetS and cardiovascular diseases. However, research on the association between MetS and serum ferritin concen- tration in Korean adults (men, premenopausal women, and postmenopausal women) is rare. Therefore, the present study sought to investigate the association between MetS and its components and serum ferritin concentration in Korean men, premenopausal women, and postmenopausal women aged 20 or older using the fifth Korea National Health and Nutrition Examination Survey (KNHANES V) data, which is representative of Korea.

Materials and Methods

1. Study subjects

KNHANES V data were collected for 3 years (2010∼2012), using a rolling sampling survey that involved a complex, stratified, multistage, probability cluster survey of a repre- sentative sample of the non-institutionalized civilian population in South Korea. The survey was composed of three parts: a health interview survey, a health examination survey, and a

nutrition survey. Each survey was conducted by specially trained interviewers. The interviewers were not provided with any prior information regarding specific participants before conducting the interviews. Participants provided written informed consent to participate in this survey, and we received the data in anonymized form. In the KNHANES V (2010∼2012), 25,534 individuals over age 1 were sampled for the survey. Among them, we limited the analyses to adults aged ≥20 years ( n =19,392). We excluded 2,138 subjects whose data were missing for important analytic variables, such as serum ferritin level or the mental health questionnaire.

In addition, we excluded participants who had cancer (650 subjects) or hepatitis virus B (259 subjects) or hepatitis virus C (38 subjects) and the 211 subjects with suspected hemo- chromatosis (men, serum ferritin >400 ng/mL; women, serum ferritin >300 ng/mL) [22,23]. Finally, 16,096 subjects (6,840 men and 4,916 premenopausal and 4,340 post- menopausal women) were included in the statistical analysis.

The KNHANES V (2010∼2012) study has been conducted according to the principles expressed in the Declaration of Helsinki. (Institutional Review Board No, 2010-02CON-21-C;

2011-02CON-06-C; 2012-01EXP-01-2C). All participants in the survey signed an informed written consent form. Further information can be found in “The KNHANES V (2010∼2012) Sample”, which is available on the KNHANES website [24].

The data from KNHANES is available on request by email if the applicant logs onto the “Korea National Health and Nutrition Examination Survey” website.

2. General characteristics and blood chemistry

Research subjects were classified by gender and by age into 20∼29 years, 30∼39 years, 40∼49 years, 50∼59 years, 60∼

69 years, and 70 years or older. The health categories of the

participants were classified into three parts: drinking, smoking,

and exercising. In the drinking category, the drinking II group

included those who drank more than a glass of liquor per

week, and drinking I group less than a glass of liquor per

week, and the non-drinking group less than a glass of liquor

per year. In the smoking category, participants who smoked

more than one cigarette a day, those who previously smoked

but do not presently smoke, and those who never smoked

(3)

were classified into the current-smoking group, ex-smoking group, and non-smoking group, respectively. In the exercising category, the exercising group was classified as participants who exercised on a regular basis regardless of indoor or outdoor exercise (for 30 min at a time and per day in the case of moderate exercise, such as swimming slowly, doubles tennis, volleyball, badminton, and table tennis). Anthropometric measurements included measurement of height, weight, body mass index (BMI), and waist measurement (WM) and final measurements of systolic blood pressure (SBP) and diastolic blood pressure (DBP). Blood chemistry included measurement of total cholesterol (TC), high density lipoprotein cholesterol (HDL-C), triglyceride (TG), and fasting blood glucose (FBG).

3. Serum ferritin measurement

Serum ferritin was measured with a immunoradiometric assay (IRMA-mat Ferritin, DiaSorin, Stillwater, USA) using a 1470 WIZARD gamma-Counter (PerkinElmer, Turku, Finland).

4. MetS and MSS

MetS was defined using the diagnostic criteria of the National Cholesterol Education Program (NCEP) based on common clinical measures including TG, HDL-C, blood pressure, FBG, and WM. TG over 150 mg/dL was set as the criterion for elevated TG. The criteria for reduced HDL-C were HDL-C of less than 40 mg/dL and 50 mg/dL for men and women, respectively. FBG over 100 mg/dL was set as the criterion for elevated FBG. SBP over 130 mmHg or DBP over 85 mmHg or medication were set as the criteria for elevated blood pressure. The criteria for abdominal obesity were waist measurements of over 90 cm and 80 cm for men and women, respectively, according to the Asia-Pacific criteria [25]. The presence of defined abnormalities in any three of these five measures indicated a diagnosis of MetS. The metabolic syndrome score (MSS) indicates the presence of abdominal obesity, elevated blood pressure, elevated FBG, elevated TG, or reduced HDL-C. Subjects without any of the five risk factors received an MSS 0, and those with one, two, three, and more than four of the risk factors received an MSS score of 1, 2, 3, and ≥4, respectively [26].

5. Data analysis

The collected data were statistically analyzed using SPSS WIN version 18.0 (SPSS, Chicago, USA). The distributions of the participant characteristics were converted into percentages, and the successive data were presented as mean value with standard deviations. The mean value difference in serum ferritin levels for characteristics of the subjects and the MetS components were calculated using an independent t-test and analysis of variance (ANOVA). After modification of the serum ferritin level variable, the mean value difference in serum ferritin levels for MetS and MSS were calculated using an analysis of covariance (ANCOVA). The significance level for all of the statistical data was set as p <0.05.

Results

1. General characteristics of research subjects

General characteristics of the research subjects are shown in Table 1. According to the classification of risk factors for coronary artery disease and the MSS guidelines, 4,570 (28.4%), 4,102 (25.5%), 3,446 (21.4%), 2,395 (14.9%), and 1,583 (9.8%) subjects were classified as MSS 0, MSS 1, MSS 2, MSS 3, and MSS ≥4, respectively. The prevalence rate of MetS was 3,978 (24.7%) of the 16,096 patients (men, 24.6%;

premenopausal women, 11.1%; postmenopausal women, 40.3%). The mean value of serum ferritin levels was 77.40±65.50 ng/mL (men, 115.89±72.12 ng/mL; preme- nopausal women, 32.50±29.53 ng/mL; postmenopausal women, 67.57±44.86 ng/mL).

2. Serum ferritin levels by subject characteristics

Serum ferritin levels by subject characteristics were shown in Table 2. In the men group, serum ferritin levels were associated with age ( p <0.001), BMI ( p <0.001), TC ( p <0.001), alcohol behavior ( p <0.001), and smoking status ( p <0.001).

In the premenopausal women group, serum ferritin levels

were associated with age ( p <0.001), BMI ( p <0.001), TC

( p =0.029), and smoking status ( p =0.002). In the postmenopausal

women group, serum ferritin levels were associated with age

( p <0.001), BMI ( p <0.001), and alcohol behavior ( p =0.032).

(4)

Table 1. General characteristics

Variables Category Total

(n=16,096)

Men (n=6,840)

Women (n=9,256) Premenopausal

(n=4,916)

Postmenopausal (n=4,340)

Age (years) 20∼29 1,821 (11.3) 739 (10.8) 1,082 (22.0) None

30∼39 3,141 (19.5) 1,300 (19.0) 1,835 (37.3) 6 (0.2)

40∼49 2,983 (18.5) 1,310 (19.2) 1,512 (30.8) 161 (3.7)

50∼59 3,116 (19.4) 1,300 (19.0) 487 (9.9) 1,473 (33.9)

60∼69 2,680 (16.7) 1,207 (17.6) None 1,428 (32.9)

≥70 2,355 (14.6) 984 (14.4) None 1,272 (29.3)

Smoking status Non-smoker 9,699 (60.3) 1,417 (20.7) 4,251 (86.5) 4,031 (92.9)

Ex-smoker 3,141 (19.5) 2,659 (38.9) 344 (7.0) 138 (3.2)

Current smoker 3,256 (20.2) 2,764 (40.4) 321 (6.5) 171 (3.9) Alcohol behavior No Drinking 4,758 (29.6) 1,231 (18.0) 1,298 (26.4) 2,229 (51.4)

Drinking<once a week 3,026 (18.8) 694 (10.1) 1,345 (27.4) 987 (22.7) Drinking≥once a week 8,312 (51.6) 4,915 (71.9) 2,273 (46.2) 1,124 (25.9) Physical activity No exercising 11,696 (72.7) 6, 204 (90.7) 4,552 (92.6) 3,942 (90.8) Current exercising 4,400 (27.3) 636 (9.3) 364 (7.4) 398 (9.2)

MSS 0 4,570 (28.4) 1,730 (25.3) 2,301 (46.8) 539 (12.4)

1 4,102 (25.5) 1,791 (26.2) 1,364 (27.7) 947 (21.8)

2 3,446 (21.4) 1,637 (23.9) 703 (14.3) 1,106 (25.5)

3 2,395 (14.9) 1,100 (16.1) 354 (7.2) 941 (21.7)

≥4 1,583 (9.8) 582 (8.5) 194 (3.9) 807 (18.6)

MetS MSS<3 12,118 (75.3) 5,158 (75.4) 4,368 (88.9) 2,592 (59.7)

MSS≥3 3,978 (24.7) 1,682 (24.6) 548 (11.1) 1,748 (40.3)

BMI (kg/m

2

) 23.67±3.37 24.02±3.13 22.62±3.53 24.29±3.28

WM (cm) 81.13±9.95 84.58±8.87 75.37±9.42 82.21±9.22

SBP (mmHg) 119.81±17.31 122.43±15.88 109.61±13.76 127.22±17.89

DBP (mmHg) 76.28±10.48 79.16±10.57 72.12±9.40 76.47±9.94

TC (mg/dL) 189.89±36.42 188.15±35.67 181.95±33.57 201.61±37.73

TG (mg/dL) 130.76±101.71 152.18±121.56 96.56±71.62 135.73±84.84

HDL-C (mg/dL) 52.63±12.81 49.30±11.98 57.35±12.82 52.53±12.38

FBG (mg/dL) 97.78±22.19 100.58±24.30 91.35±16.48 100.64±22.83

Ferritin (ng/mL) 77.40±65.50 115.89±72.12 32.50±29.53 67.57±44.86

n (%), M±SD.

Abbreviation: MSS, metabolic syndrome score; MetS, metabolic syndrome; BMI, body mass index; WM, waist measurement; SBP, systolic blood pressure; DBP, diastolic blood pressure; TC, total cholesterol; TG, triglyceride; HDL-C, high density lipoprotein cholesterol; FBG, fasting blood glucose.

3. Serum ferritin levels by MetS and MSS

Means comparisons of serum ferritin levels by MetS and MSS are shown in Table 3 and 4. In men and premenopausal women groups, serum ferritin levels were associated with all components of the MetS. However, in the postmenopausal women group, serum ferritin levels were not associated with elevated blood pressure ( p =0.397). After modification of associate variable of serum ferritin levels, its mean value (M±SE) was significantly higher ( p <0.001) in the MetS group (men, 132.25±1.98 ng/mL; premenopausal women, 39.89±1.49 ng/mL; postmenopausal women, 73.45±1.14 ng/mL) than the non- MetS group (men, 111.08±1.01 ng/mL;

premenopausal women, 32.26±0.50 ng/mL; postmenopausal women, 63.26±0.98 ng/mL). In addition, serum ferritin levels increased as MSS increased in all three gender-based groups ( p <0.001).

Discussion

The present study investigated the association between

serum ferritin levels and MetS and MSS using data from

KNHANES V, conducted in 2010 to 2012. When adjusted for

variables associated with serum ferritin levels, the MetS and

MSS were significantly associated with an increasing of serum

ferritin levels in all gender-based groups (men, premenopausal

(5)

Table 2. Serum ferritin levels according to general characteristics

Variables Category Men (n=6,840) Women (n=9,256)

Premenopausal (n=4,916) Postmenopausal (n=4,340) Ferritin (ng/mL) p -value Ferritin (ng/mL) p -value Ferritin (ng/mL) p -value

Age (years) 20∼29 112.82±64.80 <0.001 33.02±25.68 <0.001 None <0.001

30∼39 128.30±71.96 31.26±29.02 74.49±41.43

40∼49 121.66±70.58 29.73±28.40 69.39±44.29

50∼59 114.71±72.25 36.24±29.45 64.82±42.76

60∼69 109.13±72.91 None 66.40±42.58

≥70 104.00±75.37 None 71.81±49.35

BMI (kg/m

2

) <25 109.60±69.07 <0.001 31.33±28.22 <0.001 65.56±43.90 <0.001

≥25 127.52±76.11 36.85±33.59 70.98±46.31

TC (mg/dL) <200 111.94±70.84 <0.001 31.89±27.67 0.029 67.39±45.61 0.789

≥200 123.17±73.87 34.15±33.94 67.75±44.14

Smoking status Non-smoker 110.25±67.82 <0.001 31.93±29.62 0.002 67.30±44.26 0.355

Ex- smoker 113.85±73.85 35.44±30.65 70.83±47.65

Current smoker 120.75±72.28 36.99±26.45 71.32±55.59

Alcohol behavior No drinking 96.70±66.35 <0.001 33.14±32.25 0.053 66.28±45.25 0.032

Drinking<once a month 106.99±64.99 30.74±27.87 67.11±44.20

Drinking≥once a month 121.96±73.49 33.19±28.81 70.54±44.59

Physical activity No exercising 116.86±72.62 0.087 31.70±28.65 0.589 67.75±45.26 0.382

Current exercising 111.89±68.02 32.56±28.90 65.68±40.53

M±SD.

Abbreviation: ‘See Table 1’.

Table 3. Serum ferritin levels according to MetS components

Variables Category Men (n=6,840)

Women (n=9,256) Premenopausal

(n=4,916)

Postmenopausal (n=4,340) Ferritin (ng/mL) p -value Ferritin (ng/mL) p -value Ferritin (ng/mL) p -value

BP (mmHg) Normal 113.67±69.62 <0.001 31.89±28.18 0.002 67.04±43.62 0.397

Elevated blood pressure 119.16±75.53 36.80±37.31 68.20±46.32

WM (cm) Normal 111.27±69.15 <0.001 31.04±28.03 <0.001 64.20±43.62 <0.001

Abdominal obesity 129.04±78.49 36.36±32.86 69.88±45.56

TG (mg/dL) Normal 107.23±66.89 <0.001 31.87±28.68 0.001 64.86±42.15 <0.001

Elevated triglyceride 130.86±78.12 36.66±34.33 73.23±49.58

HDL-C (mg/dL) Normal 113.86±70.99 <0.001 31.20±27.62 <0.001 64.00±42.15 <0.001

Reduced HDL-C 123.82±75.83 35.73±33.58 72.05±47.74

FBG (mg/dL) Normal 110.17±67.59 <0.001 31.25±27.60 <0.001 63.81±42.04 <0.001

Elevated FBG 126.87±78.95 41.25±39.47 74.46±48.95

MetS MSS<3 110.03±68.41 <0.001 31.33±27.86 <0.001 63.53±41.11 <0.001

MSS≥3 133.86±79.83 41.88±39.24 73.56±49.32

MSS 0 102.27±68.87 <0.001 30.24±26.10 <0.001 59.40±35.36 <0.001

1 108.39±66.95 30.85±26.99 62.76±41.73

2 120.03±75.93 35.81±34.01 66.21±42.99

3 131.45±77.92 41.34±39.12 69.89±49.16

≥4 138.41±83.19 42.86±39.53 77.84±49.19

M±SD.

Abbreviation: ‘See Table 1’.

Normal is defined as WM <90 cm in men or <80 cm in women, Abdominal obesity is defined as WM≥90 cm in men or ≥80 cm

in women, Elevated triglyceride is defined as TG ≥150 mg/dL, Normal is defined as HDL-C≥40 mg/dL in men or ≥50 mg/dL in women,

Reduced HDL-C is defined as HDL-C <40 mg/dL in men or <50 mg/dL in women, Normal is defined as FBG<100 mg/dL, Elevated

FBG is defined as FBG≥100 mg/dL, Normal is defined as SBP<130 mmHg or DBP<85 mmHg, Elevated blood pressure is defined

as SBP≥130 mmHg or DBP≥85 mmHg.

(6)

Table 4. Comparisons of serum ferritin levels for MetS and MSS

Variables Men (n=6,840) Women (n=9,256)

Premenopausal (n=4,916) Postmenopausal (n=4,340) Ferritin (ng/mL)* p -value Ferritin (ng/mL)** p -value Ferritin (ng/mL)*** p -value MSS 0 103.05±1.86

(99.40∼109.70)

<0.001 30.72±0.79

(29.16∼32.27)

<0.001 60.61±2.05

(56.59∼64.64)

<0.001

1 109.93±1.68

(106.64∼113.21)

31.11±0.69 (29.77∼32.45)

63.13±1.48 (60.23∼66.04)

2 120.25±1.75

(116.81∼123.69)

34.95±1.18 (32.63∼37.27)

66.03±1.34 (63.41∼68.66)

3 129.60±2.21

(125.27∼133.93)

39.80±1.68 (36.50∼43.10)

69.52±1.48 (66.62∼72.42)

≥4 134.90±3.09

(128.84∼140.95)

39.98±2.25 (35.58∼44.39)

77.37±1.64 (74.15∼80.60) Non-MetS 111.08±1.01

(109.10∼113.05)

<0.001 32.26±0.50

(31.28∼33.24)

<0.001 63.26±0.98

(61.34∼65.18)

<0.001

MetS 132.25±1.98

(128.36∼136.14)

39.89±1.49 (36.97∼42.82)

73.45±1.14 (71.22∼75.68) M±SE.

Abbreviation: ‘See Table 1’.

*adjusted for age, BMI, TC, alcohol behavior, and smoking status **adjusted for age, BMI, TC, and smoking status ***adjusted for age, BMI, and alcohol behavior.

women, and postmenopausal women) (Table 4).

Serum ferritin is used as a clinical biomarker to evaluate iron status, and elevated serum ferritin concentration has been reported to be associated with the risk factors of cardiovascular disease such as diabetes mellitus, insulin resistance, and hypertension [6-9]. Each component of MetS is a risk factor for coronary artery disease, and MetS in which the components occur in a cluster with resistance to insulin is a useful indicator to identify groups at a high risk for car- diovascular disease [27,28].

Among previous studies on serum ferritin concentration and MetS, Li and colleagues reported that serum ferritin levels were positively associated with MetS in both Chinese men and women [29]. Moreover, Vari and colleagues reported that serum ferritin levels were positively associated with MetS in French men and premenopausal women and postmenopausal women [14]. On the other hand, in a study with US adults, Jehn and colleagues reported that serum ferritin levels were positively associated with MetS in premenopausal women and postmenopausal women, but not in men [20]. Moreover, in a study on Korean adults, Jeong and colleagues reported that serum ferritin levels were positively associated with MetS in men, but not in women [30]. In addition, Ryu and colleagues reported that serum ferritin levels were not

associated with MetS in both men and women [18]. It is believed that the inconsistencies in previous domestic and foreign studies on serum ferritin concentration and MetS is due to the fact that serum ferritin levels vary across countries and races, and that previous studies targeted specific age groups and populations, such as adolescents, the aged, sexuality, the obese, and diabetes. The present study used the data of the entire adult population aged 20 and older from the KNHANES V data (2010∼2012), which is representative of the Korean population. The results of our study showed that serum ferritin level of the MetS group was higher than that of the non-MetS group ( p <0.001) in the each of the gender-based groups. These results are consistent with previous studies [14,29] that did find significant differences in serum ferritin related to MetS.

In addition to metabolic syndrome defined by NCEP-ATP

III standards, the present study examined serum ferritin levels

for increases in MetS components. Research on the association

between serum ferritin levels and the increase of MetS

components is rare. In a cross-sectional study among Italians,

Bozzini and colleagues reported that the mean ferritin level

was higher in the MetS group than in the non-MetS group and

increased linearly with the increasing number of MetS

components in Italian adults (mean values of 60.7 ng/mL,

(7)

105.3 ng/mL, and 142.3 ng/mL for none, one to three, and more than three MetS components, respectively, p <0.001) [31]. Avila and colleagues investigated the association between hyperferritinemia and iron consumption in Chileans, finding that the mean value of serum ferritin increases significantly with the number of risk factors related to MetS ( p =0.043) [32]. In addition, Jehn and colleagues investigated the association between serum ferritin and risk of the MetS in U.S. adults, and the trend of increasing mean ferritin values across categories of MetS components was significant for all three groups ( p <0.05) [20]. In the present study results, all of the variables, such as abdominal obesity, reduced HDL-C, elevated TG, elevated FBG, and elevated blood pressure, showed a significant difference in serum ferritin levels in both men and premenopausal women, but the elevated blood pressure showed no significant difference in postmenopausal women. Nevertheless, serum ferritin levels significantly increased with the increase in MetS components among the all of the gender-based group ( p <0.001).

Iron is an essential trace element for the human body, involved in cellular processes and a key component of various enzymes and is a transition metal capable of causing oxidative tissue damage by catalyzing the formation of free radicals [33]. Wilson and his colleagues have suggested that iron deposition in pancreatic beta cells may also impair insulin secretion in more advanced states of iron overload [34]. In addition, in a study by Niederau and his colleagues, results of oral glucose tolerance tests in patients with hemochromatosis have suggested that hepatic iron overload results in impaired insulin extraction [35]. Therefore, increase of iron stores may contribute to insulin resistance through mechanisms related to both reduced extraction of insulin and impaired insulin secretion.

The association between serum ferritin concentration and individual components of MetS varies between countries and races. In the present study results, although individual metabolic syndrome components may not be associated with serum ferritin concentration according to sex, increases of its components were positively associated with the serum ferritin concentration. In conclusion, MetS was associated

with an increase in serum ferritin levels in Korean adults among all of the gender-based groups (men, premenopausal women, and postmenopausal women). As one of the reason for these results, we speculate that serum ferritin levels are increased with the MetS components increasing.

This study has several limitations. First, serum ferritin is an acute-phase reactant and may be increased under inflam- matory conditions. We could not adjust for CRP as an inflammatory marker because it was not checked KNHANES V. Second, the information for dietary intake, which may influence body iron stores, is not concluded. Third, we could not analyze comprehensively the association of serum ferritin and MetS, due to lack of other iron-related markers such as trans-ferritin and total iron-binding capacity as a marker of body iron status. Fourth, because this study was a cross-sectional study, the ability to establish a causal relationship between serum ferritin and the MetS and increase of its components was limited. Therefore, more accurate results might be obtained by performing a cohort study.

요 약

본 연구는 국가자료인 2010∼2012년도 국민건강영양조사 자 료를 이용하여 제 2형 당뇨병을 가진 대한민국 20세 이상 성인 16,096명(남성, 6,840명; 폐경 전 여성, 4,916명; 폐경 후 여성, 4,340명)을 대상으로 대사증후군(MetS) 및 대사증후군 위험요소 의 증가(MSS)와 혈청 Ferritin수준의 관련성을 평가하고자 실시하 였다. 대사증후군의 발생률은 16,096명 중 3,978명으로 24.7%

(남성, 24.6%; 폐경 전 여성, 11.1%; 폐경 후 여성, 40.3%)이었다.

본 연구의 주요결과는 첫째, 관련변수를 보정한 후의 결과에서, 혈

청 ferritin 수준은 비 대사증후군(남성, 111.08±1.01 ng/mL; 폐

경 전 여성, 32.26±0.50 ng/mL; 폐경 후 여성, 63.26±0.98

ng/mL)에 비하여 대사증후군(남성, 132.25±1.98 ng/mL; 폐경

전 여성, 39.89±1.49 ng/mL; 폐경 후 여성, 73.45±1.14 ng/mL)

에서 유의하게 증가하였다( p <0.001). 둘째, 남성과 폐경 전 및 폐

경 후 여성 모두에서, 혈청 ferritin 수준은 대사증후군 위험요소의

증가함에 따라 증가하였다( p <0.001). 결론적으로, 대한민국 성인

에서 대사증후군 및 대사증후군 위험요소의 증가는 혈청 ferritin

수준을 증가시킨다.

(8)

Acknowledgements: None Funding: None

Conflict of interest: None

References

1. Heeney MM, Andrews NC. Iron homeostasis and inherited iron overload disorders: an overview. Hematol Oncol Clin North Am. 2004;18(6):1379-1403.

2. Crichton RR. Inorganic biochemistry of iron metabolism. 3rd ed. New York: Ellis Horwood; 1991. p.29-58.

3. Halliwell B, Gutteridge JM. Role of free radicals and catalytic metal ions in human disease: an overview. Methods Enzymol.

1990;186:1-85.

4. Cook JD, Flowers CH, Skikne BS. The quantitative assessment of body iron. Blood. 2003;101(9):3359-3364.

5. Halliwell B. Oxidative stress, nutrition and health. Experi- mental strategies for optimization of nutritional antioxidant in- take in humans. Free Radic Res. 1996;25(1):57-74.

6. Jiang R, Manson JE, Meigs JB, Ma J, Rifai N, Hu FB. Body iron stores in relation to risk of type 2 diabetes in apparently healthy women. JAMA. 2004;291(6):711-717.

7. Jehn ML, Guallar E, Clark JM, Couper D, Duncan BB, Ballantyne CM, et al. A prospective study of plasma ferritin level and in- cident diabetes: The atherosclerosis risk in communities (ARIC) study. Am J Epidemiol. 2007;165(9):1047-1054.

8. Piperrno A, Trombini P, Gelosa M, Mauri V, Pecci V, Verqani A, et al. Increased serum ferritin is common in men with essential hypertension. J Hypertens. 2002;20(8):1513-1518.

9. Cho YS, Kang JH, Kim SA, Shim KW, Lee HS. Association of se- rum ferritin and abdominal obesity and insulin resistance. J Korean Soc Study Obes. 2005;14(2):76-81.

10. Reaven GM. Role of insulin resistance in human disease.

Diabetes. 1988;37(12):1598-1607.

11. Isomaa B, Almgren P, Torsen B, Laht K, Nissen M, Taskinen MR, et al. Cardiovascular morbidity and mortality associated with the metabolic syndrome. Diabetes Care. 2001;24(4):683-689.

12. McNeill AM, Rosamond WD, Girman CK, Golden SH, Schmidt ML, East HE, et al. The metabolic syndrome and 11-year risk of incident cardiovascular disease in the atherosclerosis Risk in Communities Study. Diabetes Care. 2005;28(2):385-390.

13. Thomas Jr FW. Metabolic syndrome, peripheral vascular dis- ease and coronary artery disease: A concise review. Int J Angiol.

2010;19(3):e96-99.

14. Vari IS, Balkau B, Kettaneh A, Andre P, Tichet J, Fumeron F, et al. Ferritin and transferring are associated with metabolic syn- drome abnormalities and their change over time in a general population: Data from an Epidemiological Study on the Insulin Resistance Syndrome (DESIR). Diabetes Care. 2007;30(7):1795- 1801.

15. Ferrannini E. Insulin resistance, iron and liver. Lancet. 2000;

355(9222):2181-2182.

16. Li J, Wang R, Luo D, Li S, Xiao C. Association between serum ferritin levels and risk of the metabolic syndrome in Chinese adults: a population study. PLoS One. 2013;8(9):e74168. doi:

10.1371/journal.pone.0074168.

17. Raghavendra BM, Bharath MS, Veeranna Gowda KM, Ahmed MF, Yashavanth HS. Study of serum ferritin as a component of metabolic syndrome. IJSR. 2014;3(12):2383-2385.

18. Ryu SY, Kim KS, Park J, Kang MG, Han MA. Serum ferritin and risk of the metabolic syndrome in Korean rural residents. J Prev Med Public Health. 2008;41(2):115-120.

19. Marjani A, Akbari FA, Eshghinia S. Association between trace el- ements and metabolic syndrome among type 2 diabetes melli- tus patients in Gorgan. Asian J Pharm Clin Res. 2015;8(3):

358-362.

20. Jehn M, Clark JM, Guallar E. Serum ferritin and risk of the meta- bolic syndrome in US adults. Diabetes Care. 2004;27(10):

2422-2428.

21. Sheu WH, Chen YT, Lee WJ, Wang CW, Lin LY. A relationship between serum ferritin and insulin resistance syndrome is pres- ent in non-diabetic woman but non-diabetic men. Clin Endocrinol. 2003;58(3):380-385.

22. Mainous AG, Wells BJ, Everett CJ, Gill JM, King DE. Association of ferritin and lipids with C-reactive protein. Am J Cardiol.

2004;93(5):559-562.

23. Milman N, Byg KE, Ovesen L, Kirchhoff M, Jűrgensen KS. Iron status in Danish women 1984-1994: a cohort comparison of changes in iron stores and the prevalence of iron deficiency and iron overload. Eur J Haematolog. 2003;71(1):51-61.

24. Ministry of Health and Welfare, Korea centers for disease con- trol and prevention. Korea health statistics 2010: Korea na- tional health and nutrition examination survey (KNHANES V-1) [cited by 2016 November 10] available from: https://knhanes.

cdc.go.kr/knhanes/index.do.

25. WHO. Western pacific region. International association for the study of obesity task force, the asia-pacific perspective: re- defining obesity and its treatment. Sydney: Health communica- tions Australia; 2000. p15-21.

26. Yoon H, Kim GS, Kim SG, Moon AE. The Relationship between metabolic syndrome and increase of metabolic syndrome score and serum vitamin D levels in Korean adults: 2012 Korean National Health and Nutrition Examination Survey. J Clin Biochem Nutr. 2015;57(1):82-87.

27. Meigs JB. Invited Commentary: Insulin resistance syndrome syndrome X multiple metabolic syndrome a syndrome at all factor analysis reveals patterns in the fabric of correlated meta- bolic risk factors. Am J Epidemiol. 2000;152(10):908-911.

28. Grundy SM. Metabolic syndrome: a multiplex cardiovascular risk factor. J Clin Endocrinol Metab. 2007;92(2):399-404.

29. Li J, Wang R, Luo D, Li S, Xiao C. Association between serum ferritin levels and risk of the metabolic syndrome in Chinese adults: A population study. PLoS One. 2013;8(9):e74168.

30. Jeong DW, Lee HW, Cho YH, Yi DW, Lee SY, Son SM, et al.

Comparison of serum ferritin and vitamin d in association with the severity of nonalcoholic fatty liver disease in Korean adults.

Endocrinol Metab. 2014;29(4):479-488.

31. Bozzini C, Girelli D, Olivieri O, Martinelli N, Bassi A, De Matteis G, et al. Prevalence of body iron excess in the metabolic syndrome. Diabetes Care. 2005;28(8):2061-2063.

32. Avila F, Echeverría G, Pérez D, Martinez C, Strobel P, Castillo O,

et al. Serum ferritin is associated with metabolic syndrome and

(9)

red meat consumption. Oxid Med Cell Longev. 2015;2015:

e769739.

33. Wolff SP. Diabetes mellitus and free radicals: free radicals, tran- sition metals and oxidative stress in the aetiology of diabetes mellitus and complications. Br Med Bull. 1993;49(3):642-652.

34. Wilson JG, Lindquist JH, Grambow SC, Crook ED, Maher JF.

Potential role of increased iron stores in diabetes. Am J Med Sci.

2003;325(6):332-339.

35. Niederau C, Berger M, Stremmel W, Starke A, Strohmeyer G, Ebert R, et al. Hyperinsulinaemia in non-cirrhotic haemochro- matosis: impaired hepatic insulin degradation? Diabetologia.

1984;26(6):441-444.

수치

Table  1.  General  characteristics
Table  2.  Serum  ferritin  levels  according  to  general  characteristics
Table  4.  Comparisons  of  serum  ferritin  levels  for  MetS  and  MSS

참조

관련 문서

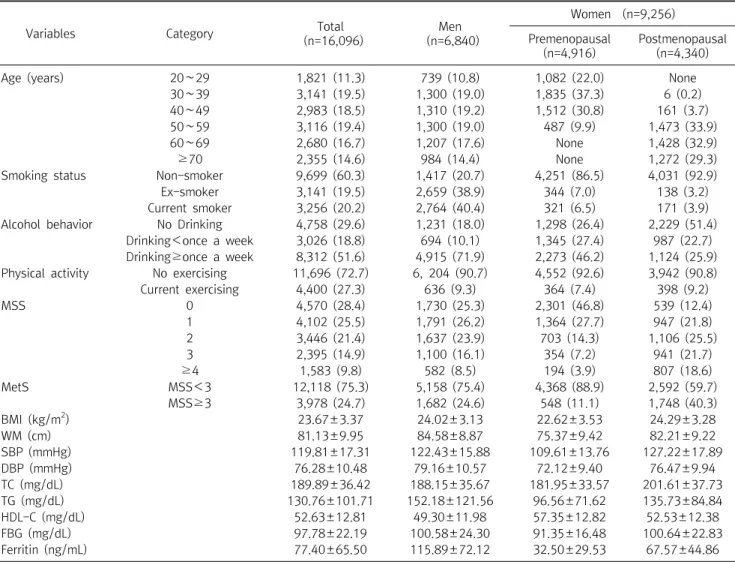
FBG: fasting blood glucose, TC: total cholesterol, TG: triglyceride, HDL-C: high density lipoprotein-cholesterol, LDL-C: low density lipoprotein-cholesterol,

Serum uric acid levels and risk for vascular disease in patients with metabolic syndrome... Prevalence if the metabolic syndrome in a Turkish

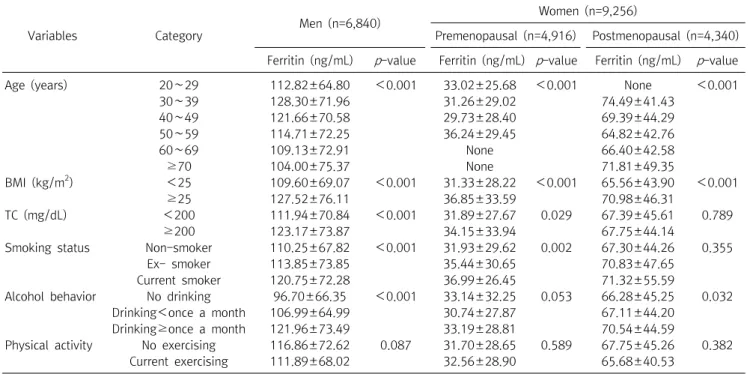
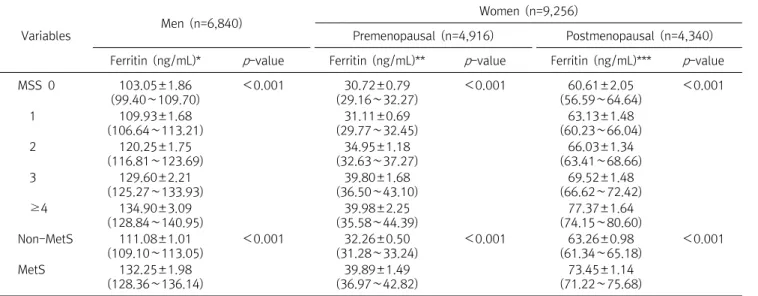
In this study, it can be seen that sex and metabolic syndrome are important for biological factors, and occupation, smoking, and exercise are important

This study was conducted to analyze the effects of obesity on the core stability and metabolic syndrome risk factors of middle - aged women.. The effect

An investigation of adults with Asperger syndrome or high functioning autism, and normal sex differences.. The facilitation of social-emotional understanding

In addition, measurements at 0 and 12 weeks (body composition, α-amylase, metabolic syndrome related factors) were performed twice. For 12 weeks, the

The median concentrations of FDP were significantly elevated ( p= 0.02) and the median concentrations of fibronogen were decreased ( p= 0.021) in abnormal bleeding patients

To quantify ignitability as ignition characteristics, the minimum ignition energy (MIE) for liquid fuel was defined and measured under elevated