JNM Journal of Neurogastroenterology and Motility
Received: July 20, 2018 Revised: November 8, 2018 Accepted: November 27, 2018
This is an Open Access article distributed under the terms of the Creative Commons Attribution Non-Commercial License (http://creativecommons.
org/licenses/by-nc/4.0) which permits unrestricted non-commercial use, distribution, and reproduction in any medium, provided the original work is properly cited.
*Correspondence: Kyoung Sup Hong and Kyung Sik Park are equally responsible for this work.
Kyoung Sup Hong, MD, PhD
Department of Gastroenterology, Mediplex Sejong Hospital, 20 Gyeyangmunhwa-ro, Gyeyang-gu, Incheon 21080, Korea Tel: +82-32-240-8547, Fax: +82-32-240-8094, E-mail: kshong1@empas.com
Kyung Sik Park, MD, PhD
Department of Internal Medicine, Keimyung University School of Medicine, 56 Dalseong-ro, Jung-gu, Daegu 41931, Korea Tel: +82-53-250-7088; Fax: +82-53-250-7442; E-mail: seenae99@dsmc.or.kr
Hyo Jeong Lee and Hyun Jin Kim contributed equally to this work.
Self-reported Food Intolerance in Korean Patients With Irritable Bowel Syndrome
Hyo Jeong Lee,
1Hyun Jin Kim,
2Eun Hee Kang,
1Kee Wook Jung,
3Seung-Jae Myung,
3Yang Won Min,
4Chang Hwan Choi,
5Han Seung Ryu,
6Jong Kyoung Choi,
7Joong Goo Kwon,
8Kyoung Sup Hong,
9,10* and Kyung Sik Park
11*
1
Health Screening and Promotion Center, Asan Medical Center, University of Ulsan College of Medicine, Seoul, Korea;
2Department of Internal Medicine, Gyeongsang National University Changwon Hospital, Changwon, Korea;
3Department of Gastroenterology, Asan Medical Center, University of Ulsan College of Medicine, Seoul, Korea;
4Department of Medicine, Samsung Medical Center, Sungkyunkwan University School of Medicine, Seoul, Korea;
5Department of Internal Medicine, Chung-Ang University College of Medicine, Seoul, Korea;
6Department of Internal Medicine, Wonkwang University College of Medicine and Digestive Disease Research Institute, Iksan, Jeollabuk-do, Korea;
7Department of Internal Medicine, National Medical Center, Seoul, Korea;
8Department of Internal Medicine, Catholic University of Daegu School of Medicine, Daegu, Korea;
9Department of Internal Medicine and Liver Research Institute, Seoul National University College of Medicine, Seoul National University Hospital, Seoul, Korea;
10Department of Gastroenterology, Mediplex Sejong Hospital, Incheon, Korea (Current address); and
11
Department of Internal Medicine, Keimyung University School of Medicine, Daegu, Korea
Background/Aims
Various foods trigger and/or worsen the symptoms of irritable bowel syndrome (IBS). However, Korean food-related gastrointestinal (GI) symptoms in IBS patients have not yet been investigated. This study aims to evaluate the prevalence of self-reported food intolerance in Korean IBS patients and determine the Korean food items and food groups perceived by patients to worsen their GI symptoms.
Methods
We recruited 393 study subjects, comprising 101 IBS patients, 167 symptomatic non-IBS subjects, and 125 control subjects. All participants completed a questionnaire to identify the most problematic foods and assess the occurrence of GI symptoms caused by 119 Korean food items. They also completed the validated Rome III questionnaire for IBS.
Results
The prevalence of self-reported food intolerance in Korean IBS patients was 79.2%, which was significantly higher than that in control subjects (44.8%, P < 0.001). The most problematic foods reported by IBS patients who experienced food intolerance were high-fat foods (25.0%), gluten foods (23.8%), spicy foods (15.0%), and dairy products (15.0%). A total of 63.4% of IBS patients reported GI symptoms related to the consumption of foods high in fermentable oligo-, di-, mono-saccharides, and polyols (FODMAP), while 48.5% of IBS patients reported symptoms associated with high-fat foods. Gas problems and loose stools were the most frequently reported symptoms.
Conclusions
A large proportion of Korean IBS patients complained of intolerance to certain food items, with high-fat and high-FODMAP foods being the main triggers. This study provides a basis for planning food intervention studies for Korean IBS patients.
(J Neurogastroenterol Motil 2019;25:222-232) Key Words
Diet; Food intolerance; Irritable bowel syndrome; Surveys and questionnaires
Introduction
Irritable bowel syndrome (IBS) is a chronic functional bowel disorder characterized by recurrent abdominal pain related to defecation or altered bowel habits.
1IBS affects about 10.0% of the population worldwide; in Korea, the prevalence of IBS has been reported to be 6.6-8.0%.
2-5IBS is a chronic relapsing disease that greatly impairs quality of life (QOL) and imposes a considerable economic burden on society.
6,7Most IBS patients attribute their symptoms to food, and avoid or reduce their consumption of specific foods to minimize their symptoms.
8,9One Swedish study found that self-reported food intolerance is associated with a high symptom burden and reduced QOL.
10Therefore, dietary recommendations and guidelines for IBS, such as those published by the British Dietetic Association and the National Institute for Health and Care Excellence, are widely used in clinical practice despite a lack of solid evidence.
11Diets low in fermentable oligo-, di-, mono-saccharides, and polyols (FODMAP) have emerged as a first-line therapy for pa- tients with IBS. Many randomized controlled trials have reported that low-FODMAP diets efficiently alleviate gastrointestinal (GI) symptoms in about 70% of IBS patients, and this outcome is similar to that of traditional IBS dietary advice.
12-16Low-FODMAP diets are already being used in clinical practice in Western countries.
In fact, a smartphone application (the Monash University Low FODMAP diet App) has been developed to help determine the FODMAP content of foods.
17,18However, the applicability and usefulness of low-FODMAP diets may vary according to the di- etary patterns of different countries.
Although the pathophysiology of IBS is still not fully under- stood, it may involve multiple factors, including visceral hypersensi- tivity, abnormal GI motility, an altered brain-gut axis, psychological disturbances, and low-grade inflammation.
19Multiple putative mechanisms by which foods or their components affect the gut and interact with the pathophysiology of IBS in various ways determine the type and intensity of IBS symptom.
20Food questionnaires are employed in studies to demonstrate the relationship between food and symptoms; however, standardized questionnaires cannot be used because foods widely vary among different countries. To date, almost all studies investigating the association between IBS and food have been conducted in Western countries and with Western foods, and there has been little research on Asian IBS patients, who have very different dietary behaviors from those of the Western population. Likewise, Korean food items that worsen GI symptoms
in Korean IBS patients have not been evaluated, and the character- istics of Korean foods, such as diversity, various food components, and complex cooking methods, make this endeavor more difficult.
Thus, the evidence required to apply new dietary treatments to Ko- rean IBS patients is still lacking.
Therefore, the aims of this study are to investigate the preva- lence of self-reported food intolerance in Korean IBS patients and determine the Korean food items and food groups perceived by patients to worsen their GI symptoms.
Materials and Methods Study Population
This study included Korean participants aged 18-80 years who visited gastroenterology outpatient clinics at 9 tertiary hospitals in South Korea between January 2016 and February 2017. Asymp- tomatic adults were also recruited through public advertisements.
Subjects were excluded if they had malignant disease, inflamma- tory bowel disease, had been diagnosed with any organic disease causing GI symptoms within the last 6 months (gastric ulcer, acute gastroenteritis, cholecystitis, cholangitis, pancreatitis, appendicitis, liver abscess, acute hepatitis, etc), had a severe underlying disease, or were unwilling or unable to complete the questionnaire.
Subjects were allocated to one of the following 3 groups based on their medical history and Rome III symptom data: control group, healthy subjects not reporting GI symptoms and with no underlying organic disease; symptomatic non-IBS group, patients reporting symptoms of abdominal pain or discomfort during the last 3 months but not meeting the Rome III criteria for IBS and with no underlying organic disease; or IBS group, patients report- ing symptoms and fulfilling the Rome III criteria for IBS but with no underlying organic disease.
21The study protocol was approved by the institutional review boards of all participating hospitals: Asan Medical Center (No.
2016-0050), Gyeongsang National University Changwon Hospi- tal (No. 2016-11-003), Samsung Medical Center (No. 2016-05- 072), Chung-Ang University College of Medicine (No. 1600-004- 253), Wonkwang University College of Medicine (No. WKUH 201607-HR-076), National Medical Center (No. H-1605-066- 005), Catholic University of Daegu School of Medicine (No. CR- 16-136), Seoul National University College of Medicine (No.
1512-090-728), and Keimyung University School of Medicine (No.
2016-01-008). Informed consent was obtained from all subjects.
Questionnaires
All subjects completed the questionnaire developed for data col- lection in the present study. The validated Korean Rome III ques- tionnaire was used to diagnose IBS.
22IBS symptom severity was assessed using the IBS Severity Scoring System.
23The overall IBS score ranged from 0 to 500, and patients were divided into 3 groups according to score, as follows: < 175, mild IBS; 175-300, moder- ate IBS; and > 300, severe IBS.
10The questionnaires evaluated the patients’ demographic and socioeconomic characteristics including age, sex, location, education, employment, income, marital status, alcohol consumption, and smoking history.
The questionnaire designed to assess self-reported food intoler- ance consisted of 2 question types. The first type had a multiple- choice format in which participants were asked to select the foods that worsen their GI symptoms among a list of 119 different food items included in the Korean food-frequency questionnaire (FFQ;
Supplementary Table 1).
24The second type had a short-answer format in which participants were asked whether they thought that food intake affects the occurrence of their GI symptoms and, if so, which food is the “most problematic” and which symptoms occur
“most frequently.” They were also asked whether they had “reduced or eliminated” their intake of certain foods to or made any dietary changes minimize their GI symptoms.
Data Analysis
Self-reported food intolerance was defined as present when the subjects reported food-related GI symptoms in the questionnaire.
The most common Korean food items causing GI symptoms in IBS patients were evaluated from the multiple-choice questionnaire using the 119 Korean food items included in the Korean FFQ. The most problematic foods causing GI symptoms for each group were evaluated using the short-answer questions.
All 119 Korean food items were categorized either as a “rarely problematic food item” or a “problematic food item” according to the difference in the proportion of subjects with GI symptoms as- sociated with each food item between the control groups and IBS patients (Supplementary Table 1). If the difference was statistically significant (P < 0.05), the food item was classified as “problematic”;
otherwise, it was classified as “rarely problematic.”
For the food group-based analysis, some food items included in the Korean FFQ were grouped according to different potentially symptom-causing contents. The list included high-FODMAP foods (36 food items),
18,25,26dairy products (7 food items), high- fat foods (17 food items), gluten foods (10 food items), caffeine-
containing foods (7 food items), and alcohol (6 food items) (Supplementary Table 2). All dairy products and gluten foods were included in the high-FODMAP food group.
In IBS patients, the most problematic food-induced GI symp- toms and the association between specific food groups and GI symptoms were evaluated using the short-answer questions. The association between self-reported food intolerance and IBS subtype or IBS symptom severity was assessed. The proportions of subjects who made dietary restrictions to minimize GI symptoms were com- pared between groups.
Statistical Methods
Differences in continuous variables between groups were evalu- ated using the Kruskal–Wallis test, and differences in categorical variables were evaluated using the χ
2test or Fisher’s exact test. Data analysis was performed using SPSS 20.0 (IBM Corp, Armonk, NY, USA). P-values < 0.05 were considered statistically signifi- cant.
Results
Clinical Characteristics of the Study Population
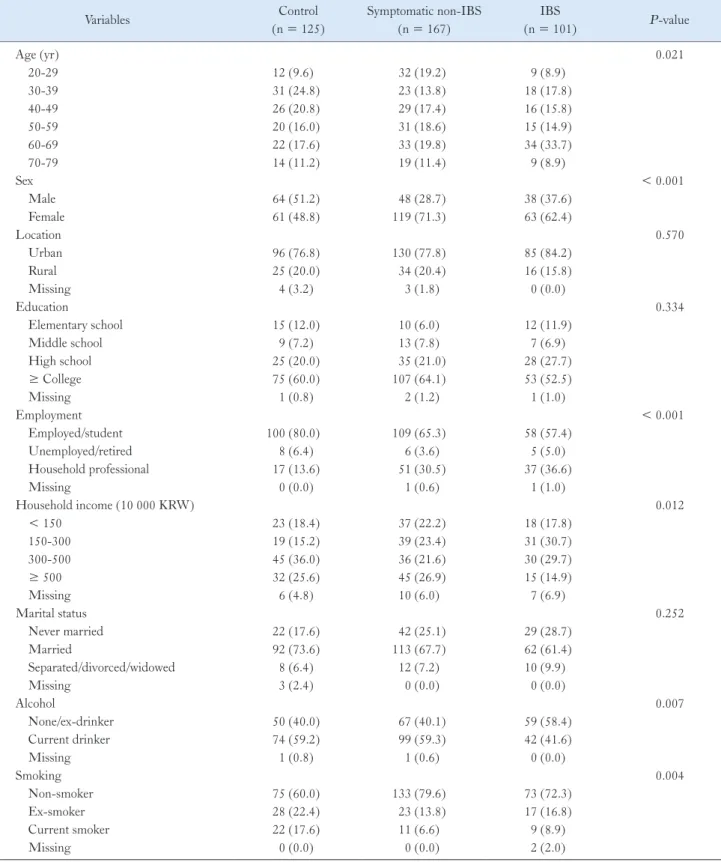
A total of 125 control subjects, 167 symptomatic non-IBS sub- jects, and 101 IBS patients were enrolled in this study. Of the 101 IBS patients, 10 had IBS with constipation (IBS-C) (9.9%), 44 had IBS with diarrhea (IBS-D) (43.6%), 43 had mixed IBS (42.6%), and 4 had unsubtyped IBS (4.0%). An intergroup comparison of clinical characteristics is shown in Table 1. The proportion of sub- jects aged > 60 years was slightly higher in the IBS group than in the control and symptomatic non-IBS groups (42.6% vs 28.8% and 31.2%; P = 0.021). The proportion of women was higher in the symptomatic non-IBS and IBS groups than in the control group (71.3% and 62.4% vs 48.8%; P < 0.001). The control group in- cluded higher proportions of employed and high-income subjects (P < 0.001 and P = 0.012, respectively). Current drinking and smoking rates were higher in the control group than in subjects with symptoms (P = 0.007 and P = 0.004, respectively). Loca- tion, education level, and marital status did not differ significantly between the groups.
Self-reported Food Intolerance and Korean Food
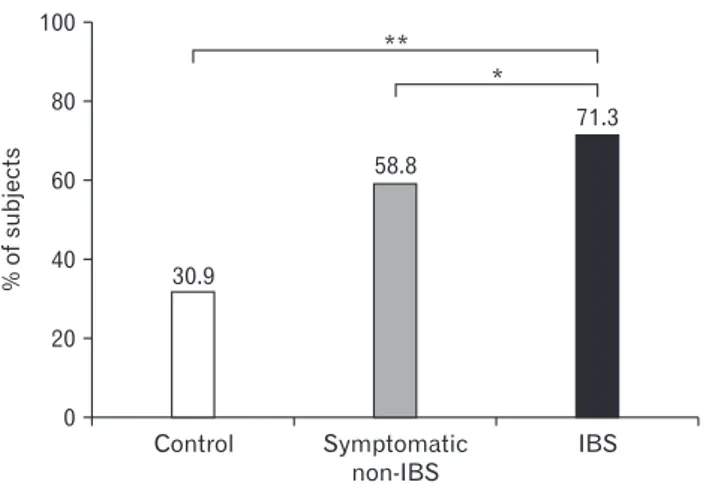
The prevalence of self-reported food intolerances was signifi-
cantly higher in the IBS and symptomatic non-IBS groups than in
the control group (79.2% and 74.3% vs 44.8%, P < 0.001; Fig. 1).
Table 1.
Demographic and Socioeconomic Characteristics of the Study Population
Variables Control
(n = 125)
Symptomatic non-IBS (n = 167)
IBS
(n = 101) P -value
Age (yr) 0.021
20-29 12 (9.6) 32 (19.2) 9 (8.9)
30-39 31 (24.8) 23 (13.8) 18 (17.8)
40-49 26 (20.8) 29 (17.4) 16 (15.8)
50-59 20 (16.0) 31 (18.6) 15 (14.9)
60-69 22 (17.6) 33 (19.8) 34 (33.7)
70-79 14 (11.2) 19 (11.4) 9 (8.9)
Sex < 0.001
Male 64 (51.2) 48 (28.7) 38 (37.6)
Female 61 (48.8) 119 (71.3) 63 (62.4)
Location 0.570
Urban 96 (76.8) 130 (77.8) 85 (84.2)
Rural 25 (20.0) 34 (20.4) 16 (15.8)
Missing 4 (3.2) 3 (1.8) 0 (0.0)
Education 0.334
Elementary school 15 (12.0) 10 (6.0) 12 (11.9)
Middle school 9 (7.2) 13 (7.8) 7 (6.9)
High school 25 (20.0) 35 (21.0) 28 (27.7)
≥ College 75 (60.0) 107 (64.1) 53 (52.5)
Missing 1 (0.8) 2 (1.2) 1 (1.0)
Employment < 0.001
Employed/student 100 (80.0) 109 (65.3) 58 (57.4)
Unemployed/retired 8 (6.4) 6 (3.6) 5 (5.0)
Household professional 17 (13.6) 51 (30.5) 37 (36.6)
Missing 0 (0.0) 1 (0.6) 1 (1.0)
Household income (10 000 KRW) 0.012
< 150 23 (18.4) 37 (22.2) 18 (17.8)
150-300 19 (15.2) 39 (23.4) 31 (30.7)
300-500 45 (36.0) 36 (21.6) 30 (29.7)
≥ 500 32 (25.6) 45 (26.9) 15 (14.9)
Missing 6 (4.8) 10 (6.0) 7 (6.9)
Marital status 0.252
Never married 22 (17.6) 42 (25.1) 29 (28.7)
Married 92 (73.6) 113 (67.7) 62 (61.4)
Separated/divorced/widowed 8 (6.4) 12 (7.2) 10 (9.9)
Missing 3 (2.4) 0 (0.0) 0 (0.0)
Alcohol 0.007
None/ex-drinker 50 (40.0) 67 (40.1) 59 (58.4)
Current drinker 74 (59.2) 99 (59.3) 42 (41.6)
Missing 1 (0.8) 1 (0.6) 0 (0.0)
Smoking 0.004
Non-smoker 75 (60.0) 133 (79.6) 73 (72.3)
Ex-smoker 28 (22.4) 23 (13.8) 17 (16.8)
Current smoker 22 (17.6) 11 (6.6) 9 (8.9)
Missing 0 (0.0) 0 (0.0) 2 (2.0)
IBS, irritable bowel syndrome; KRW, South Korean Won.
Values are presented as n (%).
The prevalence of self-reported food intolerance in IBS patients was not related to age, sex, education, employment, income, or marital status (P = 0.366, P = 0.117, P = 0.107, P = 0.329, P = 0.527, and P = 0.473, respectively).
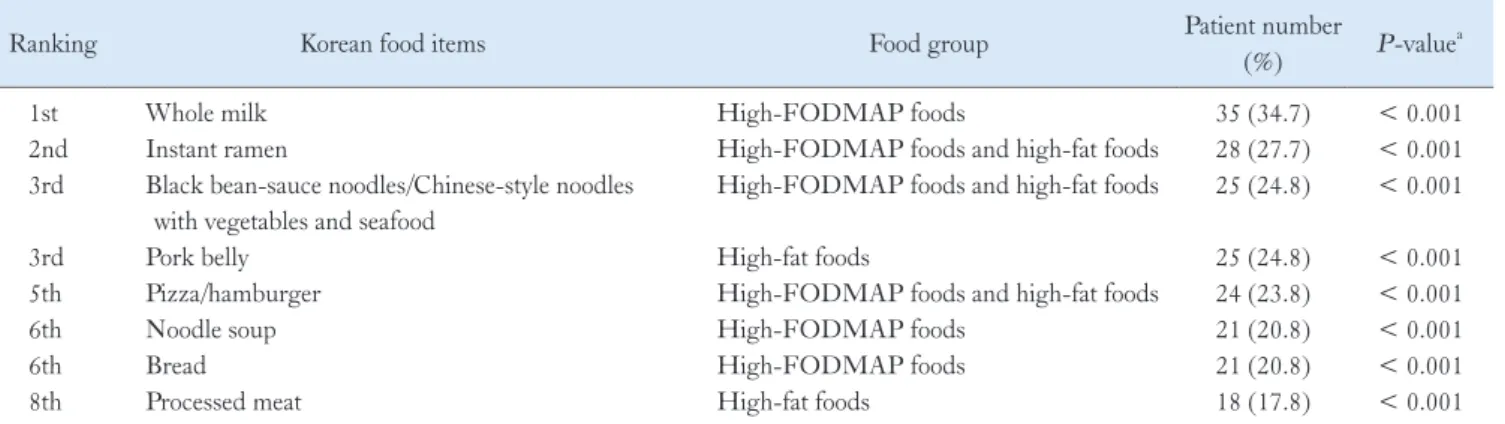
The most common Korean food item causing GI symptoms in IBS patients was whole milk (34.7%), followed by instant ra- men (27.7%), black bean-sauce noodles/Chinese-style noodles with vegetables and seafood (24.8%), pork belly (24.8%), and pizza/
hamburger (23.8%). For all food items listed in Table 2, a greater number of IBS patients than controls reported food-induced GI symptoms.
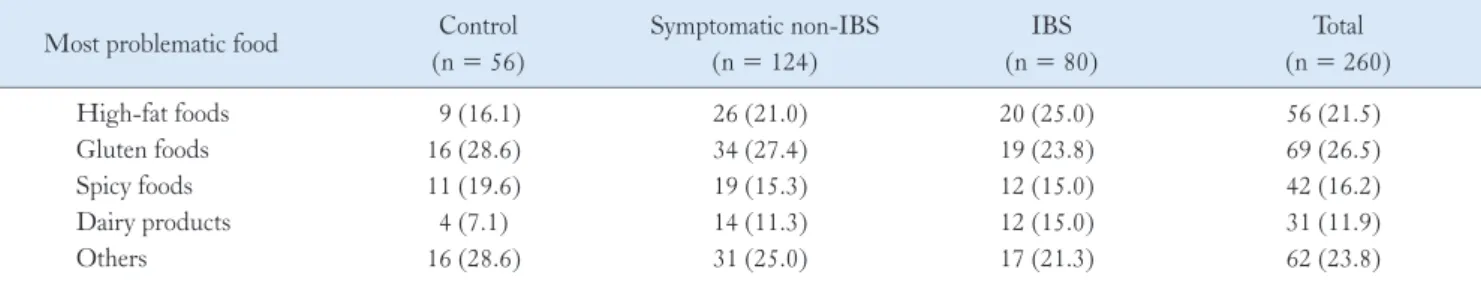
The responses to short-answer questions proved that the “most problematic foods” causing GI symptoms among subjects reporting
food intolerances were high-fat foods for the IBS and symptomatic non-IBS groups (25.0% and 21.0%, respectively) and gluten foods for the control group (28.6%; Table 3A).
The responses to multiple-choice questions proved that the proportions of subjects with GI symptoms were related to the intake of 6 specific food groups (Table 3B). For all food groups except caf- feine, more subjects in the IBS and symptomatic non-IBS groups than in the control group reported symptoms. Among the IBS patients, 63.4% reported GI symptoms related to at least one of the high-FODMAP foods. High-fat foods were also frequently per- ceived to be associated with GI symptoms by Korean IBS patients (48.5%).
Of all the 119 Korean food items, the 55 items cited as prob- lematic by a significantly greater number of IBS patients than con- trol subjects were categorized as “problematic food items,” whereas the remaining 64 food items were categorized as “rarely problem- atic food items” (Supplementary Table 1). IBS patients reported GI symptoms for a median of 3 food items (interquartile range [IQR], 1-9), which was more than that reported by the control group (me- dian value 0; IQR, 0-2) or the symptomatic non-IBS group (median value 2; IQR, 0-10) (P < 0.001; Fig. 2).
Self-reported Food Intolerance and Associated Gastrointestinal Symptoms
The most problematic food-induced GI symptoms reported by IBS patients with food intolerance (n = 80; 79.2% of the IBS group) were loose stool/diarrhea (36.3%) and gas distension/bloat- ing (28.8%; Table 4). In IBS patients with self-reported food intol- erance, concerning the association between specific food groups and GI symptoms, spicy foods were the most commonly reported for
Figure 1.
Frequency of self-reported food intolerance. The prevalence of self-reported food intolerances was significantly higher in the ir- ritable bowel syndrome (IBS) and symptomatic non-IBS groups than in the control group (* P < 0.001).
Table 2.
Korean Food Items Causing Gastrointestinal Symptoms in Korean Patients With Irritable Bowel Syndrome
Ranking Korean food items Food group Patient number
(%) P -value
a1st Whole milk High-FODMAP foods 35 (34.7) < 0.001
2nd Instant ramen High-FODMAP foods and high-fat foods 28 (27.7) < 0.001
3rd Black bean-sauce noodles/Chinese-style noodles with vegetables and seafood
High-FODMAP foods and high-fat foods 25 (24.8) < 0.001
3rd Pork belly High-fat foods 25 (24.8) < 0.001
5th Pizza/hamburger High-FODMAP foods and high-fat foods 24 (23.8) < 0.001
6th Noodle soup High-FODMAP foods 21 (20.8) < 0.001
6th Bread High-FODMAP foods 21 (20.8) < 0.001
8th Processed meat High-fat foods 18 (17.8) < 0.001
a
Pearson’s chi-square test was used to examine the differences between controls and patients with irritable bowel syndrome.
FODMAP, fermentable oligo-, di-, mono-saccharides, and polyols.
abdominal pain (41.7%), gluten foods for gas distension/bloating (47.4%), and high-fat foods for loose stool/diarrhea (50.0%).
Self-reported Food Intolerance With Respect to Irritable Bowel Syndrome Subtype and Severity
IBS subtypes were not associated with food-related GI symp- toms except that abdominal pain was more prevalent in patients with IBS-C (Table 5). The frequency of self-reported food intoler- ance was similar among groups according to IBS symptom severity (Table 6). However, IBS patients with higher symptom severity reported a higher number of food items causing GI symptoms (P = 0.020).
Dietary Changes
To minimize symptoms, 71.3% of IBS patients reported reduc- ing or eliminating specific foods; this proportion was significantly higher than that in the symptomatic non-IBS (58.8%, P = 0.040) and control groups (30.9%, P < 0.001; Fig. 3). IBS patients also attempted the following changes to their diets: increasing fiber intake (11.9%), eating less (10.9%), eating a liquid diet (5.9%), tak- ing probiotics (5.9%), adopting elimination diets (5.0%), avoiding cold foods (5.0%), eating yogurt (3.0%), eating poached vegetables (2.0%), and other dietary changes (7.9%).
Figure 2.
Comparison of the number of food items causing gastro- intestinal symptoms among the 3 groups. Irritable bowel syndrome (IBS) patients reported more food items causing gastrointestinal symptoms than control group and symptomatic non-IBS group (whis- kers: 10th-90th percentiles; * P < 0.001).
Table 3.
Food Groups Reported to Cause Gastrointestinal Symptoms
(A) Foods Reported by Subjects With Self-reported Food Intolerance as Being the “Most Problematic” in Causing Gastrointestinal Symptoms (Results Obtained From the Short-answer Questions)
Most problematic food Control (n = 56)
Symptomatic non-IBS (n = 124)
IBS (n = 80)
Total (n = 260)
High-fat foods 9 (16.1) 26 (21.0) 20 (25.0) 56 (21.5)
Gluten foods 16 (28.6) 34 (27.4) 19 (23.8) 69 (26.5)
Spicy foods 11 (19.6) 19 (15.3) 12 (15.0) 42 (16.2)
Dairy products 4 (7.1) 14 (11.3) 12 (15.0) 31 (11.9)
Others 16 (28.6) 31 (25.0) 17 (21.3) 62 (23.8)
IBS, irritable bowel syndrome.
Values are presented as n (%).
(B) Proportion of Subjects With Gastrointestinal Symptoms Related to the Intake of a Specific Food Group (Results Obtained From the Multiple- choice Questions)
Food group Control
(n = 125)
Symptomatic non-IBS (n = 167)
IBS
(n = 101) P -value
High-FODMAP foods 35 (28.0) 92 (55.1) 64 (63.4) < 0.001
High-fat foods 27 (21.6) 72 (43.1) 49 (48.5) < 0.001
Gluten foods 19 (15.2) 68 (40.7) 44 (43.6) < 0.001
Dairy products 15 (12.0) 49 (29.3) 41 (40.6) < 0.001
Caffeine 12 (9.6) 30 (18.0) 18 (17.8) 0.103
Alcohol 11 (8.8) 31 (18.6) 12 (11.9) 0.046
IBS, irritable bowel syndrome; FODMAP, fermentable oligo-, di-, mono-saccharides, and polyols.
Values are presented as n (%).
Table 4.
Most Problematic Food-induced Gastrointestinal Symptoms Reported by Irritable Bowel Syndrome Patients With Self-reported Food Intolerance (n = 80)
Most problematic symptoms
Most problematic foods Gluten foods
(n = 19)
Spicy foods (n = 12)
High-fat foods (n = 20)
Dairy products (n = 12)
Others (n = 17)
Loose stool/diarrhea (29 [36.3%]) 3 (15.8) 4 (33.3) 10 (50.0) 7 (58.3) 5 (29.4)
Gas distension/bloating (23 [28.8%]) 9 (47.4) 3 (25.0) 2 (10.0) 3 (25.0) 6 (35.3)
Abdominal pain (12 [15.0%]) 1 (5.3) 5 (41.7) 2 (10.0) 2 (16.7) 2 (11.8)
Epigastric fullness (10 [12.5%]) 4 (21.1) 0 (0.0) 4 (20.0) 0 (0.0) 2 (11.8)
Others (4 [5.0%]) 1 (5.3) 0 (0.0) 2 (10.0) 0 (0.0) 1 (5.9)
Missing (2 [2.5%]) 1 (5.3) 0 (0.0) 0 (0.0) 0 (0.0) 1 (5.9)
Values are presented as n (%).
Table 5.
Self-reported Food Intolerance by Irritable Bowel Syndrome Subtype
Items IBS-C
(n = 10)
IBS-D (n = 44)
IBS-M (n = 43)
IBS-U
(n = 4) P -value
Self-reported food intolerance 9 (90.0) 35 (79.5) 32 (74.4) 4 (100.0) 0.501
Number of food items causing GI symptoms 2 (1-7) 3 (0-8) 3 (1-11) 15 (2-35) 0.616
Food-induced symptoms
NAAbdominal pain 3 (33.3) 6 (17.1) 3 (9.4) 0 (0.0)
Gas distension/bloating 3 (33.3) 7 (20.0) 10 (31.3) 3 (75.0)
Loose stool/diarrhea 0 (0.0) 17 (48.6) 12 (37.5) 0 (0.0)
Epigastric fullness 2 (22.2) 2 (5.7) 5 (15.6) 1 (25.0)
Others 1 (11.1) 2 (5.7) 1 (3.1) 0 (0.0)
Missing 0 (0.0) 1 (2.9) 1 (3.1) 0 (0.0)
IBS, irritable bowel syndrome; IBS-C, IBS with constipation; IBS-D, IBS with diarrhea; IBS-M, mixed IBS; IBS-U, unsubtyped IBS; GI, gastrointestinal; IQR, interquartile range; NA, not applicable.
Values are presented as n (%) or median (IQR).
Table 6.
Self-reported Food Intolerance by Irritable Bowel Syndrome Severity
Items Mild
(n = 31)
Moderate (n = 34)
Severe
(n = 29) P -value
aSelf-reported food intolerance 21 (67.7) 29 (85.3) 25 (86.2) 0.124
Number of food items causing GI symptoms 2 (0-6) 3 (0-11) 6 (2-31) 0.020
Food-induced symptoms
Abdominal pain 1 (4.8) 6 (20.7) 4 (16.0)
Gas distension/bloating 4 (19.0) 11 (37.9) 6 (24.0)
Loose stool/diarrhea 8 (38.1) 9 (31.0) 10 (40.0)
Epigastric fullness 6 (28.6) 1 (3.4) 3 (12.0)
Others 1 (4.8) 2 (6.9) 1 (4.0)
Missing 1 (4.8) 0 (0.0) 1 (4.0)
a
Seven irritable bowel syndrome patients without symptom severity score were excluded from this analysis.
GI, gastrointestinal; IQR, interquartile range.
Values are presented as n (%) or median (IQR).
Discussion
About 80% of Korean IBS patients reported food intolerance.
Among the study subjects, the prevalence of food intolerance was the highest in the IBS group, followed by the symptomatic non- IBS group and then the control group. High-fat, high-FODMAP, and spicy foods were considered by many IBS patients to induce their GI symptoms, especially gas problems and loose stools. These features of self-reported food intolerance in Korean IBS patients are comparable to those reported in studies from Western countries. We described in detail the Korean foods perceived by IBS patients to worsen their GI symptoms compared with the control group. Our findings provide a clinical basis for planning food intervention stud- ies for Korean IBS patients.
Food is a well-known trigger of IBS symptom, with 63-90%
of IBS patients reporting that their symptoms are related to food.
8-10,27,28
The prevalence of self-reported food intolerance in Korean IBS patients in the present study is similar to that reported in previous studies.
8-10,28IBS patients reported a greater number of food items causing GI symptoms than that reported by the control group, and patients with more severe IBS reported a greater num- ber of food items causing GI symptoms, suggesting that self-report- ed food intolerance may be associated with a high symptom burden.
Böhn et al
10interpreted such results as being related to increased severity of somatic symptoms and reduced QOL, suggesting that self-reported food intolerance may be associated with patients’ un- derlying psychological issues and over-monitoring of diets.
The most problematic foods for Korean IBS patients were
high-fat foods, high- FODMAP foods, including dairy products and gluten foods, and spicy foods, which were also the most often implicated foods in previous studies. High-fat foods were the most problematic food items reported by Korean IBS patients, and about half of the patients complained of fat-associated GI symptoms. Of the top 8 Korean food items causing GI symptoms, 5 were high-fat foods. Intraluminal lipids normally affect gut motility and sensitivi- ty, and these effects are exaggerated in IBS patients.
29Two duodenal lipid infusion studies reported inhibited gut motility and increased visceral sensitivity in IBS patients, with these responses contributing to IBS symptoms such as gas distension and abdominal pain.
30,31FODMAPs are major dietary contributors to the exacerba- tion of IBS symptoms. The exacerbation is related to the capacity of FODMAPs to increase small intestinal water volume through their high osmotic action, increase colonic gas production by promoting bacterial fermentation, and to their ability to alter intestinal motili- ty.
32In the present study, 63.4% of Korean IBS patients reported GI symptoms related to at least one of the food items with high FOD- MAP content, which is comparable to the proportion of 70.0%
reported in a previous study.
10Randomized controlled trials demon- strated that a diet low in FODMAP effectively reduced global IBS symptom scores and bloating.
12Moreover, low-FODMAP diets have shown outcomes that are similar to or even better than those of traditional IBS dietary advice in IBS treatment.
15,16A significant benefit of low-FODMAP diet on health-related QOL, as well as on improving GI symptoms, has also been demonstrated in a ran- domized controlled study.
33Meanwhile, a recent placebo-controlled dietary advice trial, which made excellent efforts to maintain blind- ing, has shown that the difference in symptom relief between a low- FODMAP diet and a “sham diet” was borderline significant in the intention-to-treat analysis.
34Although there is increasing evidence supporting the use of low-FODMAP diets as an IBS treatment, clinical data supporting the application of this strategy to Korean IBS patients are lacking. Our findings may provide a clinical clue for the application of low-FODMAP diets in Korean IBS patients.
Further studies are warranted to elucidate the FODMAP compo- sition of frequently consumed Korean food items.
Gluten foods were also frequently perceived to be related to GI symptoms by many Korean IBS patients (43.6%). Of the top 8 Korean food items causing GI symptoms, 4 were gluten foods.
Gluten may act on IBS symptoms via altered gut permeability, tight junctional biology, and enhanced systemic immune responses.
35However, the role of gluten in IBS symptoms remains controver- sial. Two randomized controlled studies have shown that gluten causes IBS symptoms in patients with IBS despite an absence of ce-
Control 100
80
60
40
20
IBS
%ofsubjects
0
**
Symptomatic non-IBS 30.9
58.8
71.3
*
Figure 3.