Taurine increases glucose sensitivity of UCP2-
overexpressing -cells by ameliorating mitochondrial metabolism
Jin Han,
4* Jae Hoon Bae,
1* So-Yeon Kim,
1Hyun-Young Lee,
1Byeong-Churl Jang,
2In-Kyu Lee,
2Chi-Heum Cho,
2Jeong-Geun Lim,
2Seong-Il Suh,
2Taeg-Kyu Kwon,
2Jong-Wook Park,
2Shin Young Ryu,
3Won-Kyung Ho,
3Yung-E Earm,
3and Dae-Kyu Song
1,21
Department of Physiology,
2Chronic Disease Research Center, Keimyung University School of Medicine, Daegu 700-712;
3
Department of Physiology, College of Medicine, Seoul National University, Seoul 110-799; and
4Department of Physiology and Biophysics, College of Medicine, Inje University, Busanjin-Gu, Busan 614-735, Korea Submitted 7 January 2004; accepted in final form 18 July 2004
Han, Jin, Jae Hoon Bae, So-Yeon Kim, Hyun-Young Lee, Byeong-Churl Jang, In-Kyu Lee, Chi-Heum Cho, Jeong-Geun Lim, Seong-Il Suh, Taeg-Kyu Kwon, Jong-Wook Park, Shin Young Ryu, Won-Kyung Ho, Yung-E Earm, and Dae-Kyu Song.
Taurine increases glucose sensitivity of UCP2-overexpressing -cells by ameliorating mitochondrial metabolism. Am J Physiol Endocrinol Metab 287: E1008 –E1018, 2004. First published July 20, 2004;
doi:10.1152/ajpendo.00008.2004.—A low-taurine diet during fetal or early postnatal life causes abnormal pancreatic -cell development.
Tissue and plasma taurine concentrations can also be low in diabetic patients. We examined the effect of taurine on impaired glucose responses in diabetic rat -cells adenovirally overexpressing uncou- pling protein (UCP)2, which is upregulated in obesity-related type 2 diabetes. We found that taurine pretreatment restored the ATP-to- ADP (ATP/ADP) ratio and glucose-stimulated insulin secretion in UCP2-infected islets. ATP-sensitive K
⫹channel sensitivity to dihy- droxyacetone, another insulin secretagogue, was similar in both UCP2-infected and control -cells. In freshly isolated mitochondria from UCP2-overexpressing insulin-secreting (INS)-1 -cells, methyl pyruvate-mediated mitochondrial Ca
2⫹increase was significantly ameliorated by taurine. A mitochondrial Ca
2⫹uniporter blocker, ruthenium red, inhibited the action of taurine. This study suggests that taurine enhances the glucose sensitivity of UCP2-overexpressing
-cells, probably by increasing mitochondrial Ca
2⫹influx through the Ca
2⫹uniporter, thereby enhancing mitochondrial metabolic function and increasing the ATP/ADP ratio.
insulin; ATP-sensitive K
⫹channel; mitochondrial Ca
2⫹; ATP-to- ADP ratio; pancreatic islets; uncoupling protein 2
MITOCHONDRIAL OXIDATIVE METABOLISM
plays a pivotal role in the generation of signals coupling glucose recognition to insulin secretion in pancreatic -cells (29). The main physiological secretagogue, glucose, is metabolized in pancreatic -cells, generating NADH (38) and FADH
2(28). Electrons donated from NADH move down the electron transport chain, causing protons to be pumped out of the mitochondrial matrix by complexes I (NADH-ubiquinone oxidoreductase), III (ubiqui- none-cytochrome-c oxidoreductase), and IV (cytochrome oxi- dase), creating a proton electrochemical gradient. FADH
2do- nates electrons to complex II. The reentry of protons through ATP synthase generates ATP from ADP (40), thus increasing the ATP-to-ADP (ATP/ADP) ratio, resulting in the closure of ATP-sensitive K
⫹(K
ATP) channels and plasma membrane
depolarization. This leads to Ca
2⫹influx through voltage-gated Ca
2⫹channels and a rise in cytosolic Ca
2⫹, which is the main trigger for insulin secretion (2).
Prolonged exposure of -cells to high glucose concentra- tions generates oxidative stress, resulting in -cell dysfunction and ultimately cell death (47). Uncoupling protein (UCP)2 (8), a member of the mitochondrial inner membrane carrier family, catalyzes a proton leak, thereby hypopolarizing the mitochon- drial membrane potential and reducing cellular ATP content (7). UCP2 expression in -cells is increased by oxidative stress, suggesting that UCP2 uncoupling activity is physiolog- ically important for -cell defense against oxidants (25). How- ever, glucose-stimulated insulin secretion (GSIS), critical for maintaining normal blood glucose levels, is suppressed when UCP2 is overexpressed in isolated islets (7) or when endoge- nous UCP2 is upregulated by long-term exposure ( ⬎48 h) of
-cells or insulin-secreting (INS)-1 -cells to high glucose (36) or free fatty acids (5, 7, 14, 22, 49). In contrast, mice lacking UCP2 secrete more insulin and recover GSIS (48). Despite its important physiological role, UCP2 can also play a pathogenic role in the development of type 2 diabetes. Therefore, it would be useful to investigate mechanisms that ameliorate GSIS in a UCP2-overexpression model to develop new anti-diabetic ther- apies.
The -amino acid taurine (2-aminoethanesulfonic acid) has many physiological functions in various cell types (20). An important function of taurine is to stimulate Ca
2⫹uptake, and this has been demonstrated in cardiac sarcolemma (42) and rat retina mitochondrial membrane preparations (26). Taurine is reported to potentiate Ca
2⫹sequestration via the Ca
2⫹uniporter em- bedded on the inner membrane in mitochondria isolated from rat liver (34) and neurons (21). Because intramitochondrial Ca
2⫹concentration ([Ca
2⫹]
m) has been observed to activate several dehydrogenases coupled to the Krebs or tricarboxylic acid cycle (30, 39), determinants of [Ca
2⫹]
mmay be critical for controlling -cell metabolic rate. Blocking of [Ca
2⫹]
mefflux in pancreatic -cells with CGP-37157, a mitochondria-specific Na
⫹/Ca
2⫹exchanger antagonist, has been recently shown to increase GSIS (23). Despite the important role of taurine in [Ca
2⫹]
m, its influence has not been emphasized in the [Ca
2⫹]
mdynamics in -cells.
Previously, the effect of taurine on -cells has been inves- tigated mainly in vivo, because short-term taurine treatment in
* J. Han and J. H. Bae contributed equally to this study.
Address for reprint requests and other correspondence: D.-K. Song, Dept. of Physiology, Keimyung Univ. School of Medicine, 194, Dongsan-Dong, Jung- Gu, Daegu 700-712, Korea (E-mail: [email protected]).
The costs of publication of this article were defrayed in part by the payment of page charges. The article must therefore be hereby marked “advertisement”
in accordance with 18 U.S.C. Section 1734 solely to indicate this fact.
First published July 20, 2004; doi:10.1152/ajpendo.00008.2004.
normally functioning -cells in vitro has produced controver- sial results (9, 10, 45). In the present study, we used UCP2- overexpressing -cells (7, 8, 16) to investigate more clearly the effect of taurine in short-term primary cultures and to elucidate the relationship between taurine and UCP2-induced impaired glucose sensitivity. We demonstrate that taurine ameliorates the ATP/ADP ratio in -cells with high UCP2 levels, thereby increasing GSIS, probably by improving [Ca
2⫹]
msequestra- tion through the Ca
2⫹uniporter.
MATERIALS AND METHODS
Collection of pancreatic islets, single islet cells, and INS-1 -cells.
Islets of Langerhans were isolated from the pancreata of male Sprague-Dawley rats, each weighing 200 –250 g, by a collagenase digestion technique as described previously (35). All procedures were approved by the Institutional Animal Care and Use Committee at the Dongsan Medical Institute for Life Sciences in Daegu, Korea. Pre- pared islets or single islet cells were incubated in RPMI-1640 media with 11.1 mM glucose in a humidified atmosphere of 5% CO
2in air at 37°C. INS-1 -cells were grown in monolayer cultures, as previ- ously described (1), in RPMI medium containing 11.1 mM glucose supplemented with 10 mM HEPES, 2 mM glutamine, 1 mM sodium pyruvate, 50 M -mercaptoethanol, and the antibiotics in the same incubator as the -cells. All studies were performed on INS-1 between passages 20 and 30 in appropriate test protocols. No FBS was applied during experimental cultures of INS-1 -cells, pancreatic islets, and islet cells to avoid possible contamination of taurine. After adenovirus infection, these cells were cultured in RPMI medium containing 3 or 5 mM glucose as indicated in the text.
Overexpression of UCP2. A full-length human UCP2 (hUCP2/
pBS) was subcloned into the HindIII/BamHI site of the pAd-YC2 shuttle vector (11). UCP2/pAd-YC2 and rescue vector pJM17 (17) were cotransfected into human embryonic kidney (HEK)-293 cells with Tfx-20 (Promega, Madison, WI), according to the manufactur- er’s protocol. After 12 days, recombinants were identified using PCR.
The recombinants were amplified in HEK-293 cells and purified in a cesium chloride density gradient. Control adenovirus, Ad-Null, was made and identified using the same method. INS-1 or islet cells were infected with Ad-Null [multiplicity of infection (MOI) ⫽ 100 or 500]
or UCP2 adenoviruses (Ad-UCP2; MOI ⫽ 10, 100, or 500) (46). The adenovirus titer was 3.5 ⫻ 10
9plaque-forming units (PFU), and one islet was assumed to have 10
3-cells (7). Virus-treated dishes were incubated for 2 h at 37°C and then washed with RPMI medium. INS-1 and islet cells were maintained for at least 48 h after infection, after which time experimental data were collected.
Subcellular fractionation. INS-1 -cells were initially infected with 100 MOI of Ad-UCP2 or Ad-Null for 24 h and then treated with 3 or 15 mM glucose for an additional 48 h. Cells were then washed with PBS and lysed in buffer A [0.25 M sucrose, 30 mM Tris 䡠HCl (pH 7.9), 1 mM EDTA, 0.5% Nonidet P-40, and protease inhibitor cocktails ( ⫻1)] along with short homogenization in a tissue grinder. Cells were then centrifuged at low speed for 5 min. The supernatant was further centrifuged at 14,000 g for 45 min. The pellet was washed with buffer A and lysed in buffer B (buffer A plus 3.6% Triton X-100) with sonication (35 strokes). The lysate was then centrifuged at 14,000 g for 15 min. The resultant supernatant was saved as Triton X-100- soluble fraction. The remaining pellet was washed with buffer B and lysed in buffer C (buffer B plus 1% SDS) with sonication (35 strokes).
After centrifugation at 14,000 g for 15 min, the supernatant was saved as Triton X-100-insoluble fraction. The protein concentration of each fraction was determined.
Western blot analysis. INS-1 -cells infected with Ad-UCP2 (10, 100, or 500 MOI) or Ad-Null (500 MOI only) for 48 h were washed and lysed in a buffer [50 mM Tris 䡠HCl (pH 7.4), 150 mM NaCl, 1%
Triton X-100, 1% SDS, 1% Nonidet P-40, 1 mM EDTA, 200 nM
aprotinin, 20 M leupeptin, 50 M phenanthroline, and 280 M benzamidine-HCl]. After centrifugation, the supernatant was col- lected, and the protein concentration was determined. Equal amounts of protein were resolved by 10% SDS-PAGE and transferred onto a nitrocellulose membrane (Millipore, Bedford, MA). The membrane was washed with Tris-buffered saline (TBS; 10 mM Tris, 150 mM NaCl) containing 0.05% Tween 20 (TBST) and blocked in TBST containing 5% nonfat dried milk. The membrane was incubated with antibodies of UCP2 (1:1,000; Alpha Diagnostic International, San Antonio, TX), prohibitin (1:1,000; NeoMarkers, Fremont, CA), or actin (1:10,000; Sigma, St. Louis, MO). After wash, the membrane was continuously incubated with appropriate secondary antibodies coupled to horseradish peroxidase and developed in enhanced chemi- luminescence Western detection reagents.
Measurement of insulin secretion and insulin content in islets.
Insulin secretion from islets was measured by RIA by use of the batch incubation method. The islets were preincubated for 1 h at 37°C in a modified Krebs-Ringer bicarbonate (KRB) buffer with 0.1% BSA and no glucose. Ten islets were then placed into each well of a 48-well plate containing glucose at the concentrations indicated. After incu- bation for 1 h at 37°C, an aliquot was taken from each well and centrifuged (700 g, 5 min), and the supernatant (200 l) was carefully collected and stored ( ⫺20°C). To determine insulin content, the remaining islet pellet was washed in 400 l of RPMI-1640 medium and lysed in 150 l of ice-cold lysis buffer (50 mM HEPES, 0.1%
Triton X-100, 1 M phenylmethylsulfonyl fluoride, 10 M E-64, 10
M pepstatin A, 10 M tosyl-
L-lysine chloromethyl ketone, and 100
M leupeptin; pH 8.0). After sonication and centrifugation (10,000 g, 2 min), the resultant supernatant was assayed for final insulin content (expressed as ng/ng DNA). Total islet insulin content was calculated by adding insulin secreted into the supernatant plus that remaining in the islet pellet. Percentage of islet insulin content secreted was calculated for each data point to eliminate variance caused by islet size and hence insulin content (7). Aliquots of the islet homogenates were also used for islet DNA quantification with DNeasy Tissue Kit (Qiagen, Valencia, CA). Rat insulin assay kits were purchased from Linco Research (St. Charles, MO). The mean from three consecutive batches with the same condition was taken as one data point. The number of data points (n) was obtained in at least three separate experiments.
Recording of single K
ATPchannel activity. The cell-attached con- figuration of the conventional patch-clamp technique was used. Patch pipettes had a resistance of 3–5 M ⍀. The single-channel currents were recorded using an Axopatch 200B patch-clamp amplifier (Axon In- struments, Forster, CA) and later analyzed with pClamp 8.2 software (Axon). Data were filtered at 1 kHz and sampled at 5 kHz. The channel activity was compared by use of the channel open probability (P
o) calculated from the following formula
P
o⫽ 冢
兺j⫽1Nt
j䡠 j 冣 / 共T
d䡠 N兲 (1)
where t
jis the time spent at current levels corresponding to j ⫽ 0, 1, 2, . . .N channels in the open state; T
dis the duration of the recording;
and N is the number of channels active in the patch. The number of
channels in a patch was estimated by dividing the maximum current
observed in the control solution by the mean unitary current ampli-
tude. The relative channel activity in the presence of glucose was
described as P
o/P
oc, where P
ocis the P
orecorded during the 30 s just
before administration of glucose. During experiments, single islet
cells on a cover glass (10 mm ⫻ 2 mm) were bathed in a solution
composed of (in mM) 137 NaCl, 5.6 KCl, 1.2 MgCl
2, 2.6 CaCl
2, and
10 HEPES, adjusted to pH 7.4 with NaOH. The pipette solution
contained (in mM) 140 KCl, 1.2 MgCl
2, 2.6 CaCl
2, and 10 HEPES,
adjusted to pH 7.4 with KOH. The experiments were done at room
temperature (20 –22°C).
ATP and ADP measurements. ATP and ADP were assayed by luciferase measurement (Sigma) according to the manufacturer’s protocol. ATP was assayed directly. For ADP measurements, ATP was first hydrolyzed to AMP with the use of ATP-sulfurylase. After inactivation of the sulfurylase, ADP was converted to ATP with pyruvate kinase and phosphoenolpyruvate and was quantified by luciferase measurement (41). Islets were starved for 2 h in glucose- free KRB buffer before 15-min exposure at 37°C to indicated con- centrations of glucose.
Measurement of cytosolic Ca
2⫹concentration. Microfluorescent imaging of cytosolic Ca
2⫹concentration ([Ca
2⫹]
c) was performed on single islet cells loaded with the Ca
2⫹indicator dye fura-2 AM. Some of the procedures used in Ca
2⫹imaging in this experiment have been previously described (3). Fura-2 AM (3 M) was added to islet cells, which were cultured on a coverslip (25 mm in diameter) and bathed in PBS at room temperature for 30 min followed by a 30-min wash in dye-free PBS to allow esterase conversion to free fura-2. A coverslip was placed on the stage of an inverted microscope, and imaging was performed with an InCa dual-wavelength system (Intracellular Imag- ing, Cincinnati, OH). Each experimental data point represents the mean [Ca
2⫹]
ccalculated from at least 20 –30 individually measured cells from three separate cultures. All imaging experiments were done at room temperature.
Immunofluorescence and confocal laser scanning microscopy im- aging. Indirect immunofluorescence was carried out to determine colocalization of UCP2 and cytochrome-c oxidase (COX) in INS-1
-cells. Cells were fixed in 4% formaldehyde in PBS, permeabilized in 0.075% Triton X-100, and blocked in 2 mg/ml BSA and 0.1%
Tween-20 for 1 h at room temperature. Primary antibody incubations were performed for 1 h at room temperature in 2 mg/ml of BSA and 0.1% Tween-20 plus antibodies at the following dilutions. Rabbit antibody against UCP2 (Alpha Diagnostic) was used at a dilution of 1:1,000, and mouse antibody against COX (Molecular Probes, Eu- gene, OR) was used at a dilution of 1:200. Antigen-antibody com- plexes were visualized with Alexa Fluor 488-conjugated Zenon rabbit IgG labeling kit (Molecular Probes) and Alexa Fluor 568-conjugated Zenon mouse IgG labeling kit (Molecular Probes). Cells were mounted on slides in ProLong Antifade (Molecular Probes). Confocal images were collected with the use of an LSM-510 META confocal microscope system (Carl Zeiss, Jena, Germany) equipped with a krypton-argon Omnichrome laser, with excitation wavelengths of 488 nm for the detection of Alexa Fluor 488 and 578 nm for Alexa Fluor 568. They were visualized under an inverted microscope (Axiovert 200 M BP, Carl Zeiss) at ⫻200, ⫻400, and ⫻630 with the appropriate laser lines and filter sets. Images were analyzed using LSM-510 META software (release 3.2; Carl Zeiss).
Preparation of mitochondria and [Ca
2⫹]
mmeasurement. Mito- chondria were collected and purified from individual INS-1 -cells by discontinuous Percoll gradient purification. Individual INS-1 -cells were homogenized in homogenization buffer with the use of a Dounce homogenizer before being centrifuged (3 min, 1,300 g, 4°C) in a swing-out rotor. The supernatant was then centrifuged (10 min, 21,000 g, 4°C) in an angle rotor. The pelleted cells were resuspended in 15% Percoll solution, layered in a tube that contained 23 and 40%
Percoll solution in the same homogenization buffer, and centrifuged (5 min, 31,000 g, 4°C). Mitochondria were collected (at the lowest interface band), washed, and diluted in hypertonic solution. All procedures were carried out on ice, and all implements were cooled in a refrigerator before use. To assess the purity of the mitochondrial preparation, samples were stained with the mitochondria-specific red fluorescent probe MitoTracker Red CMXRos. As a negative control, samples were stained with the endoplasmic reticulum marker ER- Tracker Blue-White DPX.
[Ca
2⫹]
mwas determined by use of the fluorescent Ca
2⫹indicator fura-2. Freshly isolated mitochondria were dispersed in a cytosol-like solution and energized by the addition of 5 mM malate and 5 mM glutamate. Mitochondria were loaded with fura-2 AM (3 M) for 60
min on ice under continuous stirring. The loaded mitochondria were then washed twice with fresh solution, diluted 1:10, placed in ultra- violet-grade fluorometric cuvettes (Spectrocel), and continuously stirred at room temperature. Sulfinpyrazone (250 M) was added to all solutions to prevent dye leakage. For the fluorometric measurement of [Ca
2⫹]
m, we used a delta-SCAN Photon Technology International Spectrofluorometer System (PTI, South Brunswick, NJ). Fluorescence ratios were monitored with dual excitation at 340 and 380 nm (F
340/F
380) and emission at 510 nm.
In mitochondrial preparation, the homogenization buffer contained 320 mM sucrose, 1 mM K-EDTA, 0.1% BSA, and 10 mM Tris 䡠HCl, titrated to pH 7.2 with KOH. The wash solution contained 150 mM KCl, 1 mM K-EGTA, 0.1% BSA, and 20 mM K-HEPES, titrated to pH 7.2 with KOH. The hypertonic solution contained 750 mM KCl, 1 mM K-EGTA, and 100 mM K-HEPES, titrated to pH 7.2 with KOH. As a measurement of [Ca
2⫹]
m, a cytosol-like solution con- tained 150 mM KCl, 2 mM KH
2PO
4, 5 mM MgCl
2, 10 mM HEPES, 0.5 mM EGTA, and 500 nM CaCl
2, titrated to pH 7.2 with KOH.
Fluorescent probes were purchased from Molecular Probes. All other reagents were obtained from Sigma.
Statistical analysis. Data are expressed as means ⫾ SE. Statistical significance was evaluated by unpaired Student’s t-test when only two groups were involved. Multiple comparisons were made by ANOVA.
P ⬍ 0.05 was considered significantly different.
RESULTS
Adenoviral vector-mediated overexpression of UCP2 in INS-1 -cells. To endogenously overexpress UCP2, INS-1
-cells were infected with Ad-UCP2 (10, 100, or 500 MOI) or Ad-Null (500 MOI only) in the presence of low glucose (3 mM) for 48 h. As shown in Fig. 1A, there was little expression of UCP2 in Ad-Null-infected INS-1 cells (lane 1), whereas there was a concentration-dependent increase of UCP2 expres- sion in INS-1 -cells when the concentrations of Ad-UCP2 were increased (lanes 2– 4). For example, ⬃30-fold induction of UCP2 protein was seen in INS-1 -cells that were infected with 100 MOI of Ad-UCP2 compared with endogenous UCP2 protein level in Ad-Null-infected cells, as measured by densi- tometer (data not shown).
It has been previously reported that, when UCP3 protein, another member of the UCPs, is adenovirally overexpressed in muscle-derived L6 cells, this protein mainly localizes to the mitochondria, and UCP3 protein localized to the mitochondria is insoluble by 3.6% Triton X-100, a strong nonionic detergent (18). To examine whether UCP2, when adenovirally overex- pressed in INS-1 -cells, also localizes to the mitochondria and whether UCP2 localized into the mitochondria is elutable by Triton X-100, biochemical subcellular fractionation and sub- sequent UCP2 Western analysis were carried out in INS-1
-cells infected with 100 MOI of Ad-Null or Ad-UCP2 and then further grown in the presence of 15 mM high glucose for 48 h. The data of UCP2 Western analysis showed that, when induced by high glucose in Ad-Null INS-1 -cells or by Ad-UCP2 infection in INS-1 -cells, UCP2 localized to the mitochondria (data not shown). However, unlike UCP3, a majority of mitochondrial UCP2 protein was readily elutable by 3.6% Triton X-100 (Fig. 1B).
Expression of UCP2 protein in INS-1 -cells and mitochon-
dria. To confirm that the transfection of UCP2 using adenovi-
rus had succeeded in the mitochondria, we performed dual-
immunofluorescent labeling studies to detect colocalization
within fixed Ad-UCP2-infected INS-1 -cells. We used a
Fig. 1. Overexpression and cellular localization of uncoupling protein (UCP)2 in insulin-secreting (INS)-1 -cells after high glucose administration or human UCP2 gene-delivering adenovirus infection. A: INS-1 -cells were infected with Ad-UCP2 [multiplicity of infection (MOI) ⫽ 10, 100, or 500] or Ad-Null (500 MOI only) in the presence of 3 mM glucose for 48 h. Total cell lysates were prepared and analyzed for UCP2 or actin Western blot. B: INS-1 -cells were infected with either 100 MOI Ad-UCP2 or Ad-Null for 24 h in the presence of 3 mM glucose. At 24 h postinfection, cells were further exposed to 15 mM glucose for an additional 48 h, after which a mitochondrial fraction was isolated. To assess the solubility of mitochondrial UCP2 protein by Triton X-100, the isolated mitochondrial fraction was further extracted with a high concentration of Triton X-100 (3.6%). Triton X-100 (3.6%)-insoluble (I) and -soluble (S) mitochondrial protein extracts were analyzed for Western blot for UCP2 or prohibitin, a Triton X-100-soluble mitochondrial protein.
Fig. 2. Expression of UCP2 protein in adenoviral-infected INS-1 -cells and mitochondria. For immunofluorescence analysis of UCP2 protein in Ad-UCP2- infected INS-1 -cells, the cells were fixed, permeabilized, and stained for cytochrome-c oxidase (COX; A) and UCP2 (B) using mouse anti-COX and rabbit anti-UCP2 antibody. Confocal images were collected with identical iris settings. Overlay of red and green channels (C) was created to examine the degree of colocalization. Yellow or orange areas represent regions of colocal- ization. D: transmitted light with differential interference contrast optics. All images were captured at ⫻630 magnification. Scale bar ⫽ 5 m.
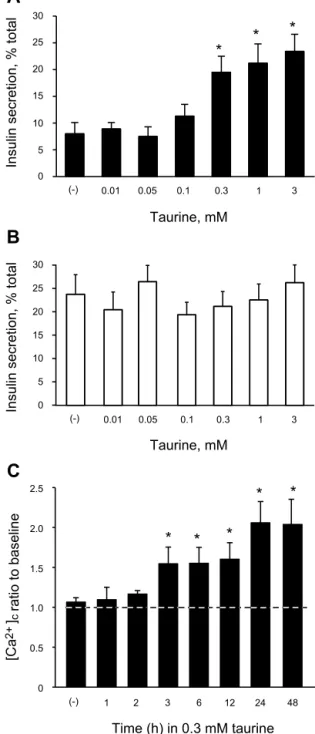
Fig. 3. Determination of the optimal concentration and duration for taurine pretreatment. A: changes in glucose-stimulated insulin secretion (GSIS) in Ad-UCP2-infected islets after 24-h pretreatment with various concentrations of taurine. Percentages of total insulin content secreted for each group during 1-h incubation in 15 mM glucose are shown. Symbols represent means ⫾ SE; n ⫽ 3– 6 for each mean. *P ⬍ 0.05 compared with taurine-free control. B: changes in GSIS in Ad-Null-infected islets after 24-h pretreatment with various con- centrations of taurine. Symbols represent means ⫾ SE; n ⫽ 3–6 for each mean.
C: relative changes in glucose-stimulated cytosolic Ca
2⫹concentration
([Ca
2⫹]
c) increase in Ad-UCP2-infected islets after pretreatment for various
times with 0.3 mM taurine. Symbols represent means ⫾ SE obtained from
normalization using the average [Ca
2⫹]
cduring the 5-min exposure to glucose
and the average [Ca
2⫹]
cduring the 1 min before glucose application, with the
dashed line indicating the level of [Ca
2⫹]
cbefore glucose application in each
group; n ⫽ 18–23 for each mean. *P ⬍ 0.05 compared with taurine-free
control.
mouse antibody directed against COX (Fig. 2A), which has been described to be mitochondria located, in conjunction with a rabbit antibody directed against UCP2 (Fig. 2B). As shown in Fig. 2C, there was a colocalization between COX and UCP2, indicating that UCP2 localizes specifically to mitochondria.
Determination of the optimal concentration and duration for taurine pretreatment. We measured whether GSIS could be changed in Ad-Null- or Ad-UCP2-infected islets by pretreat- ment with taurine for 24 h. It has been previously shown that the infection of islets with adenovirus does not significantly affect insulin secretory capacity (50). GSIS induced by 15 mM glucose, expressed as a percentage of total islet insulin content released, was significantly increased by pretreatment with 0.3 mM taurine (Fig. 3A). We therefore used 0.3 mM taurine for the subsequent experiments. However, taurine pretreatment in the range of concentrations tested had no effect on GSIS in Ad-Null-infected islets (Fig. 3B). Second, we measured [Ca
2⫹]
cin response to 10 mM glucose in Ad-UCP2-infected islet cells without or with 0.3 mM taurine pretreatment for various times (Fig. 3C). Taurine caused a significant glucose- stimulated [Ca
2⫹]
cincrease after 3 h of pretreatment. The increase reached a maximum at 24 h, which was used as the duration of pretreatment in the following experiments. During experiments, except for [Ca
2⫹]
mmeasurements, 0.3 mM tau- rine was present in all solutions for the taurine group.
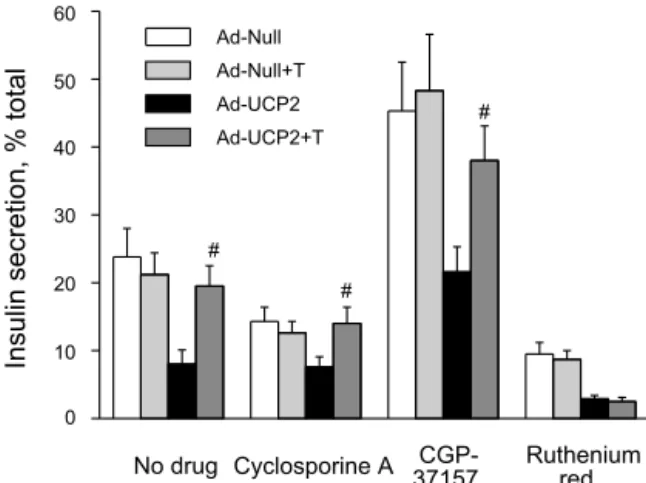
Effect of 0.3 mM taurine pretreatment for 24 h on GSIS and islet insulin content. As shown in Fig. 4A, there was no significant difference in islet insulin content when measured after 48-h incubation with 5 mM glucose in Ad-Null- or Ad-UCP2-infected islets in the absence or presence of 0.3 mM taurine. Exposing the islets to 15 mM glucose for 1 h showed a decrease of insulin secretory response in Ad-UCP2-infected islets (Fig. 4B; 31.7 ⫾ 5.9 pg/ng DNA, n ⫽ 6, vs. 75.5 ⫾ 6.2 in Ad-Null, n ⫽ 6, P ⬍ 0.05). Ad-UCP2-infected islets with taurine pretreatment ( ⫹T) exhibited remarkably ameliorated GSIS (60 ⫾ 4.7 pg/ng DNA vs. Ad-UCP2 group, n ⫽ 6, P ⬍ 0.05). As expected, final insulin content after high glucose stimulation for 1 h was greater in taurine-free Ad-UCP2- infected islets (0.36 ⫾ 0.04 ng/ng DNA, n ⫽ 6) than in the other three groups (Fig. 4C; 0.25 ⫾ 0.03 ng/ng DNA in Ad-Null, 0.26 ⫾ 0.03 in Ad-Null ⫹ T, n ⫽ 6, and 0.25 ⫾ 0.02 in Ad-UCP2 ⫹ T groups). Fractional insulin secretion by high glucose was also significantly impaired in Ad-UCP2-infected islets (Fig. 4D; 8 ⫾ 2.1% vs. 23.8 ⫾ 4.2%, P ⬍ 0.05, in Ad-Null), but it was recovered in Ad-UCP2 ⫹ T islets (19.5 ⫾ 3% vs. Ad-UCP2 group, P ⬍ 0.05). Basal insulin secretory capacity at 5 mM glucose did not significantly differ among the
groups (P ⬎ 0.05). Simultaneous pretreatment with taurine and guanidinoethane sulfonate, a Na
⫹-dependent taurine trans- porter inhibitor, totally blocked the taurine action, implying that taurine has its effect within the cell, not on the external cell surface (data not shown).
Fig. 4. Effect of taurine on insulin secretion and insulin content in adenovirus- infected islets. A: islet insulin contents obtained from Ad-Null- or Ad-UCP2- infected islets after 48-h incubation in 5 mM glucose in the absence or presence ( ⫹T) of taurine pretreatment. B: static insulin secretion from Ad- Null- or Ad-UCP2-infected islets in the absence or presence of taurine pretreatment. Islets of each group were incubated in 5 or 15 mM glucose for 1 h. C: final insulin contents obtained from corresponding islets in B. D:
fractional insulin secretion expressed as a percentage of total insulin content
secreted. Total insulin content is the sum of final insulin content and corre-
sponding secreted insulin. Symbols represent means ⫾ SE. Insulin content and
insulin secretion were corrected using the islet DNA content. Islets taken after
1-h incubation for insulin secretion were retrieved and extracted for insulin
content measurement. The same islet homogenates were used to measure islet
DNA content. *P ⬍ 0.05 compared with Ad-Null-infected group; #P ⬍ 0.05
compared with Ad-UCP2-infected group.
Effect of taurine on the [Ca
2⫹]
cresponse to high glucose stimulation. Resting [Ca
2⫹]
cin the three groups (Ad-Null, Ad-UCP2, and Ad-UCP2 ⫹ T) at 3 mM glucose ranged from 50 to 100 nM. Application of high glucose (10 mM) through the bath solution elicited a gradual increase in [Ca
2⫹]
cin Ad-Null-infected islet cells, with a time lag of ⬃10 s (Fig. 5A).
The Ad-UCP2-infected islet cells showed almost no glucose- stimulated [Ca
2⫹]
celevation during the periods of the experi- ments, but, in taurine-pretreated UCP2-infected cells, the high glucose could elicit the increase in [Ca
2⫹]
c(Fig. 5B). The [Ca
2⫹]
cin the Ad-UCP2 group could be increased by the application of glibenclamide, a well-known blocker of the K
ATPchannel, comparable with the response of the Ad-Null group (Fig. 5, C and D, respectively).
Effect of taurine on the glucose sensitivity of K
ATPchannels.
If pretreatment with taurine substantially makes it possible to induce a glucose-stimulated [Ca
2⫹]
cincrease in UCP2-overex- pressing islet cells, the K
ATPchannel sensitivity to glucose should also be increased to trigger membrane depolarization.
In the cell-attached patch clamp mode, 10 mM glucose was added to the bath solution. The glucose sensitivity of K
ATPchannels in Ad-UCP2-infected -cells was considerably lower than that of Ad-Null-infected -cells (Fig. 6). This reduced sensitivity to glucose significantly recovered with taurine pre-
treatment. Substitution of methylpyruvate for glucose, bypass- ing glycolysis, showed the same electrophysiological results as glucose (data not shown), suggesting that taurine exerts its effect downstream of glycolysis. The K
ATPchannel sensitivity to glibenclamide in Ad-UCP2-infected -cells remained nor- mal (Fig. 6B, trace 3).
Effect of taurine on adenine nucleotide levels and the ATP/
ADP ratio. ATP and ADP levels and the ATP/ADP ratio between Ad-Null and Ad-Null ⫹ T islets were not different either in basal glucose or in high glucose stimulation (Table 1).
However, Ad-UCP2-infected islets exhibited remarkably lower ATP levels and ATP/ADP ratios and higher ADP levels com- pared with Ad-Null-infected control in both cases. These impaired parameters were significantly improved by the taurine pretreatment, showing more ATP and less ADP (thus higher ATP/ADP ratios), suggesting that a substantial amelioration of the ATP/ADP ratio occurred in Ad-UCP2 ⫹ T islets.
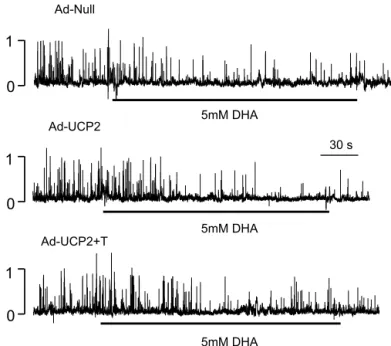
Dihydroxyacetone-induced K
ATPchannel inhibition. Dihy- droxyacetone (DHA) renders FADH
2to complex II of the mitochondrial electron transport system directly through the glycerophosphate shuttle, bypassing the TCA cycle (43). To investigate the cause of reduced GSIS in UCP2-overexpressing islets, we examined the DHA-induced K
ATPchannel inhibition in Ad-UCP2- and Ad-Null-infected -cells. Our assumption
Fig. 5. Effect of taurine on [Ca
2⫹]
cresponse to high glucose. A: glucose-stimulated [Ca
2⫹]
cin Ad-Null- (n ⫽ 22) and
Ad-UCP2-infected (n ⫽ 20) islet cells without taurine pretreatment. B: glucose-stimulated [Ca
2⫹]
cin Ad-UCP2-infected islet cells
with 0.3 mM taurine pretreatment for 24 h (n ⫽ 20). Glibenclamide-stimulated [Ca
2⫹]
cin Ad-UCP2- (C; n ⫽ 23) and
Ad-Null-infected (D; n ⫽ 17) islet cells without taurine pretreatment. Symbols represent means ⫾ SE.
was that if K
ATPchannel inhibition was normal in Ad-UCP2- infected -cells, the sites responsible for the impairment of high glucose sensitivity, i.e., those responsible for reduced ATP production by Ad-UCP2 infection, could be within the TCA cycle upstream of the electron transport system. In fact, externally applied DHA in the cell-attached mode inhibited K
ATPchannel activity in Ad-UCP2-infected -cells to the same extent as in Ad-Null-infected controls (Fig. 7). The above finding revealed that the defect of GSIS in UCP2-overexpress- ing -cells may be due to more than UCP2-mediated proton leak in response to incoming reducing equivalents; rather, it may be due to reduced metabolism of glucose metabolites in the TCA cycle secondary to UCP2 overexpression.
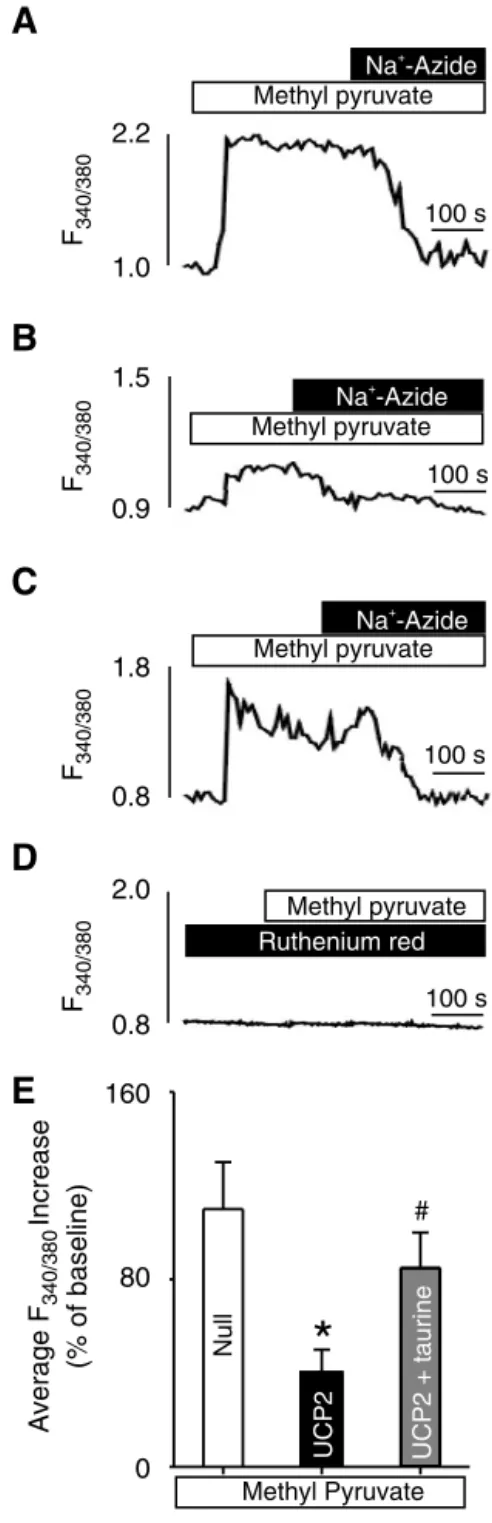
Effect of taurine on methyl pyruvate-induced increases in [Ca
2⫹]
m. We hypothesized that taurine might increase [Ca
2⫹]
mreduced by UCP2 overexpression, thereby potentiating mito- chondrial glucose metabolism and leading to more glucose-
Fig. 7. Dihydroxyacetone (DHA)-stimulated K
ATPchannel inhibition in Ad- Null control, Ad-UCP2, and Ad-UCP2 ⫹ T -cells. Cell-attached mode at a membrane potential of 0 mV. DHA (5 mM) was applied to the bath solution where indicated. Vertical scales indicate the no. of channels. T, pretreatment with 0.3 mM taurine for 24 h.
Fig. 6. Effect of taurine on glucose-stimu- lated ATP-sensitive K
⫹(K
ATP) channel in- hibition. A: effect of 10 mM glucose on K
ATPchannel activity in Ad-Null, Ad-UCP2, and Ad-UCP2 ⫹ T -cells. Cell-attached mode at a holding potential of 0 mV. Vertical scales indicate the no. of channels. B: repre- sentative traces in a larger time scale show- ing the effect of glucose on K
ATPchannel activity in Ad-Null, Ad-UCP2, and Ad- UCP2 ⫹ T -cells. Glibenclamide at 10 M easily blocked the channels of the glucose- insensitive Ad-UCP2-infected -cell. O, open state; C, closed state. C: time course of K
ATPchannel inhibition by glucose in Ad- Null (n ⫽ 5), Ad-UCP2 (n ⫽ 5), and Ad- UCP2 ⫹ T (n ⫽ 5). Open probability (P
o) measured in the presence of 10 mM glucose was normalized relative to P
omeasured im- mediately before exposure to glucose (P
oc).
Symbols represent means ⫾ SE. T, pretreat- ment with 0.3 mM taurine for 24 h. *P ⬍ 0.05 and #P ⬍ 0.05 compared with Ad- UCP2.
Table 1. Effect of taurine on ATP levels and the ATP/ADP ratios in islets
Null Null⫹ T UCP2 UCP2⫹ T

![Fig. 5. Effect of taurine on [Ca 2⫹ ] c response to high glucose. A: glucose-stimulated [Ca 2⫹ ] c in Ad-Null- (n ⫽ 22) and Ad-UCP2-infected (n ⫽ 20) islet cells without taurine pretreatment](https://thumb-ap.123doks.com/thumbv2/123dokinfo/5010913.306357/6.931.107.827.538.1077/effect-taurine-response-glucose-glucose-stimulated-infected-pretreatment.webp)